USDMXN


LONG POSITION USDMXN UPTDAYSix days ago I published a idea about a long position in USDMXN, and now the price is in our entry, it is possible a new entry in 15 min (entry after entry).

USD/MXN & USD/ZAR - Short Sell Trend Analysis In this video, we look at the U.S Dollar's current strength against the Mexican peso and South African Rand being caused by rising U.S Government 10 Year Bond Yields.
The trends remain firmly in play for more dollar weakness, and potentially additional selling opportunities for both currency pairs.

There is a possibility of the beginning an uptrend in USDMXNMidterm forecast:
While the price is above the support 19.5970 , beginning of uptrend is expected.
If the support at 19.5970 is broken, the short-term forecast -beginning of uptrend- will be invalid.
Technical analysis:
Price is below WEMA21, if price rises more, this line can act as dynamic resistance against more gains.
Relative strength index (RSI) is 37.
❤️ If you find this helpful and want more FREE forecasts in TradingView
. . . . . Please show your support back,
. . . . . . . . Hit the 👍 LIKE button,
. . . . . . . . . . Drop some feedback below in the comment!
❤️ Your Support is very much 🙏 appreciated! ❤️
💎 Want us to help you become a better Forex trader ?
Now, It's your turn !
Be sure to leave a comment let us know how you see this opportunity and forecast.
Trade well, ❤️
ForecastCity English Support Team ❤️

There is a possibility of the beginning an uptrend in USDMXNMidterm forecast:
While the price is above the support 19.5970 , beginning of uptrend is expected.
If the support at 19.5970 is broken, the short-term forecast -beginning of uptrend- will be invalid.
Technical analysis:
Price is above WEMA21, if price drops more, this line can act as dynamic support against more losses.
Relative strength index (RSI) is 48.
❤️ If you find this helpful and want more FREE forecasts in TradingView
. . . . . Please show your support back,
. . . . . . . . Hit the 👍 LIKE button,
. . . . . . . . . . Drop some feedback below in the comment!
❤️ Your Support is very much 🙏 appreciated! ❤️
💎 Want us to help you become a better Forex trader ?
Now, It's your turn !
Be sure to leave a comment let us know how you see this opportunity and forecast.
Trade well, ❤️
ForecastCity English Support Team ❤️

USDMXN potential bottomUSDMXN has been in a deep move down and now has a what might become a potential bottom. Breaking the trendline (points where it tested are circled in red) would be a good signal...looks like the trendline with the fib line (orange horizontal line) might be the intersect, around 20.25.
By breaking, we would like to see a daily break and ideally a weekly break above.


USDMXN, USD remain weaker against Mexican PesoAccording to 28th USA opening session, USD is encountered as bearish and in upcoming trading sessions we expect that USD will remain weaker against Mexican Peso.
Meanwhile if we see the the graph technically, the price is rejected from a resistance which shows the negative pressure valid.
If you like this idea like and do comment if you have any query.


USDMXN Long Opportunity...Area of Support!!!From our chart, we can currently see that price level for USDMXN is at the 161.8% fib level. We can see that this movement act as a retest to the trend support level (dotted line) with a potential to see price moving to the upside. Price level is also consolidating near the support @19.8000 price level. I am expecting strong support pressure here and will see it moving towards the trend resistance level (also 100% fib level). Further movement will be confirmed after we see a rejection or a breakout. As of now, I will trade the BULLISH movement to the trend resistance.
Kindly hit the LIKE Button if you agree with my analysis and feel free to COMMENT your idea below. As for those who are keen to get daily updates and analysis from me feel free to FOLLOW me. Cheers and Happy Trading!!


ridethepig | BRL for the Yearly Close📌 BRL for the Yearly Close
This diagram illustrates the LT map for those in BRL and tracking Brazil for good opportunities into 2021. According to my INR maps, again a very similar cycle count which is decisive for profit taking:
The BRL now has the attacking position at the highs after completing a multi decade 5 wave cycle from 1.50 towards 6.00. But here is the weakness, we are already seeing profit taking as the USD enters into a structural decline, we have yet to mention the advantage Brazil has with particular focus on the agriculture side.
The correct ways to play this in equities also come from companies like $ALTA which was one of the first gold mining companies to capture the 2020 flows in Brazil. It is reaching an initial target to that in the expectations, now add BRL appreciation to the mix and you can see how we arrive at the 600% targets:
A very good luck to those looking for opps in Brazil, the currency is not afraid of the flank attack and note anyway that you can capture value on Brazilian exports into countries like USD and MXN. Just note how nearest support at 4.63x is -10% from here and the extension below at 3.9xx is -23% from current levels, both are in play for 2021.
Thanks as usual for keeping the feedback coming 👍or 👎


SEGUIMIENTO DE COMPRAS?HE COMENZADO A OPERAR ESTE PAR YA QUE ME PARECE BASTANTE INTERESANTE, LA PRIMER COMPRA (NO MARCADA AQUI) NO ME LA RESPETO Y ME TOCO SL PARA DESPUES IRSE A MI TP. LA SEGUNDA COMPRA QUE METI (TAMPOCO MOSTRADA AQUI), ME LA RESPETO Y COMO MIS EMAS ME SIGUEN REPSETANDO AL IGUAL QUE EL STICH POR ESO DECIDI METER UNA TERCER COMPRA.. LA RESPETARA?


USD/MXN Multi-Timeframe analysis- update!!!Hello Traders, here is the full analysis for this pair, let me know in the comment section below if you have any questions, the entry will be taken only if all rules of the strategies will be satisfied. I suggest you keep this pair on your watchlist and see if the rules of your strategy are satisfied.


USD MXN BUY (US DOLLAR - MEXICAN PESO)Hi there. Price is forming a reversal pattern to change its direction.
These are the fundamental reasons for a possible USD/MXN bullish scenario:
Sentiment shifts:
Bullish scenario:
A breakdown in US stimulus talks and a possible towards a government shutdown; FDA rejecting or postponing the approval of the Pfizer vaccine; a breakdown in Brexit talks with no deal by EU summit.
In this scenario we would expect to see downside in equities across the board, with US equities expected to fall more if we see US stimulus talks break down and more downside for EU equities if we see Brexit talks collapse and upside in the dollar across the board.
Strong equity sell offs are usually accompanied with some support for the US dollar as the world’s reserve currency and with its safe haven status as well as Japanese yen and Swiss franc .

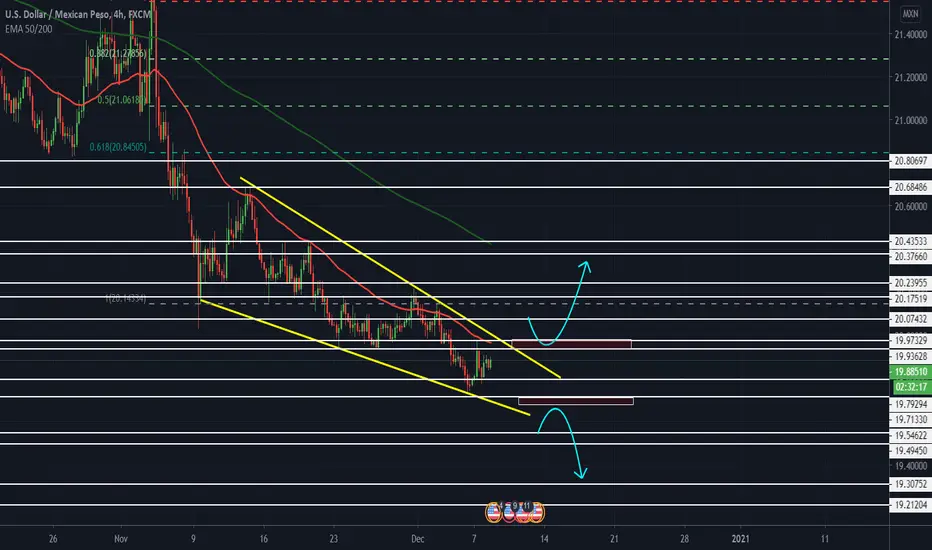
USDMXN - Peso technical analysis! Peso! It's an EM currency that I enjoy trading the most, it's the behaviour the MXN moves. It's important to seek out how currencies behaviors are.
Now let's dive into the technicals:
Pattern: Wedge
Support: 19.79294 - 19.71330
Resistance: 19.93628 - 20.07432
Long: Above 1st resistance area and close above 20.07400 areas Target areas: 20.4000 - 20.37660 (200 EMA Area)
Short: Below support areas 19.71330 and confirmed close Target: 19.54620 - 19.30700
Key tip: It's important for confirmed closes, as you could get a fake a break out as well.
Remember: Just a trade idea, not a recommendation.
All the best,
Trade Journal