USDMXN Don't miss this rideHello Fellow Traders.
Just a quick analysis. USDMXN already broken the trendline at H4.
Wait for retest. My buying zone is based on Fibonacci Retracement 38% till 50%
Please like my post and comment below. Thanks
FX:USDMXN
USDMXN


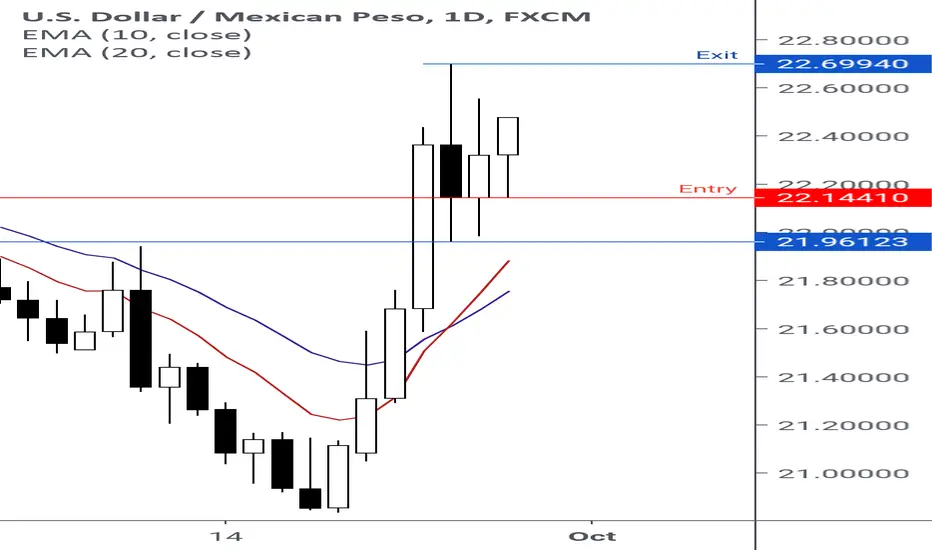
USD_MXN BREAKOUT LONG|TRADING PLAN
USD_MXN BROKE OUT OF RESISTANCE.
LONG ON PULLBACK
(1) The pair is generally in the downtrend
(2) But a support formed
(3) Together with breakout, its a long
(4) A retracement of a strong downward movement on higher timeframe
___________________________________________
LIKE and SUBSCRIBE for QUALITY

USDMXN 2 Possible MovementHello Fellow Traders
Yesterday we had seen that the price break our invalidation level and continue to lower box zone.
For price to go bullish, we need price to breakout the upper invalidation level
FX:USDMXN

USDMXN Potential Buying ZoneHello Fellow Traders
USDMXN has reached 61.8% Fibonacci Retirement for Timeframe H4. I forecast that the price will make a sideway.
For the price to confirm uptrend, it must break the Wave 2 & Wave 4 trendline.
This will signify the last Wave 5 before going short. Maybe during US Presidential Election we can see that USD weaken.

USDMXN Potential Selling Zone For Wave 5Hi Fellow Traders
Here is an update for USDMXN. My prediction is that the price is now forming Subwave 4 for Wave C before Bullish comes in.
For safe trade, please wait the price to enter the selling zone or wait the price at buying zone for buying opportunity
Note: If You found it useful to your analysis, i'll be glad to receive some donation. Thank you

Short set ups for USD/MXNWe have a short set up for the USD/MXN as the dollars safe-haven demand is reduced as equity markets rebound higher.
The Widening of interest rate differentials since the FED pegged rates near Zero, makes the U.S dollar the perfect Funding currency to purchase the Mexican Peso that an attractive investment currency.

USDMXN Completing Wave CHi Fellow Traders,
Today USDMXN show a promising move which can completing Wave C for Higher TF. For low risk entry please wait for " Buying Zone".
If price breaking Invalidation Level, it will create a new impulsive move towards downtrend
My projection is that the USD will rally strong until US Presidential Election so I'm expecting that USDMXN will be bullish completing Wave 5 in Higher TF
FX:USDMXN

USDMXN Path and direction Hello everyone
USDMXN is in a critical point watch for breakout in both direction
watch for key notes on chart for any question feel free to ask :)

USDMXN in troubleLooking for a sharp rise in this pair. Over the 1.00 fib extension (Dark line on chart) pattern points towards the box. Should look at hedging if this pair is important for your businesses....

USDMXN on a spicy level 🦐USDMXN on the daily chart hit the monthly support (purple one) and started a strong bullish impulse.
The market hit the upper trendline which is also at the level of a weekly resistance and retraced a bit.
IF the price will manage to break and close above that level we can set a nice long order according to PLancton's strategy.
–––––
Follow the Shrimp 🦐
Here is the Plancton0618 technical analysis , please comment below if you have any question.
The ENTRY in the market will be taken only if the condition of Plancton0618 strategy will trigger.

USDMXN: Big Bullish Movement... Good Buy Opportunity!!We managed to see a crucial retest from 61.8 fib level for USDMXN. A good exotic pair to enter a BUY trade as we see it heading towards the resistance level @23.2200. As we starting seeing USD gaining strength, I believe price level could break 23.2200 resistance and head towards 1.618 fib level where we starts to see strong resistance pressure which we could potentially see a fall from there retesting 23.2200 and heading for the next resistance at close to 25.0000 price level. As of now, I will trade the BULLISH opportunity but do watch out for possible rejection at 24.0000 price level.
Kindly hit the LIKE Button if you agree with my analysis and feel free to COMMENT your idea below. As for those who are keen to get daily updates and analysis from me feel free to FOLLOW me. Cheers and Happy Trading!!

USD MXN BUY (US DOLLAR - MEXICAN PESO)Hi there. Price is forming a continuation pattern to the upside. Wait for the price to complete the pattern and watch strong price action for buy.


USD_MXN STRUCTURE LONG|
USD_MXN IS TESTING CHANNEL RESISTANCE AFTER DISREGARDING HORIZONTAL STRUCTURE
(1) Horizontal resistance disregarded. The channel lines were perfectly respected
(2) IF breakout is confirmed>>>
(if candle closes ABOVE the level)
(3) Long up to the next resistance.
(4) If not, a short looks good.
_________________________________________________________________
LIKE and SUBSCRIBE if you are BASED!

Peso is at Golden Ratio 61.8%. There is still balance of Wave 3Perhaps more downtrend for Peso. Counting for Wave 3 still not finish
FX:USDMXN

USDMXN Will RiseLooking at the volatility i believe this is going to be a spike down or up soon. i provided a few pivot points. with the red lines. if it dips. buy the dip. tell me what you think. feedback is welcome


USDMXN LONG SWINGUSDMXN beautifully touched monthly support and rejected with a daily bullish engulfing. I initiated buy on the next daily candle. Daily also shows bullish divergence on obv and we have been in an uptrend since 1999. Great long term setup looking for new highs on monthly. Lets see what happens considering everything going on in the world.
Leave a like and lmk what you guys think. This is only my third post.
Currently 3-0 right now :-)
