4 Pairs I'm Long OnFour currency pairs that I'm long on include: USD/MXN, CAD/CHF, USD/JPY, and GBP/HUF. I feel like USD/MXN is due for a reversal where it has positive retracement. CAD/CHF has more support levels to pick up. USD/JPY has long sentiment. GBP/HUF is also due for a positive retracement. The patterns for USD/MXN seem there overall. As always, please proceed at your own risk. Do your own research and due diligence. Everything I say is on an opinion based basis.
USDMXN

The sustainability of the Mexican peso’s strengthExperts have been warning about the sustainability of the Mexican peso’s strength. Although prices are widely expected to go down as the safe-haven appeal of the US dollar continues to fade due to the good news from coronavirus vaccine news. The Mexican peso is also gathering strength from the positivity in the global equity market and is harnessing strength from the renewed positivity. However, there are headwinds ahead for the Mexican peso after Mexican finance minister Arturo Herrera said that the country might need to have adjustments of changes in its fiscal plans. This is all due to the disruptions brought by the coronavirus pandemic to the economy. According to Herrera, how the Mexican economy will recover will very much depend on how the pandemic evolves and if a vaccine finally arrives in the market. Of course, a vaccine isn’t expected to be produced anytime within this month of next month, it still pressured the peso.
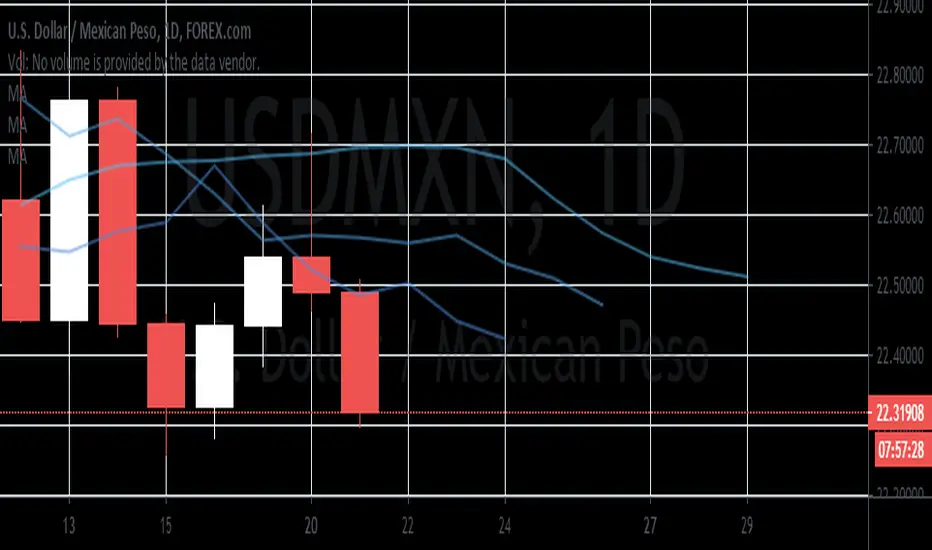
USDMXN LONG TERM FOR SWING POSITIONSUSDMXN GAVE A 61.8% RETRACEMENT ON MONDAY TO THE TOUCH OF THE TRENDLINE AT 23.22153 AND I BELIEVE NOW THE TREND WILL BE EVIDENT ONCE THE SUPPORT AT 22.27191 IS BROKEN AND CONFIRMED AS RESISTANCE ..WE WILL LOOK TO GO SHORT AT THIS POINT

USDMXN LONG SETUPusdmxn long position..as the market broke resistance at 22.46310 now the market has confirmed its bullish move wit a double bottom at 22.46310 again confirming broken resistance now turned support i believe price will be heading for area 22,69910 before we can see a reversal pattern to the down side

USD MXN possible W pattern completionUSDMXN is currently sitting on the W neckline in confluence with the 0.618 fib retracement. Looking for a buying opportunity with good probabilities. Always assess your risk and good luck to you all

Ready for the next wedge? USD/MXNRight now, I'm confident enough for an entry for the USDMXN pair for the next positive wedge correlation pattern. I think it is going to start garnishing some more support and picking up momentum very soon, and the pattern seems there. As always, everything I say is not meant to be taken seriously and is on an opinion based basis. Please pursue at your own risk and do your own due diligence.

ridethepig | USDMXN Market Commentary 2020.07.19Ok let's get started with the next round of important chart packs and fundamental updates
📍 On the fundamental side in USDMXN - as strange as it sounds all eyes are on the other side of the Atlantic. Once again politics in Europe is getting in the way, with discussions on the recovery fund coming to a close this weekend and looking like we are going to see this delayed till September with one more round of sabre rattling from the frugal four. With Covid still in play, any risks to more free money will add to a continuation of worries and anxiety. This can cap the highs in EURUSD for those tracking the flows:
We cleared the first macro target on time; although any push higher will be difficult without the official ✅ from the EC. Without that, risk is broadly exposed and the only way to defend against this in USDMXN is by sacrificing the MXN. Buyers have held the 61.8% after a hard battle; see the end of the previous chapter, from last year.
📌 Manoeuvring in these waters is difficult even for the most experienced speculators.
This position from the Technical game. The cramped sellers is glaring weakness here. And buyers should be considered as ready also. But buyer's own weakness on the soft horizontal resistance line should also be considered as a pivot also. A certain amount of restraint can be expected, although the space is there now to operate the impulsive wave. There are going to be plenty of chances for us to open up the H4 charts for those wanting to position for the micro flows, as well as those more passive traders waiting to take advantage of the momentum.
As usual thanks all for keeping the feedback coming 👍 or 👎

MEXICAN PESO STRUCTURE LONG|
USDMXN is in the downtrend and is currently trading in a small triangle.
TRADING PLAN:
Long now from the triangle support. Great risk reward and 50% probability.
I trade longs ONLY on such pairs due to the expensive interest rate spread, which in the case of being long peso, is working in your favor.
3 targets correspond with the local levels, SL below the support.
Thank you for reading, support me with the like and subscribe if you like my work.
Have a nice day!


Dollar Index in Daily Key Level, Low Risk Long OpportunityDollar index is in a KEY level. Its been extremely bearish for some time now. Theres a high posibility it could reverse to balance out the market. This could make for some low risk high reward swing trade positions going long on USD pairs.

USDMXN Sell SignalPattern: Triangle/ emerging Channel Down on 1D.
Signal: Sell as the RSI is replicating a sharp drop fractal.
Target: 21.600 (just above the Support).
** Please support this idea with your likes and comments, it is the best way to keep it relevant and support me. **
Most recent USDMXN signal:

Death Crossing - AGAINYesterday the dollar fell 0.66% normally when this happens the price increases $0.20 if the price does not stabilize it will be difficult to trade in bull mode.
With the publication of a possible vaccine and massive publicity in networks that Mexico will acquire Russian medicine for treatments, the economy and prices recovered a little.
The technical analysis shows us a cross of death. More breakage of support. Which again we can enter the prices $21.90 - $21.70 are areas of purchase.
The salvation of amlo so that the fall of the gdp does not continue to increase. and strengthen the weight.
The salvation of the weight is that donal trump gets elected again.
The worst case scenario would be that Joe Biden wins, his ideology would be a headache for Mexico.
He would also make the Mexican state pay for supporting Trump at election time.
Spanish:
El día de ayer el dolar cayo un 0.66% normalmente cuando esto sucede el precio aumenta $0.20 si el precio no se estabiliza sera difícil operar en modo toro.
Ante la publicación de una posible vacuna y publicidad masiva en redes que mexico va adquirir medicamento ruso para los tratamientos de la actual enfermedad que todo el mundo lidera.
La economía y las cotizaciones se recuperaron un poco.
Trump es la única salvación para restar el aumento del dolar ante el peso mexicano.
El peor escenario seria que Joe Biden gane, seria un dolor de cabeza para mexico su ideología.
De igual manera haría pagar al estado mexicano, por apoyar a trump en tiempos de elecciones.
El análisis técnico nos muestra una cruz de muerte. Más rompimiento de soporte, lo cual nuevamente podemos entrar en los precios $21.90 - $21.70 son zonas de compra.
Los tratados de libre-comercio son la salvación de la economia mexicana de manera exterior, de igual manera beneficia para que la caida del pib no siga en picada. Todo esto en resumen para fortalecer el peso o disminuir los riesgos económicos.

USDMXN Potentiel Buy Setup After a big bulish impulse, made a big correction, now we are waiting for a confirmation to take a buy position. Our TP is around 23.15000 with a reward risk of 8%. We will move our SL to BE around 22.45000 .

USDMXN SELL OPPORTUNITYHi traders, this is my trade idea on USDMXN according to my latest analysis on this pair.
Find the link below.
Thank you

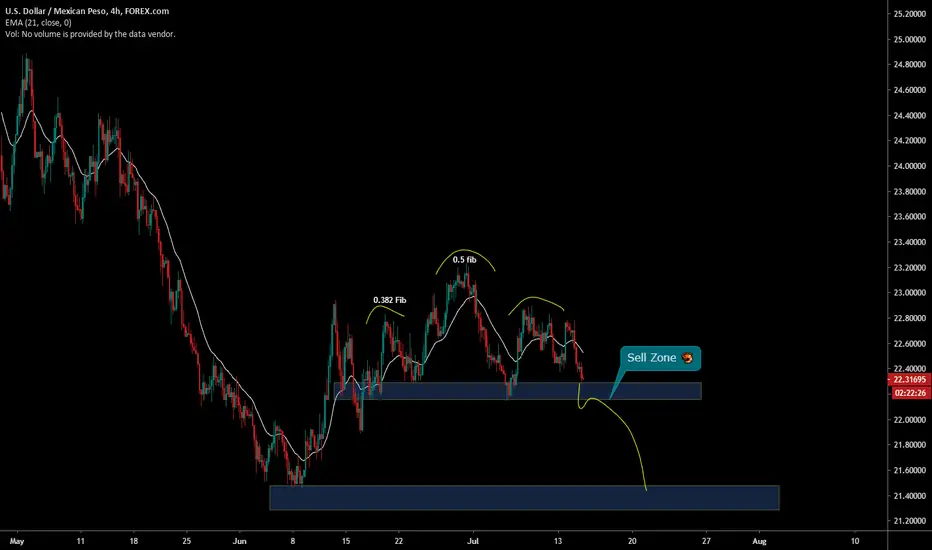
USDMXN on head and shoulder 🦐The market created and head and shoulder pattern between wthe 0.382 and the 0.5 level of the fib retracement.
If the market will break below the neckline we can set a nice short order according with our strategy.
–––––
Follow the Shrimp 🦐
Here is the Plancton0618 technical analysis, please comment below if you have any question.
The ENTRY in the market will be taken only if the condition of Plancton0618 strategy will trigger.
SELLGood morning is a quick signal to sell, close the deal on the 16th, time (GMT-6), to get our profit.
Entry Price: $22.70 - $22.60
Closing Price: (Close trading on July 16, 2020)
PD: The entry day was yesterday as you can see there is a big red candle, but I consider that it is not too late to have some benefit. It will raise the sail a bit but it will make its retreat.
Spanish:
Buen día es una señal rapida de venta, cerrar operación el día 16, horario (GMT-6), para obtener nuestro beneficio.
Precio de entrada: $22.70 - $22.60
Precio Cierre: (Cerrar operación el 16 de julio del 2020)
Posdata: El dia de entrada era el dia de ayer como pueden ver hay una gran vela roja, más considero que todavía no es tarde para tener un poco de beneficio. Subirá un poco la vela pero hará su retroceso.

testing blue line, inclined for 22.20s and lowerlately i have been posting this chart saying bounces back and forth (been working great so far) but now we have a test on blue bar (22.40s) and additional good news on markets + earnings starting today.
Potential on going to 21.8s on the week if earnings are good.
Good news= more apetite for risk = weaker dolar/ stronger mxn
usd gets weaker due to investors being more keen to risk and taking money out of the US into emerging economies

USDMXN is inside a ascending channel 🦐USDMXN is inside a ascending channel. Price bounced on 0.618 fibonacci level, and now we are waiting for a breakout.
According to Plancton's strategy, we can set a nice order
–––––
Follow the Shrimp 🦐
Here is the Plancton0618 technical analysis, please comment below if you have any question.
The ENTRY in the market will be taken only if the condition of Plancton0618 strategy will trigger.


USDMXN | WEEKLY PERSPECTIVE (FOLLOW UP PLAN)It is worthy to state that the Peso continues to ride high on the back of a weaker US dollar. Following my last publication (see link below) on this pair; we have found a complete retracement of AB leg which culminates at 61.8 with a strong tendency to make an extension within 127.2 and 141.4.
Tendency: Downtrend ( Bearish )
Structure: Harmonic (AB = CD)
Observation: i. A complete 61.8 retracement of Impulse AB leads the way to a potential Harmonic move as we eye the AB = CD pattern in the following week(s).
ii. A further Breakdown of my Key level at this juncture might confirm my Bearish view on this pair.
iii. AB = CD pattern as price rallies from a 618 retracement;
a. Impulse A-to-B is expected to be in harmony with the potential B-to-C leg.
b. The B- to-C leg is at 61.8% Fibonacci retracement of the A-to-B leg.
c. The potential C-to-D leg is expected to fall within 127.2 - 1.414% Fib. ext. of the A-to-B move.
Trading plan: SELL confirmation with a minimum potential profit of 7,000 pips.
Risk/Reward: 1:2
Potential Duration: 2 to 7 days
NB: This speculation can be considered to make decisions on lower timeframes.
Watch this space for updates as price action is been monitored.
NirvanaForex
Risk Disclaimer:
Margin trading in the foreign exchange market (including foreign exchange trading, CFDs, etc.) has a high risk and is not suitable for all investors. The content of this speculation (including all data) is organized and published by me for the sole purpose of education and assistance in making independent investment decisions. All information herein is for your reference only and I take no responsibility.
You are hereby advised to carefully consider your investment experience, financial situation, investment objective, risk tolerance level and consult your independent financial adviser as to the suitability of your situation prior to making any investment.
I do not guarantee its accuracy and is not liable for any loss or damage which may result directly or indirectly from such content or the receipt of any instruction or notification therewith.
Past performance is not necessarily indicative of future results.

Test of the M neckline and continuation to 22.20 - 21.90Hello everyone, here we have a simple setup on USDMXN where we can enter with good probabilities for a shorting opportunity. All the best and always monitor risk and exposure.

USD/MXN short setup!!!we are seeing break of structure and nice rejection on resistance level. so we shall see a roll over , nice reversal candle.
