USDMXN symmetrical trianglePrice formed a symmetrical triangle, looking for the break of the triangle to buy or sell depending on the direction on of the break.
Please support the idea and share your thoughts on USDMXN!
Good Luck and Stay Healthy!
USDMXN

USDMXN SHORTAn expectation of a continuation of a drop move based on the Weekly Volume and the Daily volume

USD MXN AlzaLa fecha indicadora de compra y venta, esta hacia el lado de "Compra" , esto le puede decir algún trader que tiene que pasar a venta y abrir operaciones Short.
Hay más publicaciones indicando Short.
En mi caso personal seré el Toro que se pelea con los osos comprando en $23.94900 y cerrando operaciones a $24.10
Fundamentos bajistas:
En méxico ya se quiere reactivar la economía.
Mes de junio y Julio tienen ser un poco más volátiles y ir a la baja.
La tasa de interés por parte del banco de México disminuyo para prestar más dinero
Fundamentos alcistas:
Vale kk el gobierno
Punto Neutro
Esperar hasta el 15 de junio para saber un poco a donde ira el precio.

GBPJPY: Summary of my losses and my $110k+ profit for this week!Sorry for the late update, I was busy today. I made 70pips on GBPJPY and for GBPUSD my stop loss was filled at -40pips. EURGBP stop loss was hit at around -40pips, for NZDUSD I lost just under 500 USD. GBPAUD SL hit at -50pips. overall today I lost just under 15 hundred dollars. however, I'm up more than 110k for the week. this is the power of FOREX if u are dedicated it keeps paying!!!
the only open position I have is USDMXN which I sold on Thursday, as of now I'm up more than 3,000pips on USDMXN. If you haven't sold this pair yet, pls don't follow me. a great SELL is coming for USDMXN in the near future! checkout my previous analysis on USDMXN to get a better understanding. have a great weekend!!!

USDMXNTriangle formation getting printed at the top of USDMXN, been following action price in this one. Daily candles had been respecting the triangle trendiness pretty good. Until a couple of day a daily candle broke outside the trend line and come back quickly inside the consolidation area.
If you see at lower timeframes you would be able to find several patterns that gives sales entries but the most important one is to see that this time price has not been able to to reach the upper trend line. Lets leave the prices to do what if do best, surprise us


usdmxnwe expect a big sell from the area showing 0n the chart, if you have feedback or questions pls comment below,
Stay Inspired!
Ali Dib
The Chart Trader


USDMXN - BEARISH SYMMETRICAL TRIANGLE For months, USDMXN has been extremely bullish, however prices started to make converging swings, forming a symmetrical triangle. Prices broke out with a lower low and restested structure with a lower high which lined up with the 50% fib level where we often look for entries. My stop loss is above the wick and target is at the 161.80& Fib extension.

USDMZN - new trade! Last one hit +3%, lets see!Very simply strategy, the chart speaks for itself.
For more information on our strategy please view our 'Scripts' page on our Trading view profile.
Our V2 strategy shows the SL and multiple TPs on the chart too.
Works on all instruments
Directly onto your own personal trading view - all devices work
Non repainting
Regards
Darren
Blue FX


USDMXN: 25,000+pips Potential SELL???"Mexican President Andres Manuel Lopez Obrador said on Friday he aims to present plans next week to reopen the economy, as key sectors like carmaking look to begin business again after over a month of quarantine measures to curb the coronavirus outbreak"@Reuters. Mexico is planning to announce the plan on Wednesday or Thursday. I managed to capture more than 50,000pips in March alone with more than 1000% profit! If the announcement on Wed/Thurs suggests the economy will reopen soon, then this will be a great SELL opportunity as MXN will get some strength. USDMXN could potentially see '21.0000' price point! that's more than 25,000pips SELL potential! I will be waiting for the announcement and place my trade accordingly!!

USDMXN Triangle break Short positionUSDMXN Triangle formation over the past April with undefined direction.
Triangle formation break this week, the chart made allready a test to the 23.800 level, now resistance.
We will see probably a drop to the 22.800 (fib 0.382).
TP1 - 22.800 (fib 0.382)
TP2 - 22.000 (fib 0.500)
TP3 - 21.150 (fib 0.618)
Small SL and big TP
Trade safe, cheers

El peso mexicano buscando regresar a la parte baja We place two blue lines on the 4-hour chart starting at the highest high and lowest low, tracking the price congestion in the Mexican peso with lower highs and higher lows. The upward attempts at the Mexican peso moved further and further away from the upper line, while the lower ones struggled with the lower line until beating it on the third attempt at the end of the week with a greater appetite for risk and the increasing possibilities of negative rates in dollars to revive the economy.
Now we must see in the daily analysis the Bollinger bands with 24.97 as the upper part and 23.35 as the lower range, with the average at 24.15. The 23.30 zone already worked as a support from April 9 to 14, so the probabilities of retesting it are higher now that the peso shows a downward trend, and in case of extension it could look for the previous low of 22.85. A return above the uptrend trend line around 23.90 could defuse the downside and seek 24.15 as a midpoint.
With these signals we would seek to enter long if the price maintains 23.35 and shows regression, with stop loss at the previous maximum of 22.85 looking for a first objective of 24.50 where the previous rise was limited, and a secondary objective at 24.95 depending on the factors that cause the momentum, adjusting the stop according to the ATR as it approaches the first objectives.
This is due to the fact that at the moment the probabilities of seeking recovery below 22.85 are very low due to the internal factors of Mexico given its low fiscal margin and its own affectation due to the pandemic. Remembering that the prices above 25.00 already discounted the worst, and at the time that expectations are becoming realities, decision-making becomes more informed and the attractiveness of the yields in Mexican currencies with the proper coverage increases the demand for the peso, so the objectives have to be moderate and stop thinking for the moment in the 27.00 goal.
-------
Trazamos dos líneas azules en la gráfica de 4 horas con inicio en el máximo mayor y el menor mínimo., tratando de ver una compresión de fuerza en el peso mexicano con máximos cada vez menores y mínimos cada vez mayores. Los intentos al alza del peso mexicano se alejaban cada vez más de la línea superior, mientras que las bajas lucharon con la línea inferior hasta vencerla al tercer intento al cierre de la semana con un mayor apetito al riesgo y las posibilidades cada vez mayores de tasas cero o negativas en dólares para reactivar la economía.
Ahora tenemos que ver en el análisis diario las bandas Bollinger nos dan el 24.97 como parte superior y el 23.35 como rango inferior, con la media en 24.15. La zona de los 23.30 ya funcionó como soporte del 9 al 14 de abril, por lo que las probabilidades de volver a probarla son mayores ahora que el peso muestra tendencia de baja, y en caso de extensión pudiera buscar el mínimo previo del 22.85. Un regreso por arriba de la línea de tendencia de alza alrededor del 23.90 pudiera desactivar la baja e ir a buscar el 24.15 como punto medio.
Con estas señales buscaríamos entrar largos si el precio mantiene el 23.35 y muestra regresión, con stop loss en el máximo previo de 22.85 buscando un primer objetivo del 24.50 en donde se limitó el alza previa, y un objetivo secundario en el 24.95 dependiendo los factores que provoquen el impulso, ajustando el stop segun los ATR confome vaya acercando a los primeros objetivos.
Esto debido a que por el momento las probabilidades de buscar recuperación por debajo del 22.85 son muy pocas debido a los factores internos de México dado su poco margen fiscal y afectacion propia por la pandemia. Recordando que las cotizaciones arriba del 25.00 ya descontaban lo peor, y al momento de que las expectativas van convirtiéndose en realidades, la toma de decisiones se vuelve mas informada y el atractivo de los rendimientos en monedas mexicanas con las debidas coberturas incrementa la demanda del peso, por lo que los objetivos tienen que ser moderados y dejar de pensar por lo pronto en los 27.00

Next week for the USDMXN H4We continue to notice higher lows and lower highs, the medium-term trend is still on the upside fundamentally, but a break of the lower blue lines may lead to 22.80.
I think it may correct to one of the bottom two blue lines again next week and I see a good long opportunity when the blue lines coincide with the .236 regression formed from 25.28 to 23.63 downtrend which is 24.02, there it is to take longs and wait to break the top blue line above 25.00 with Stop just below the previous low at 23.60.
Long at 24.00 / 24.05, Stop 23.60, TP1 25.50, TP2 26.65
Adjust Stop to cost if 24.26 is sustained, sell half at 25.50 and let the rest run to 26.65 with a stop at 25.00, take profit at 24.60 if it fails to break the second blue line around 24.80 and wait for the next opportunity.
The MA200 is crossing the Bolinger mid-line at 24.15, where we could look for a first entry in longs if the price shows no strength to look for 24.00
Like if you agree, and comment if you think we should go long in another level like 24.25/24.50 or we short at the opening price.
Escenario para la próxima semana.
Seguimos notando mínimos cada vez mayores y máximos menores, la tendencia a mediano plazo sigue siendo al alza, pero una ruptura de las líneas inferiores azules nos puede llevar a buscar el 22.80.
A mi gusto puede corregir de nuevo a una de las dos líneas azules inferiores la próxima semana cuando estas coincidan con el .236 de regresión que formó la baja de 25.28 a 23.63 y que marca el 24.02, ahí es para tomar largos y esperar para romper la línea superior azul arriba del 25.00 con Stop justo debajo del mínimo previo en 23.60.
Largo en 24.00 / 24.05, Stop 23.60, TP1 25.50, TP2 26.65
Ajustar Stop al costo si se sostiene el 24.26, vender mitad al 25.50 y dejar correr el resto a 26.65 con stop al 25.00, toma de utilidades al 24.60 si falla en romper la segunda línea azul alrededor del 24.80 y esperar para posicionarse de nuevo.
El MA200 está cruzando con la línea media de Bolinger en 24.15, en donde pudiéramos buscar una primera entrada en largos si el precio no muestra fuerza para buscar el 24.00

USD/MXN UpdatePrice could rise approx 200 pips from this point. Stop would be in the red zone. Trade safe

USD/MXN Potential BuyI see a potential set up to go long (600-800pips) since it has strongly rejected the trendline/support. I am currently in a buy with a tight stop at 23.78. Trade safely.

USD/MXN MULTI-TIMEFRAME ANALYSIS Hello Traders, here is the full analysis for this pair, let me know in the comment section below if you have any questions, the entry will be taken only if all rules of the strategies will be satisfied. I suggest you keep this pair on your watchlist and see if the rules of your strategy are satisfied.

USDMXN could hit 26.70-27.50 after correctionThe wave Y reached equal distance of wave W. It could dip lower to 22.80 (valley of wave W).
The trend then will resume to the upside.
It could hit between 26.70 and 27.50.
I see oil lower and oil related currencies could drop.

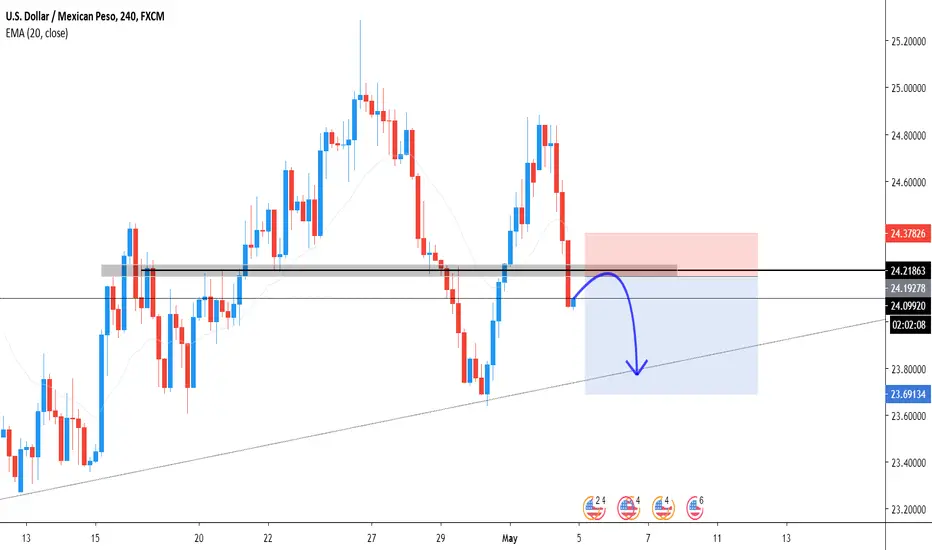
USDMXNprice has break support, i am waiting for a retest and a candelstick ex.(pinbar) to enter sell
comment below your idea.
USDMXN - SMAs 50 100 200 4H - ShortPLEASE: Help me understand charts, I'm learning still, here's my first idea published, let me know what you think!
My entry overlaps the resistance, I was lucky to get filled at $24.8870, $24.88630, $24.88610
Second TP is on the meeting point of the 100 and 200 SMA, which I guess must mean it's important lol

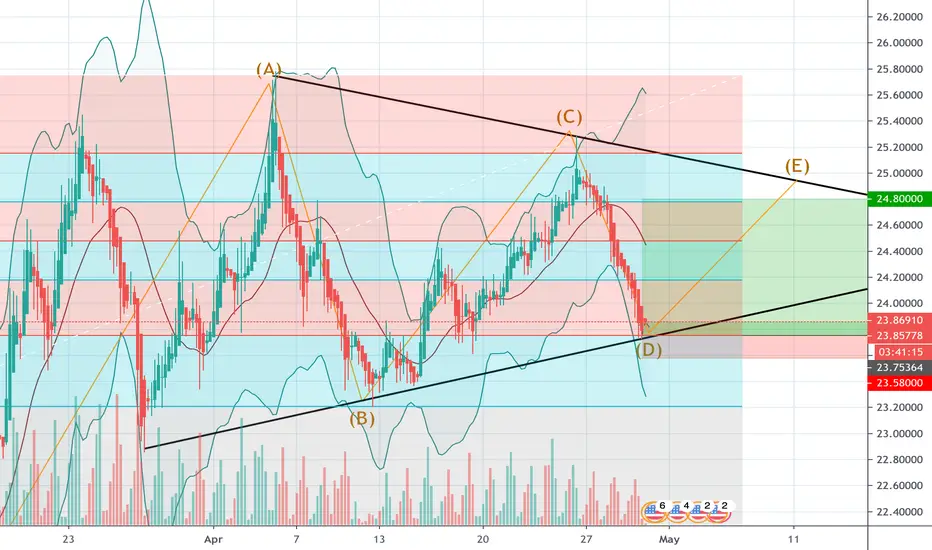
USDMXN ShortTook a short and forgot to post USD/MXN looks like its in a fib triangle .... nut. Longing on the D wave in anticipation for the E wave. TP at my 38.2 level get in now or lower. I got in much lower. Stop on screen as well. Lets keep 2020 green have not taken a loss yet! Watch me jinx myself now lol enjoy