USD/MXN Possible ShortUSD/MXN Multiple Time Frame Technical Analysis:
Forecast Scenario:
1- If the Price Completed the Retest of the 25.40 (- Resistance Level -) and broke below.
2- If the Price broke below from the current point 25.20 (- Major Support Level -) with a retest.
-- The Price is supposed to hit the Target Level 1 within the range of 24.50 -- (-- Normal Risk --)
-- The Price is supposed to hit the Target Level 2 within the range of 24.00 -- (-- Normal Risk --)
Important Observation:
The USD is on the rise in most of the Commodity Pairs which may result in a possible stall at the high level of 24.50 and even a failure of confirmation.
Trade Wisely
Note:
- These Forecasts are Observational Forecasts, and should not be used in applying any trading strategies.
- No Hedge Funds Analysis were included in the analysis. (-- Please Consider --)
USDMXN


USD/MXN Short OpportunityFor demonstration and educational purposes. Study price action for rejection on at least the H4 at zones noted.

USDMXN ShortIf the price break for the down side we have a good sell oportunity affter retest the resistance

USDMXN 1D TRIANGLE BREAKOUTTriangles are repeatable trading chart patterns.
Triangles are consolidation chart patterns that can breakout either direction.
Each chart pattern will have defining trendlines of the support/resistance levels creating the pattern.
What ever time frame you are trading this chart pattern, wait for a candle close outside of the trendline in the direction of the breakout candle. (Our time frame preference is the Daily chart).
Add volume indicator - Volume is the amount of $ that went into a particular candle or in Forex the # of trades that took place.
Add ATR indicator - Volatility is the amount of price movement that occurred. Use the ATR to measure the price movement.
When you see descending Volume bars and descending ATR line (which indicates volatility) this shows
a dis-interest in traders to invest in this pair creating consolidation which creates the chart pattern.
Trade Management after there is a breakout candle close.
1 - Position size (compare volume bar to volume ma line).
a - Breakout candle must be 100% of average volume for a full position size.
b - If 75% of average volume then ½ position size. (To find 75% of Volume
look at the charts volume settings – divide smaller # into larger # = 75%+)
2 - Enter two trades.
3 - SL for both trades will be 1.5 x ATR.
4 - 1st trade TP will be 1 x ATR.
5 - No TP on 2nd trade – letting profit run and adjusting SL to follow price.
6 - When 1st TP hit – move 2nd trade SL to breakeven.
7 - Adjust the 2nd trade SL to follow price.
*8 – After Breakout candle – if price closes back into chart pattern close trade
*9 - When breakout candle is more than 1 ATR from breakout candle open.
a - Enter 1st trade at candle close with ½ position size.
b - Enter 2nd trade with a pending limit order that is 1 ATR of breakout candle open.
c – Price should pullback to that pending limit order for 2nd trade.
d – If Price returns back into chart pattern close trade before SL is hit.

USDMXN : Things to KnowPredicting an actual target after a move like that is almost impossible.
This pattern is highly likely to produce a continuation of the price action leading up into it; it’s a classic triangle.
This fact we have just examined, in a normal situation would be enough to say easily, well now is another time to long, on a breakout play.
The triangle appears most valid on the daily; as although the wick violates the triangle, the reaction is quite violent;
The triangle at this point is in the final stages of completion. A breakout or breakdown is to be expected before April is over.
The strength behind the US Dollar is largely panic driven and therefore extremely prone to a hard fall
All markets clearly aware some type of tomfoolery is going on; at some level.
Caution is to be taken with MXN. It ranges hard on the daily. Good luck.


LONG USDMXN ! GET SOME BURRITOSUSD / MXN looks good to accumulate longs
Target new highs
SL below 23


USDMXNUSDMXN consolidating nicely and I think it breaks higher from here. Plays along with my DXY chart

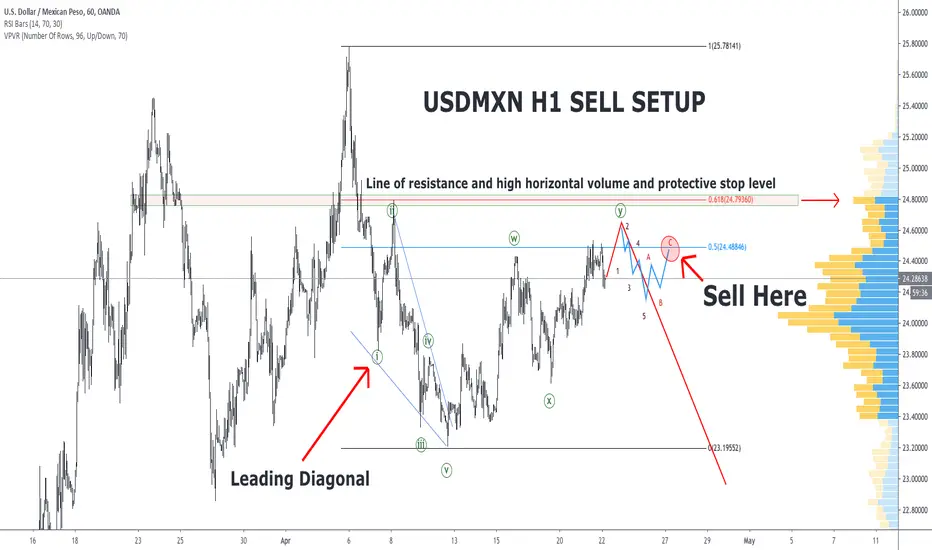
USDMXN | SHORT | UPDATINGA setup for sale is coming soon. May be :-)))) Updating last USDMXN | SHORT | TRADING IDEA
Elliott Basic Wave Patterns


Long USD/MXTechnical:
USD/MXN broke out of a massive symmetrical triangle today and is retesting the top for confirmation....The Ichi cloud is providing support (not shown here in order to not make the chart too busy....run it yourself and see).
Fundamental:
With the debacle in oil prices today (WTI may futures contracts traded for negative $37, yes, negative, adn June contracts slid $4 to $20 a barrel) USD/MXN is set to soar! We are in price discovery mode right now with very little resistance overhead and no price history above $25.78. This has the potential for huge returns

FX in pivot pointIt looks like the MXN will define the direction until next week, short looks to be the best bet.
23.70 may tiger sells, 24.02 may tiger buys.


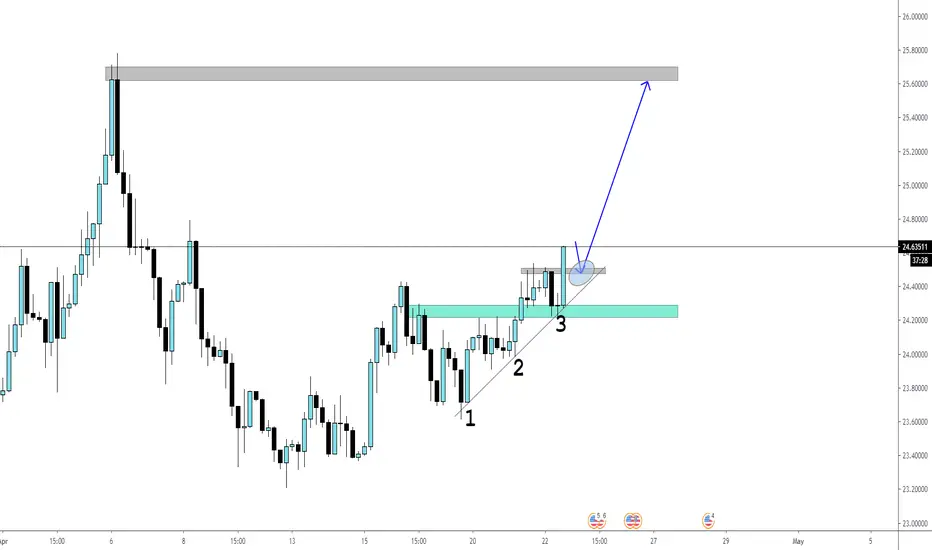
USDMXN - SHORTAfter higher time frame completion of bullish flag pattern and a strong push to the upside we are witnessing a bearish flag pattern entry taken on third touch.

