USDMXN

Global USD valueStrength of USD versus currencies of EU, Japan, China, India, Russia, Mexico, Brasil, Saudi Arabia, Turkey, South Korea.
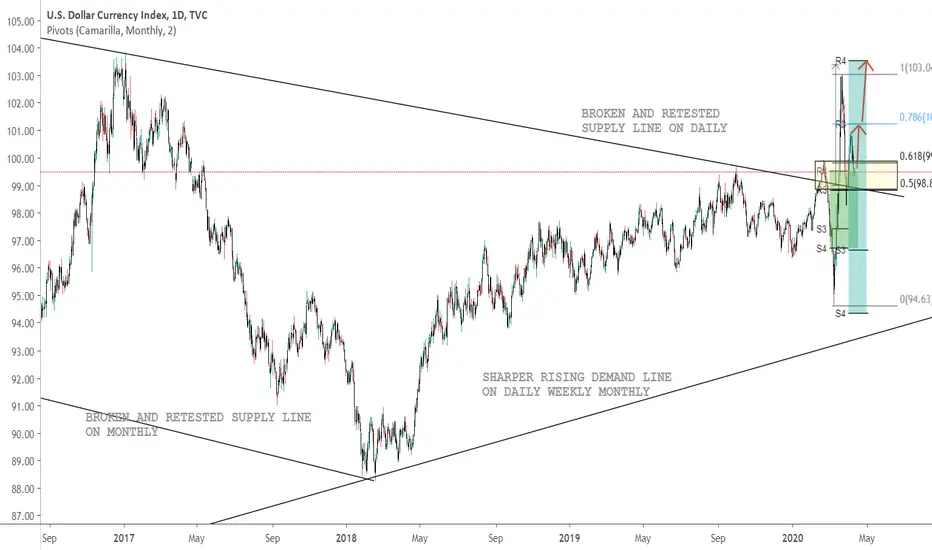
There had been a cosmic demand for dollar but as COVID hit USA from April 6 we saw a breakdown.
Now we are at major support, on the monthly balance point, from which a push up is likely but not guaranteed.
The area between CAMS1 and CAMR1 is regarded as neutral market.
A break above those levels will establish a bear or bull market.
Demark trendline needs to connect 2 corresponding TD N points. While here we see disproportion (bottom TD point is only N1) so I dont give much credence to that trendline.
If both USD and EUR will keep falling we will see a range on EURUSD.
The question is which one will fall faster. But now we see a pivot stop on USD fall but EUR is likely to keep falling on Monday as it is below April value zone.
Global EURO value index (see my previous post) started to exhibit great daily instability since early March (each days candle has long wigs either way).
I excluded CAD as its economy is much intercorporated with the US one and GBP, CHF being a EURO clones. But still inclusion of those doesnt change the picture much.


Post-breakout pullback into FIB zoneI have been taking a look into dollar index and a strong push up is very likely next 2 weeks,
considering all the conditions of what happened:
1. Breakout of descending daily supply trendline (breakout candle - strong bullish, second post breakout candle strong bullish)
2. Trendline breakout retested (important factor: price stayed above the trendline after the retest - uptrending confirmed)
3. Classic pullback into Fib zone (50-61) and retest of last month roof R4 (March breakout level).
4. Demark breakout slingshot projection gives target near April R4 confirming the breakout and April camarilla levels. Also, April resistance CAMR3 coincides with 78 fib level.
In the Fib zone we do have untested missed monthly pivot - the question is if price is gonna test it? But then again - missed pivots mark the starts of strong trends.
At any case, push back under the trendline does not make much sense.


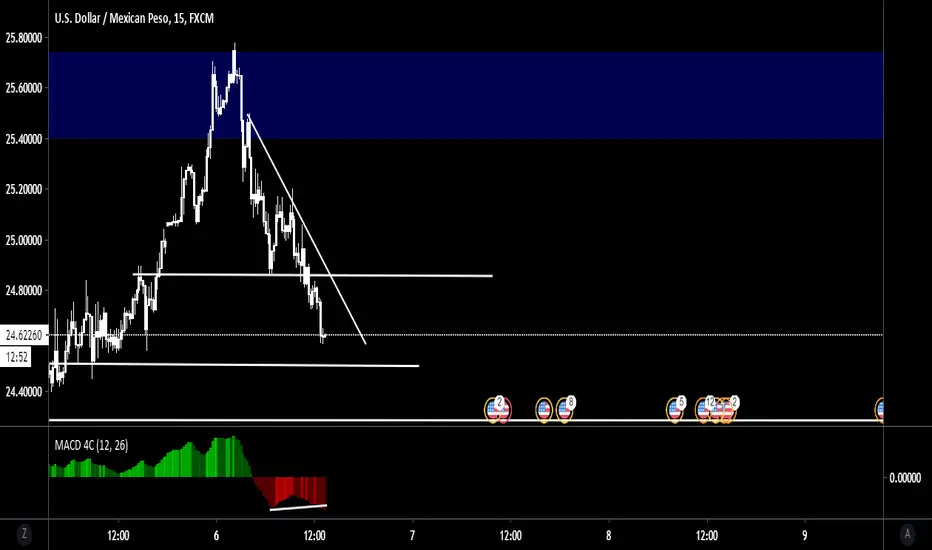
USDMXN EDITEDTAL VEZ ESTABA VIENDO EL CANAL CON OTROS OJOS, ESPERAMOS QUE LA VELA DIARIA TERMINE Y SI SE MANTIENE EN EL CANAL POSIBLEMENTE PODREMOS BUSCAR ACCION DE PRECIO Y ENTRAR EN LONG HASTA LA PARTE SUPERIOR DEL CANAL .
LA ECONOMIA DE USA ES DEBIL SI, PERO LA DE MEXICO ES AUN MAS DEBIL, Y EL USD SIGUE SIENDO "LA CAMISA MAS LIMPIA DEL CANASTO" COMO ALGUNOS DICEN, DENTRO DE TODO ES UNA ECONOMIA FUERTE Y HA BAJADO SUS TASAS AUN MAS PARA SOPORTAR LA CRISIS.

USD/MXN POSSIBLE HEAD AND SHOULDER SHORT ??USD/MXN POSSIBLE HEAD AND SHOULDER CONTINUATION DOWN TREND ???


USDMXN LongUSDMXN simple flag pattern.. Rejected the bottom of the flag.
Will update as the trade plays out

USDMXN Pattern like the 2008 crisis. Opportunity for +15% profitThe pair made a strong Parabolic Rise in March pushing the 1D chart to its limits. Now technicals have found a normal balance (RSI = 58.931, MACD = 0.972, ADX = 49.001) as the price is trading on a range. This is similar to the 2008 trading pattern of the Mortgage Crisis, when after a Parabolic Rise, USDMXN entered a range (was an Ascending Triangle then) before a new Top.
So far it appears the the COVID pandemic is repeating the same psychological patterns of the 2008 Mortgage Crisis. QE and stock market fear are the key factors. If USDMXN repeats the whole sequence then we can expect the next Top to be roughly +9% from the current one which makes for a $28.00 target. That is roughly a +15% profit opportunity from the current levels.
** If you like our free content follow our profile (www.tradingview.com) to get more daily ideas. **
Comments and likes are greatly appreciated.


USDMXN would trend continue or new low price would be printedThey say the trend is your friend, until it betrays you


Tradtional market analysis 1 (Metals + Forex)Gold, Silver, USDMXN, USDZAR, USDTRY, EURUSD
Talking about Central bank action, state of economies, the USD shortage and all the technical around it

Peso Mexicano directo a los $30 USDMX El peso Mexicano parece estar formando un limpio ABC alcista que se activara superando el 38,2%($25,5) y de ahi directo a los $30 que sera una resistencia dura de romper.

USDMXN-- Weekly Market Outlook from 06 to 10 April 2020Follow me for more update and Analysis.
What You Get:
- Weekly Market Analysis using my strategy.
- Results of our tried, tested and proven Strategies
- Latest and greatest news and content from the Forex World
Never Trade alone
we really hope you enjoy the All analysis
thank you


USDMXN ShortLooking at Weekly time frame we can see that we have three wicks that have formed indicating a strong resistance level. the price has been going up for a while now and by switching to the 4H TF we can see that it have failed to form a Higher high. adding to that the priceline will be reaching 24.6000 resistance level and that's where I will place my short. trade at your own risk and happy trading.
