USDMXN Long Trade IdeaUSDMXN is looking to be a good buy opportunity. As we can see it is currently respecting my curve line and is showing sign of an uptrend. My buy positions are now open with a tight stop loss (as shown by the dark red trend-line). This is a swing trade.
Always remember to use proper risk management.
Enjoy!
Usdmxnlong

USD/MXN Refer to Previous Idea LinkedThis idea is for demonstration and educational purposes and does not constitute a signal, but it is a study, as we study market structure and price action.
From this view over the past month, since mid-October 2019 and as we study USD/MXN we see evidence of reversal of trend forming in the market. If you refer to the post I shared a week or two ago (see USD/MXN idea linked below), you will see the progress of how we have come in terms of price action. Keep in mind that the market does not move in a straight line. An idea for today may not play out until days or weeks later. The market still will do what it does in terms of forming market structure, afterwhich we can look for longer term trades. The trade ideas often take time to play out. It's best that we watch and study and enter at optimal positions where we can take advantage of high volatility.
Now for today, What we saw today in terms of price action was a sharp impulse, towards the target I noted in the previous set up (see linked idea below). We know that the bulls are definitely present. Afterwards today we saw a sharp rejection, which could very well be a re-test to the previous price area, which is very common that after the impulse, we see a correction, and then a continuation, which confirms the new trend. After the re-test now we watch for continuation. Just like the USDZAR idea I shared yesterday (refer to USD/ZAR idea below) this could be very similar price action..Could be but not necessarily. It all depends on what actually happens. We could be getting what may be the same price action and then followed by a bullish run. As we look from zone to zone, I would hope to see price reach the first and second key zones as noted, which would make for a nice swing trade idea of almost 400 pips. Of course this idea does not mean pull the trigger. Study your confluences and wait for confirmation that bullish price action will continue before considering a buy. Remember, this does not have to play out, but it is simply an idea.. If you enter this trade at any time, you do so at your own risk. Always use proper risk management.
I will also note that USD/ZAR and USD/MXN are not related in any way or correlated. It just so happens that for demonstration purposes I am comparing these two based on similar price action in the recent past. They are both emerging market currencies however.
Please like and offer your feedback and feel free to follow me on Instagram and Facebook!

USDMXN Wave/Pattern AnalysisHello Traders,
USDMXN has been trading nicely with patterns
In the recent weeks it has been pulling but towards the Higher Low Support zone and technically is now on the optimal long term buy level. A 2 year long RSI figure also suggests a buy near 40.000. We are taking this opportunity to go long with TP = 19.48600.
Comments and likes are greatly appreciated.
Good luck traders and trade safe!

USDMXN is bullish!!!I see some bull divergences.
Profit Targets:
19.22
19.34
19.44
19.54
19.68
Stoploss: 19.02


USDMXN WEEKLY ANALISYSAnother simple set up where price just went for a retest to that ascending TL that is part of that big monthly wedge and if we go into the lower tiemframes we can see how price is creating HH and broke previous bearish structure
Full signal on my Telegram channel

USDMXN: Swing Long Whats up traders? How is your trading week going?
Im currently looking at the USDMXN pair for long opportunities. Our stop loss is under the last swing low and take profit is very high for because im looking for a longterm trade.
If something does change or i take profit earlier - i will keep you guys updated here.
Wishing everyone success and a great weekend!

USD/MXN : Bear Flag For Sell BUY & SELL As Per Above Given Chart or
You Can Also set Own Risk reward.
Let see what Will be Next Move.
Warning- I m Not a Financial Advisor this idea Only For Educational Purpose Only.
Thank You !

Analysis of USDMXN 10.10.2019The price is below the moving average of 20 MA and MA 200, indicating the downward trend.
MACD is below the zero level.
The oscillator Force Index is below the zero levels.
If the level of support is broken, you shall follow the recommendations below:
• Timeframe: H4
• Recommendation: Short Position
• Entry Level: Short Position 19.4900
• Take Profit Level: 19.3600 (1300 pips)
If the price rebound from support level, you shall follow the recommendations below:
• Timeframe: H4
• Recommendation: Long Position
• Entry Level: Long Position 19.6400
• Take Profit Level: 19.7000 (600 pips)
USDCHF
A possible short position in the breakdown of the level 0.9910
USDJPY
A possible short position in the breakdown of the level 107.30
EURUSD
A possible long position at the breakout of the level 1.1020
GBPUSD
A possible short position in the breakdown of the level 1.2190

USDMXN Fundamental Analysis – October 9th 2019Here are the key factors to keep in mind today for US Dollar trades:
US JOLTS Job Openings: US JOLTS Job Openings for August a predicted at 7.191M. Forex traders can compare this to US JOLTS Job Openings for September which were reported at 7.217M.
US Wholesale Inventories and Trade Sales: US Final Wholesale Inventories for August are predicted to increase by 0.4% monthly. Forex traders can compare this to previous US Wholesale Inventories for August which increased by 0.4% monthly. US Wholesale Trade Sales for August are predicted to increase by 0.2% monthly. Forex traders can compare this to US Wholesale Trade Sales for July which increased by 0.3% monthly.
FOMC Minutes: The US Federal Reserve will release minutes from its last meeting today and forex traders will look for any potential change in the wording used which could give insight to future monetary policy adjustments.
Here is the key factor to keep in mind today for Mexican Peso trades:
Mexican CPI: The Mexican CPI for September is predicted to increase by 0.25% monthly and by 2.99% annualized. Forex traders can compare this to the Mexican CPI for August which was reported flat at 0.00% monthly and which increased by 3.16% annualized. The Mexican Core CPI for September is predicted to increase by 0.29% monthly. Forex traders can compare this to the Mexican Core CPI for August which increased by 0.20% monthly. The Mexican Bi-Weekly CPI for the week ending September 30th is predicted to increase by 0.10% monthly and by 2.98% annualized. Forex traders can compare this to the Mexican Bi-Weekly CPI for the week ending September 16th which increased by 0.17% monthly and by 2.99% annualized. The Mexican Bi-Weekly Core CPI for the week ending September 30th is predicted to increase by 0.09% monthly. Forex traders can compare this to the Mexican Bi-Weekly Core CPI for the week ending September 16th which increased by 0.19% monthly.
Should price action for the USDMXN remain inside the or breakdown below the 19.5050 to 19.6530 zone the following trade set-up is recommended:
Timeframe: D1
Recommendation: Short Position
Entry Level: Short Position @ 19.6050
Take Profit Zone: 19.1900 – 19.3185
Stop Loss Level: 19.7425
Should price action for the USDMXN breakout above 19.6530 the following trade set-up is recommended:
Timeframe: D1
Recommendation: Long Position
Entry Level: Long Position @ 19.7425
Take Profit Zone: 19.9890 – 20.2545
Stop Loss Level: 19.6530
Open your PaxForex Trading Account now and add this currency pair to your forex portfolio. There are many different forex trading strategies available, but did you know that with all of them you will earn more pips per trade at PaxForex? Sign-up now and find out for yourself!


USD/MXN Buy OpportunityRecent reversal in trend offers buy opportunity. We had impulsive movement today. Watching for correction/pullback to trendline before continuation up. Pullback area is key zone; also expect price to graze moving averages as dynamic support. Study price action around this area for impulsive move to the upside along with other confluences. Trade at your own risk. This is for demonstration and educational purposes.

USDMXN First Idea, AMLO era If the retracement ends (fibs) see how a previous high, and ABCD pattern matches. Market sentiment is currently bullish on this pair. Cheers!

USDMXN forming bullish CRAB | A good long opportunity aheadPriceline of US Dollar / Mexican Peso Forex pair is forming a bullish CRAB pattern and soon it will be entered in potential reversal zone insha Allah.
Volume profile of complete pattern is showing less interest of traders here
RSI is oversold
But MACD is strong bearish and Stochastic is oversold but did not give any bull cross sofar, so I would suggest when the price action will be entered in PRZ area then wait for MACD to turn weak bearish or for stochastic bull cross then buy.
I have used Fibonacci sequence to set the targets:
Buy between: 19.47392 to 19.25942
Sell between: 19.64064 to 20.04382
Regards,
Atif Akbar (moon333)

USDMXN - Patience -Details on the chartOANDA:USDMXN ----------->Details on the chart.
Pipdify,
Tamilkumar


USD/MXN For Long PossibilityThis idea is for educational and demonstration purposes and does not constitute a signal.
Does history repeat itself? You will see that I modeled previous price action as noted to current price action. Underlying fundamentals at play, to keep in mind are the weakening of the Mexico economy. Market structure mimics broadening wedge. Note also 9 and 50 EMAs which have crossed to the upside to indicate we are not quite over with the buy. Fib levels point to previous highs in the market. Trade at your own risk.

USDMXN - SELL OANDA:USDMXN ------> Details on the chart,Happy pip hunting.
(Price action)
Pipdify,
Tamilkumar

USDZAR - Are you ready!!!!!!!OANDA:USDZAR Are you ready for this ride...
Details on the chart,
Happy weekend,
Pipdify,
Tamilkumar

USDMXN - Simple trade - SELL - Strong resistanceOANDA:USDMXN - Sell ||Details on the chart||
||Pipdify||
Tamilkumar

USDMXN -Wait for ascending triangle to break and enter the tradeOANDA:USDMXN -----> Details on the chart.
Pipdify
Tamilkumar

USDMXN [W1] Long AnticipationUSD OANDA:USDMXN
USDMXN Long bias du to hitting a zone of demand. NFP might boost it as well.
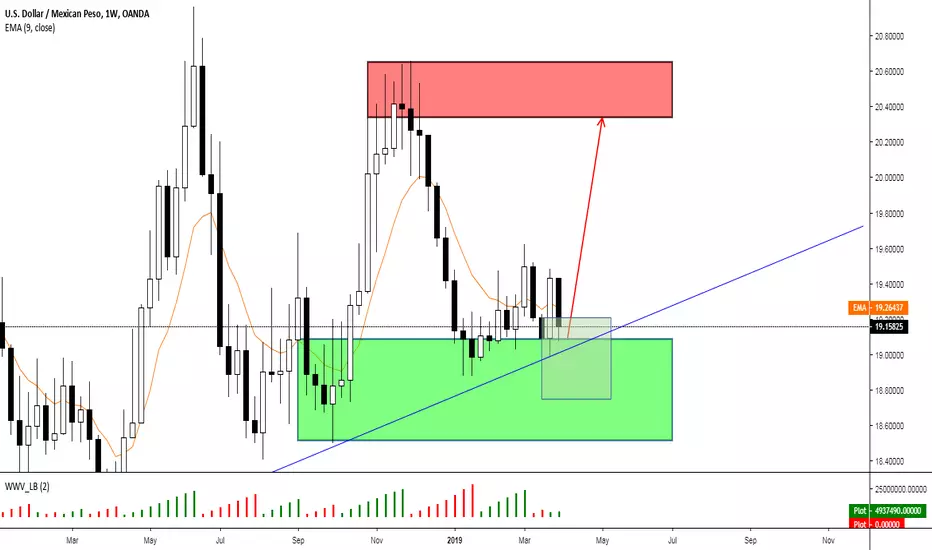
USD/MXN Long IdeaThis is not a signal. Use your confluences. Trade at your own risk. Use proper risk management. Recent bullish momentum leads me to believe that we COULD see price reach previous high, out of consolidation zone.
