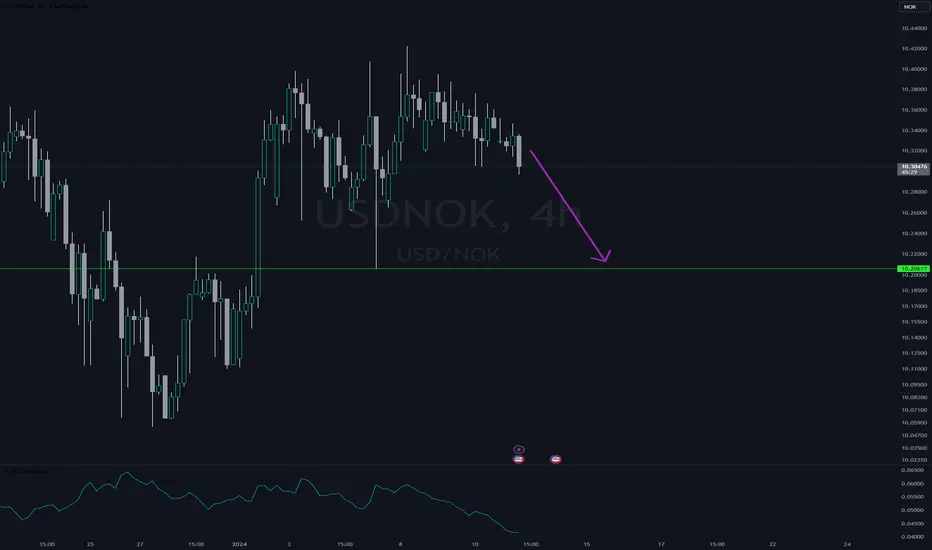
USDNOK short potential setupUSDNOK recently broke down below the monthly 50ema (overlayed on this 4h chart) and has rejected off the daily 20ema (overlayed) twice this week. RSI is showing bearish momentum after a brief overbought period while the PA has remained in a strong downtrend. Short setup potential is evident but not certain.
I'm a cat not a financial advisor.
USDNOK

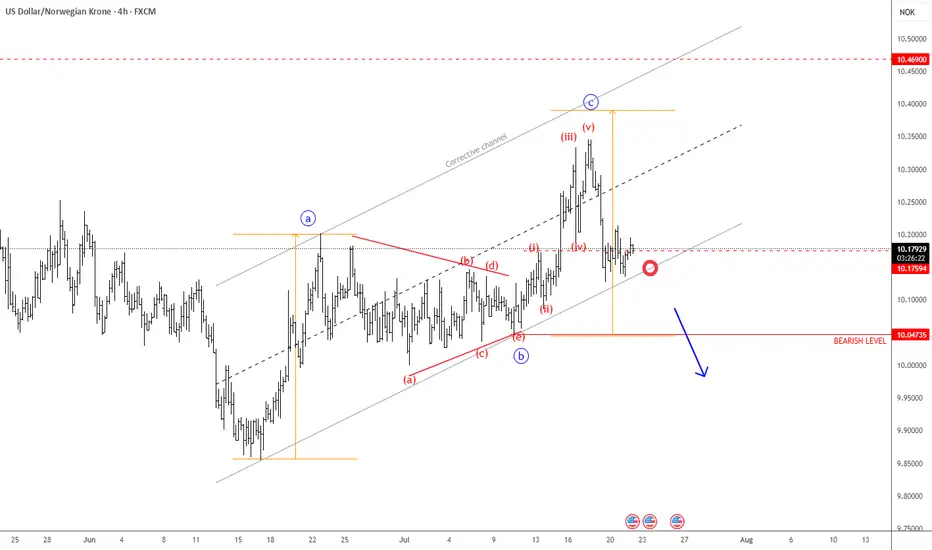
USDNOK Remains BearishUSDNOK made a three-wave rise from the recent low, indicating an abc correction within a downtrend—especially considering the triangle in wave "b" in the middle, and the current sharp decline following a completed five-wave impulse in wave "c". As long as this structure remains intact, there is still a risk of another leg lower. Therefore, we can expect further weakness toward the June lows, especially if it breaks below the channel support line. Just watch out for short-term intraday pullbacks.
USDNOKOn the monthly charts we have a confirmed bearish trend with a bullish correction in play.
On the weekly charts we have a shift in order flow confirming our bearish bias though its a long term view. We have an impulsive bearish move that has necessitated a bullish correction to clear previous disequilibrium.
The break in daily structure confirms shift in order flow from bullish to bearish. Presently we are bearish, in consonance with our monthly and weekly view.

USDNOK - US Dollar / Norwegian Krone (Daily chart, OANDA)USDNOK - United States Dollar / Norwegian Krone (Daily chart, OANDA) - Short Position; Short-term research idea.
Risk assessment: Medium {support structure integrity risk}
Risk/Reward ratio ~ 2
Current Market Price (CMP) ~ 10.31500
Entry limit ~ 10.30000 on May 06, 2025
Target limit ~ 10.50000 (+1.94%)
Stop order limit ~ 10.18000 (-1.17%)
Disclaimer: Investments in securities markets are subject to market risks. All information presented in this group is strictly for reference and personal study purposes only and is not a recommendation and/or a solicitation to act upon under any interpretation of the letter.
LEGEND:
{curly brackets} = observations
= important updates
(parentheses) = information
~ tilde/approximation = variable value
-hyphen = fixed value

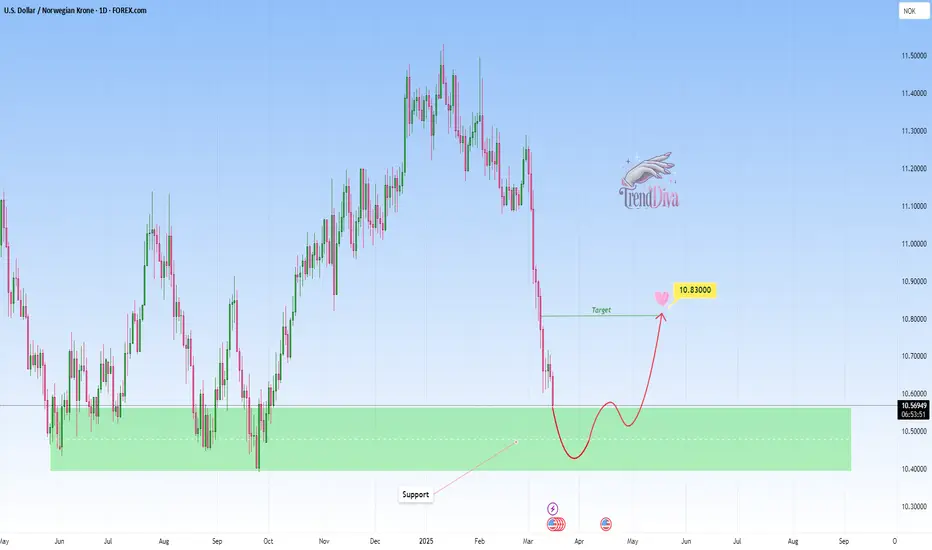
USDNOK - Buy opportunity towards 10,8300?OANDA:USDNOK is testing a clear support area, marked by previous bullish reversals and strong buyer interest. The recent bearish move into this zone suggests a potential buying opportunity if buyers confirm control.
If bullish signals, such as strong rejection wicks or bullish candlestick patterns, emerge, I anticipate an upward move toward 10,8300. If the support fails to hold however, further downside could be expected.
Remember, always confirm your setups and trade with solid risk management.
USDNOKHello guys its been a while since i made a post. This is my first post in 2025. i hope it finds you well. I have compiled a long term analysis for wave 1 to 5. Now we are in wave 5, the last lag to the upside.

usdnok go longOANDA:USDNOK
conclusion
monthly -down
weakly- down
daily - retracenent entry
only confirmation entry.no blindly entry confirm stoploss hit

USDNOK false breakout leading to breakdown?Intraday Update: The USDNOK slammed back to the 10.90's as the Norges CB kept rates unchanged today. As other central banks (like the BOE just minutes ago cutting rates) this has allowed the USDNOK to break back below 11.00. The 11.1500 is shaping up as key resistance and stops below the 10.9000 should be building.

USDNOK at key resistance today Intraday Update: End of month flows has take the USDNOK back above the 11.00 level, but in order to get above triangle resistance we will need to get past the elections, or perhaps a blowout NFP tomorrow. Bulls should take note of this long term triangle resistance.

USDNOK Very strong buy signal medium-term.The USDNOK has been consistently giving us excellent signals on this 2-year pattern with the last one (July 10, see chart below) being a buy that hit the 11.0000 Target:
This time the pair is again inside the 2-year Higher Lows Zone, while holding Support 1. The previous High was rejected on Resistance 1, so the Triangle may be transitioning into a Rectangle medium-term.
In any case, this low price is a buy opportunity with our Target being slightly below the Lower Highs trend-line at 10.9500.
-------------------------------------------------------------------------------
** Please LIKE 👍, FOLLOW ✅, SHARE 🙌 and COMMENT ✍ if you enjoy this idea! Also share your ideas and charts in the comments section below! This is best way to keep it relevant, support us, keep the content here free and allow the idea to reach as many people as possible. **
-------------------------------------------------------------------------------
💸💸💸💸💸💸
👇 👇 👇 👇 👇 👇

USDNOK Is Still Eyeing June LowsUSDNOK is sideways for the last two years that looks like a triangle within uptrend. It's an ABCDE pattern where wave E can be in play, ideally still to the lower side of a range for subwave (C) after the recent subwave (B) rally. Notice that we see price turning sharply and impulsively from the upper triangle resistance line as expected, so wave (C) is in full progress which can push the price down to 10.30 - 10.00 support zone before we will see stabilization and recovery.
USDNOK is not at the June lows yet, so we believe it's still in wave 4 correction before a continuation lower for wave 5 towards 10.30 – 10.00 zone. Ideal resistance is at 10.60 – 10.70 area.


USDNOK Buy opportunity above the 1D MA50.The USDNOK pair has been trading within a Triangle pattern for the past 2 years (since June 2022) and right now is consolidating right below the 1D MA50 (blue trend-line) after holding the Higher Lows Zone.
Within this 2-year pattern, every time the price broke above the 1D MA50 following a bottom bounce, the new Bullish Leg was initiated. Our Target is 11.000 (just below the Lower Highs trend-line).
-------------------------------------------------------------------------------
** Please LIKE 👍, FOLLOW ✅, SHARE 🙌 and COMMENT ✍ if you enjoy this idea! Also share your ideas and charts in the comments section below! This is best way to keep it relevant, support us, keep the content here free and allow the idea to reach as many people as possible. **
-------------------------------------------------------------------------------
💸💸💸💸💸💸
👇 👇 👇 👇 👇 👇


USDNOK Is Looking For More Short-Term WeaknessUSDNOK is sideways for the last two years that looks like a larger triangle within uptrend. It's an ABCDE pattern where wave E can be in play as pair stops at the upper side of this contracting range.
Ideally, market is coming down for a pullback within higher degree wave E, where pair can complete the sideways price pattern. So for now, seems like there is room for more weakness within a three-wave (A)-(B)-(C) decline to the lower side of a range.
Wave (B) looks to be a bearish triangle pattern, unless it's going to be more complex, but sooner or later it can send the price lower within wave (C) of E towards to 10.30/10.00 support area.
One of the reasons why USDNOK could face more weakness is also bullish looking Crude oil, which can boost the Norwegian Krone.

USDNOK One of the best sells in the market.The USDNOK pair has formed a cyclical top on the 1D time-frame and is currently pulling back towards the 1D MA50 (blue trend-line). This level has been supporting since March 14 2024. If broken, we expect a a 2nd dip to the 1D MA200 (orange trend-line) as well and as it pierces through the (green) Ichimoku Cloud, stage a dead-cat-bounce back at its top and the 1D MA50.
That should give way to the 2nd part of the Bearish Leg towards the 2-year Higher Lows Zone. Our target is on the top of that Zone at 10.400. Take profit earlier if the 1D RSI breaks below the 30.00 oversold barrier before the price reaches 10.400.
-------------------------------------------------------------------------------
** Please LIKE 👍, FOLLOW ✅, SHARE 🙌 and COMMENT ✍ if you enjoy this idea! Also share your ideas and charts in the comments section below! This is best way to keep it relevant, support us, keep the content here free and allow the idea to reach as many people as possible. **
-------------------------------------------------------------------------------
💸💸💸💸💸💸
👇 👇 👇 👇 👇 👇

USDNOKOn the monthly charts we have a confirmed bearish trend. Presently, on the monthly charts, we have a bullish correction that we can trade.
On the weekly charts we have a shift in order flow confirming our bearish bias though its a long term view. We have an impulsive bearish move that has necessitated a bullish correction to clear previous disequilibrium.
On the daily charts we have a minor shift in order flow from bearish to bullish that we seek to trade.

Make That Money Signals Buy for $USDNOKMTM has printed a 30m buy signal. Currently retesting confirmation candle. 1.5RR with trade shown based on previous demand/supply zones.

USDNOK: Ascending Broadening Wedge Partial-Rise ConfirmationUSDNOK after giving what has been a very nice performance off of that Bullish Butterfly has now confirmed a Partial-Rise within the Ascending Broadening Wedge it has traded within and now sits just below the 21 and 200-day SMA. We would now expect a heightened chance of the price breaking down and hitting the measured move target down at 9.4 NOK, which so happens to align with the 0.618 Fibonacci retracement.
For reference this is the previous Bullish Setup on the USDNOK before it confirmed the Partial-Rise:

USDNOK: Buy signal.USDNOK is trading inside a Channel Up for almost four months, with the 1D MA50 supporting as the medium term Support. The very healthy bullish 1D technicals (RSI = 62.188, MACD = 0.074, ADX = 41.092) indicate that the current price action will lead higher so we are buying into today's strength and aim at another +4.60% rise (TP = 11.500).
## If you like our free content follow our profile to get more daily ideas. ##
## Comments and likes are greatly appreciated. ##

USDNOK Pull-back in full motion. Buy it.The USDNOK pair is trading within a 1 year Channel Up with the price above both the 1D MA50 (blue trend-line) and 1D MA200 (orange trend-line). Last week's rejection on the 0.786 Fibonacci retracement level is similar with the one in March 16 2023, which after pulling back to the 1D MA50 and was contained above the 0.382 Fibonacci, it reversed upwards to a new Higher High just below the 1.236 Fibonacci extension. As a result, we will buy the current pull-back and target 11.5000.
-------------------------------------------------------------------------------
** Please LIKE 👍, FOLLOW ✅, SHARE 🙌 and COMMENT ✍ if you enjoy this idea! Also share your ideas and charts in the comments section below! This is best way to keep it relevant, support us, keep the content here free and allow the idea to reach as many people as possible. **
-------------------------------------------------------------------------------
💸💸💸💸💸💸
👇 👇 👇 👇 👇 👇

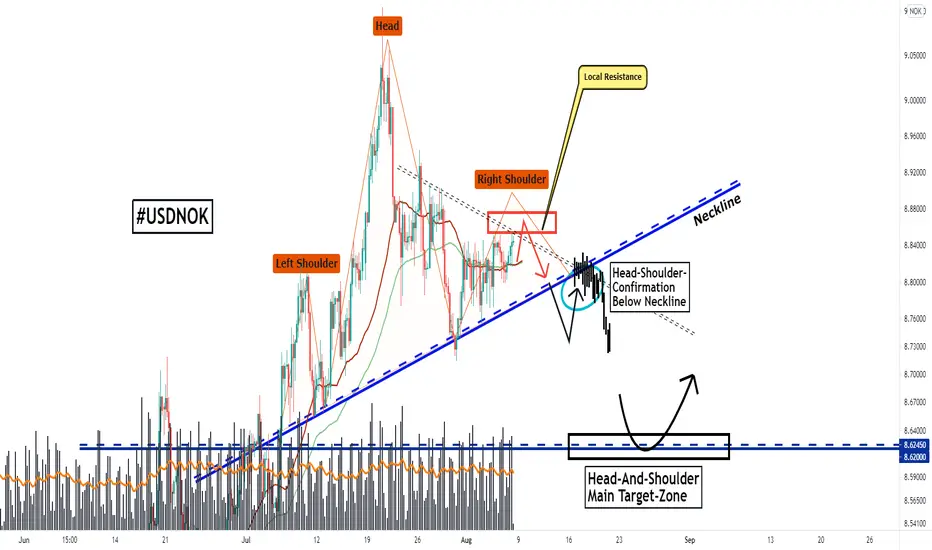
USDNOK, Major Head-Shoulder-Formation, Here Is How It Completes!Hello,
Welcome to this analysis about USDNOK and the 4-hour timeframe perspectives. In my recent analysis, I discovered some interesting signs forming in USDNOK which are important for the upcoming determinations. As when looking at my chart now we can watch there how USDNOK is about to complete this major head-and-shoulder-formation with the left shoulder and the head already completed and now USDNOK is about to continue with the right shoulder in the structure which will finalize likely as there is a main local resistance-zone marked in my chart in red from where USDNOK is likely to pullback and continue to complete the right shoulder in the schedule. Once USDNOK is below the 65-EMA in green and the 35-EMA in red the whole formation is likely to complete as the EMAs already formed a bearish crossover. Once USDNOK finally breaks out below the neckline as it is marked in my chart USDNOK will have finalized the whole formation and it will be the appropriate setup for the continuations to the downside as well as activation of the head-and-shoulder-target-zone marked in my chart in blue within the 8.62 Usd level. Once the target-zone has been reached the situation needs to be elevated anew and if USDNOK manages to firstly stabilize in the structure or sets up a further continuation to the downside, it will be an interesting and important development ahead.
In this manner, thank you for watching my update-analysis about USDNOK and the main head-and-shoulder-formation likely to complete and activate targets in the upcoming times, support the analysis with a like and follow or comment for more market insight!
"The high destiny of the market is to explicate, rather than to speculate."
Information provided is only educational and should not be used to take action in the market.