btc on bullish move#BTCUSD price have now fully at third pattern which possible move will reach 96300 for price reverse.
Above 95376 have strong bullish range which will reach 96300 for sell retracment, stop loss 95500.
If the third pattern holds strong above 96300 then bullish may continue to move till 98k.
DJ FXCM Index

gold on bearish#XAUUSD price have multiple retest and decline between 3280-3293.
Now we await for price breakout below 3275 to sell which will reach 3247, stop loss 3291.
Below 3247 have a reversal which will take the price back 3260-3280 for new formation.

EURUSD below its 4H MA50 signals more selling.The EURUSD pair broke last Wednesday below its 4H MA50 for the first time since the start of April and is now consolidating under it. Within its 3-month Channel Up, this has always been a signal of more downtrend to come as it was technically halfway through the Bearish Legs of the pattern.
Given that the 4H MA200 (orange trend-line) is the medium-term Support, our Target is at 1.12500, just above the Internal Higher Lows trend-line. Check also the 4H RSI sequences between these 3 Bearish Legs. It is exactly ranging between the levels it did half-way through those Legs.
-------------------------------------------------------------------------------
** Please LIKE 👍, FOLLOW ✅, SHARE 🙌 and COMMENT ✍ if you enjoy this idea! Also share your ideas and charts in the comments section below! This is best way to keep it relevant, support us, keep the content here free and allow the idea to reach as many people as possible. **
-------------------------------------------------------------------------------
💸💸💸💸💸💸
👇 👇 👇 👇 👇 👇

GOLD UPDATEHello friends✌
As you can see, after a sharp price drop, gold has entered a range that has formed a double top pattern that warns us of a continued price drop, so be careful🔊📈
*Trade safely with us*

EURUSD: Detailed Support & Resistance Analysis 🇪🇺🇺🇸
Here is my latest support and resistance analysis for EURUSD
for next week.
Consider these structures for pullback/breakout trading.
❤️Please, support my work with like, thank you!❤️
I am part of Trade Nation's Influencer program and receive a monthly fee for using their TradingView charts in my analysis.

TA for FX,Indices and many More!(Week 17,28Apr25)Hello fellow traders , my regular and new friends!
Which pairs or instruments should we keep a look out for?
For me I am looking at :
potentially more pullback (down) on EURUSD and the majors.(stronger USD)
SNP might have a day or 2 of upside and pullback (chance for long on the change in daily trend)
Potential H&S on EurGbp and Gold.
BTC to see potential long if there's decent pullback.
NFP this week, BOJ interest rate release as well! Take note!
Do check out my recorded video for more insights!
Do Like and Boost if you have learnt something and enjoyed the content, thank you!
-- Get the right tools and an experienced Guide, you WILL navigate your way out of this "Dangerous Jungle"! --

Incoming sells?! AUDCAD bearish sentiment Good day traders, I’m back with another setup on AudCad. Before I go into the thinking behind this setup I’d like to remind you that on the higher TF’s we still very much bearish that’s is my reasoning behind the bearish sentiment.
On Tuesday we saw price close lower to give us our high of the week but price has been disrespecting the high since Wednesday but failing to close above that high showing strength lower(Friday bearish candle). Going into the new week I believe we can expect price to keep disrespecting the high because we believe that CAD is gonna be weak but keeping the overall direction in mind(bearish) we do not wanna see price closing higher than the Tuesday’s high of the day.
4H we have shifted structure lower but price is still trading in the premium area, should price not fall below the low of previous week than we can expect manipulation higher to fill the FVG on the Weekly before continuing lower.

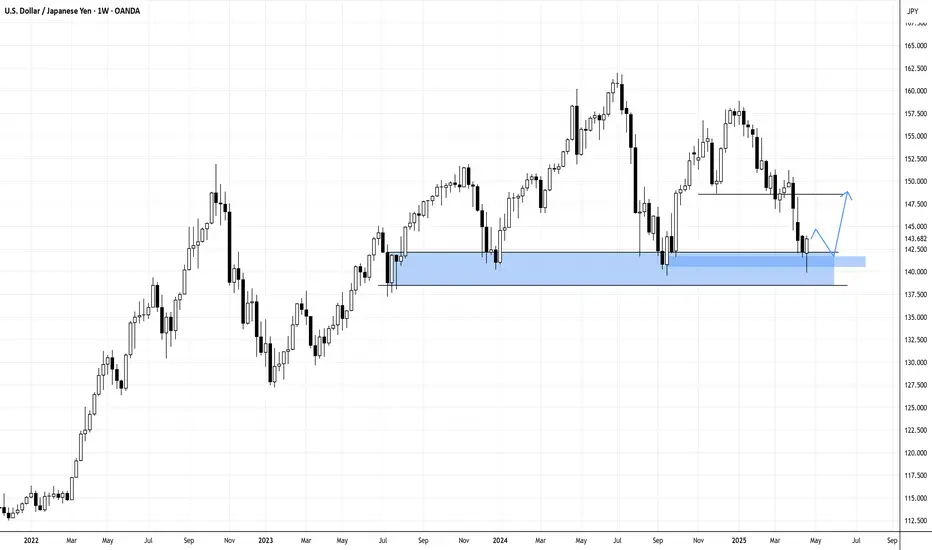
USDJPY Weekly Rejection at Support-Revisit Bearish Order Block?USDJPY pair last trading week got rejected at the same level that the pair has previously acted as a support level. Will this rejection cause USDJPY to rally towards a bearish order block above 147.50?
Risk Zones: 146.50
N.B!
- USDJPY price might not follow the drawn lines . Actual price movements may likely differ from the forecast.
- Let emotions and sentiments work for you
- ALWAYS Use Proper Risk Management In Your Trades
#usdjpy
#usd
#jpy
$SPELL/USDT Breakout Alert!🚀 $SPELL/USDT Breakout Alert!
SPELL has broken out of a symmetrical triangle on the 4h chart, confirming a strong bullish move!
• Entry: CMP
• TP: 0.0008612
• SL: 0.0005143 for risk management.
Momentum looks after consolidation — eyes on continuation if volume stays strong!
DYOR, NFA

NZDJPY - Bullish Double BottomHello Traders !
The NZDJPY price formed a double bottom pattern.
Currently, The neckline is broken!
So, I expect a bullish move🚀
______________
TARGET: 85.660🎯

Long on USD/AUDI am longing USD/AUD from 1.5750
Target 1 - 1.6050
Target 2 - 1.63
I believe we have completed an Elliot wave structure and expect to see upside from this location.
In addition, the stochastic RSI on the daily time frame is oversold.

BTCUSD POSSIBLE TRADE SETUPPotential Trade Setup on BTCUSD
The price has successfully retested the $75,000 region however to complete the corrective wave we can expect to see BTC drop further to the $70,00 before another round of bullish runs.
A BUY trade opportunity is best looked at after the full retest of the $71k and $70k region before I begin to buy Bitcoin
However, the SELL opportunity is clear below FWB:65K which can be regarded as 202 extreme dip.
You may find more details in the chart!
Thank you and Trade Responsibly!
❤️PS: Please support with a like or comment if you find this analysis useful for your trading.

Weekly FOREX Forecast: Mid-Week UPDATES! In this video, we will update Sunday's forecasts for the following FX markets:
USD Index
EURUSD
GBPUSD
AUDUSD
NZDUSD
USDCAD
USDCHF
USDJPY
Enjoy!
May profits be upon you.
Leave any questions or comments in the comment section.
I appreciate any feedback from my viewers!
Like and/or subscribe if you want more accurate analysis.
Thank you so much!
Disclaimer:
I do not provide personal investment advice and I am not a qualified licensed investment advisor.
All information found here, including any ideas, opinions, views, predictions, forecasts, commentaries, suggestions, expressed or implied herein, are for informational, entertainment or educational purposes only and should not be construed as personal investment advice. While the information provided is believed to be accurate, it may include errors or inaccuracies.
I will not and cannot be held liable for any actions you take as a result of anything you read here.
Conduct your own due diligence, or consult a licensed financial advisor or broker before making any and all investment decisions. Any investments, trades, speculations, or decisions made on the basis of any information found on this channel, expressed or implied herein, are committed at your own risk, financial or other wise. In this video, we will update the forecasts for the following FX markets:

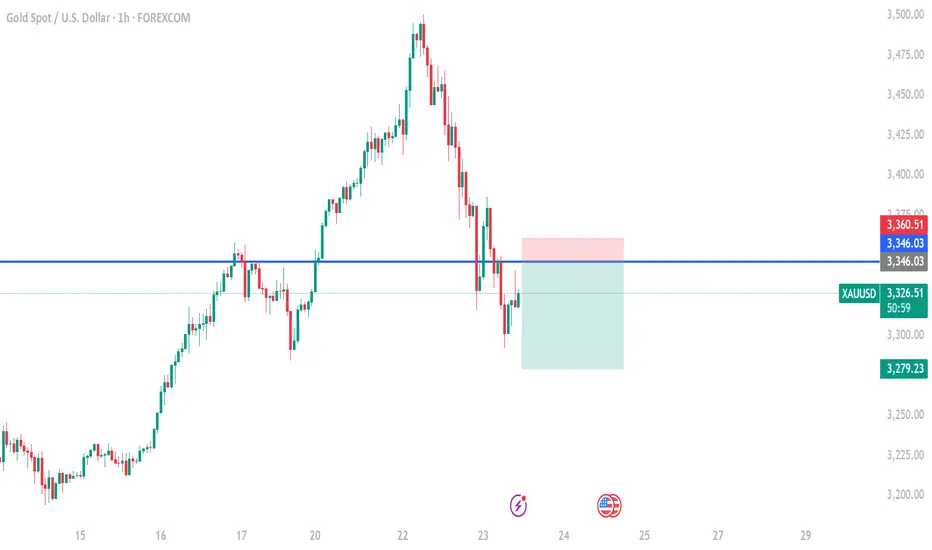
gold on sell#XAUUSD today we expect price to continue bearish, but firstly we need retest above 3346 to sell.
Above 3346 sell limit, take profit 3280, stop loss 3360.
Bullish can take formation unless the H1 candle closes long above 3350.
USD/CAD - Channel Pattern (22.04.2025)The USD/CAD Pair on the M30 timeframe presents a Potential Selling Opportunity due to a recent Formation of a Channel Pattern. This suggests a shift in momentum towards the downside in the coming hours.
Possible Short Trade:
Entry: Consider Entering A Short Position around Trendline Of The Pattern.
Target Levels:
1st Support – 1.3771
2nd Support – 1.3745
🎁 Please hit the like button and
🎁 Leave a comment to support for My Post !
Your likes and comments are incredibly motivating and will encourage me to share more analysis with you.
Best Regards, KABHI_TA_TRADING
Thank you.

US Dollar Index Decline in Wave C of A FlatTVC:DXY - has been trading lower from the 110 peak in wave "c" of a larger flat. We are currently in the late stages of wave (3) of "c".

gold on sell reverse#XAUUSD price have been fully charged on bullish, its possible to continue moving up but firstly we need reverse below the third pattern.
Below 3395 on 2 times breakout sell, Target 3366, stop loss 3410.
Without 2 times breakout on the limit price can move bullish.

EURUSD 3 TARGETS for selling 3 TOPS. The 5 year cheat-sheet!The EURUSD pair opened the week with a strong rally already due to the fundamentals surrounding the recent Tariff news. The 1W RSI is overbought at 74.00 and it hasn't been that high since January 22 2018. That was a long-term Top for EURUSD that initiated a 2-year downtrend until the March 2020 COVID crash and the start of massive rate hiking.
Even the last two times that the RSI came close to such overbought levels, the pair started a 6-month peak formation pattern with 3 Highs that offered solid short entries before the eventual larger downtrend. Those periods were January 30 2023 - July 17 2023 and August 31 2020 - May 24 2021.
Given that EURUSD is now trading within a long-term Channel Up (blue) and just formed a 1D MA50/ 1W MA50 Bullish Cross, we are closer to High (1) than not, since every time that is formed close to the standard +16.19% rise from the bottom.
For those successive Highs, our long-term sell targets will be 1.12500, 1.13250 and 1.12000 on the 0.382 Fibonacci retracement level respectively.
-------------------------------------------------------------------------------
** Please LIKE 👍, FOLLOW ✅, SHARE 🙌 and COMMENT ✍ if you enjoy this idea! Also share your ideas and charts in the comments section below! This is best way to keep it relevant, support us, keep the content here free and allow the idea to reach as many people as possible. **
-------------------------------------------------------------------------------
Disclosure: I am part of Trade Nation's Influencer program and receive a monthly fee for using their TradingView charts in my analysis.
💸💸💸💸💸💸
👇 👇 👇 👇 👇 👇

USDCHF - NEW BREAKDOWN !Hello Traders !
After a huge bearish move, the USDCHF broke the support level (0.83326 - 0.84152).
This key level becomes new resistance !
So, I expect a new bearish move📉
_______________
TARGET: 0.79300🎯

USDJPY Outlook – Bearish Continuation or Bullish Reversal??In this analysis, I'm breaking down the USDJPY structure starting from the 4H to identify the overall market direction (Bearish/Sells), then zooming into the 1H to fine-tune potential trade setups.
On the 4H timeframe, we’re assessing whether the recent bearish momentum is likely to continue or if price action is showing early signs of a bullish reversal. The LOW created at 141.800 level is our first target IF we continue to sell as its creating that LowerLow.
IF price closes bullish above 142.500, I will switch sides and look for potential buys.
On the 1H timeframe, I’m watching for a bullish liquidity sweep below141.888, followed by a clear break of structure to the upside on the 15m or 1H for more confirmation. That would indicate smart money accumulation and a potential shift in market sentiment—giving me confirmation to start looking for long setups.
🚀 Give me a boost and follow for upcoming $niper entries this week! 🦇🔥
CMCMARKETS:USDJPY

Bearish drop?US Dollar Index (DXY) has reacted off the pivot and could drop to the 1st support.
Pivot: 100.22
1st Support: 97.47
1st Resistance: 101.83
Risk Warning:
Trading Forex and CFDs carries a high level of risk to your capital and you should only trade with money you can afford to lose. Trading Forex and CFDs may not be suitable for all investors, so please ensure that you fully understand the risks involved and seek independent advice if necessary.
Disclaimer:
The above opinions given constitute general market commentary, and do not constitute the opinion or advice of IC Markets or any form of personal or investment advice.
Any opinions, news, research, analyses, prices, other information, or links to third-party sites contained on this website are provided on an "as-is" basis, are intended only to be informative, is not an advice nor a recommendation, nor research, or a record of our trading prices, or an offer of, or solicitation for a transaction in any financial instrument and thus should not be treated as such. The information provided does not involve any specific investment objectives, financial situation and needs of any specific person who may receive it. Please be aware, that past performance is not a reliable indicator of future performance and/or results. Past Performance or Forward-looking scenarios based upon the reasonable beliefs of the third-party provider are not a guarantee of future performance. Actual results may differ materially from those anticipated in forward-looking or past performance statements. IC Markets makes no representation or warranty and assumes no liability as to the accuracy or completeness of the information provided, nor any loss arising from any investment based on a recommendation, forecast or any information supplied by any third-party.

Weekly FOREX Forecast: Buy EUR, GBP, AUD, NZD vs USDThis is the FOREX outlook for the week of April 21 - 25th.
In this video, we will analyze the following FX markets:
USD Index
EUR
GBP
AUD
NZD
CAD
CHF
JPY
Not a lot of movement last week, as price traded in a small range. May see more of the same this coming week, as there are no major news events planned. The USD is still weak, and there may be opportunities to buy against it in the EUR, GBP, AID, NZD, CAD, CHF, AND JPY.
Wait for good confirmation before taking valid buy setups!
Enjoy!
May profits be upon you.
Leave any questions or comments in the comment section.
I appreciate any feedback from my viewers!
Like and/or subscribe if you want more accurate analysis.
Thank you so much!
Disclaimer:
I do not provide personal investment advice and I am not a qualified licensed investment advisor.
All information found here, including any ideas, opinions, views, predictions, forecasts, commentaries, suggestions, expressed or implied herein, are for informational, entertainment or educational purposes only and should not be construed as personal investment advice. While the information provided is believed to be accurate, it may include errors or inaccuracies.
I will not and cannot be held liable for any actions you take as a result of anything you read here.
Conduct your own due diligence, or consult a licensed financial advisor or broker before making any and all investment decisions. Any investments, trades, speculations, or decisions made on the basis of any information found on this channel, expressed or implied herein, are committed at your own risk, financial or otherwise.

DXY SINGLING DANGER! UPTADE! Bad things happen when the dollar gets too strong....
Well, "the bad thing" now seems to be the dollar itself crashing lower.
What a difference 2 months can make!
Waging economic war against our allies, pulling military defense from allies, isolationism has not been working as expected. In fact, Trump has overplayed his cards, and his tactics are backfiring.
CAUTION is in order!!
Target not reached! Forced on me.
As mentioned back on January 18, 2025, when the dollar gets this strong, bad things happen.
As you can now all see, bad things did happen. Markets are crashing, and we are headed for an economic depression!
WARNING!
