USD/CAD - Harmonic Patterns and Momentum IndicatorsTechnical Analysis of USD/CAD - Harmonic Patterns and Momentum Indicators
Overview:
The USD/CAD chart illustrates price action on the hourly timeframe, incorporating harmonic patterns, Fibonacci retracements, and momentum indicators to identify potential reversal and continuation points. The presence of a Crab harmonic pattern suggests a critical turning point, while momentum oscillators provide additional confirmation.
**Harmonic Pattern Analysis:**
1. A **Crab harmonic pattern** is evident, with the price reaching the terminal point at approximately **1.44627**.
2. The **XA and BC Fibonacci extensions** align with key retracement levels, reinforcing the likelihood of a reversal at this zone.
3. The price has **rejected the high point**, indicating potential exhaustion of bullish momentum.
**Support and Resistance Levels:**
- **HOP (Harmonic Optimal Point):** **1.44627** - The potential completion zone of the Crab pattern.
- **XA Retracement:** **1.43968** - A key structural support level.
- **BC Level:** **1.43721** - A secondary support level for price continuation.
- **T2 (Target 2):** **1.42596** - A potential downside target if bearish momentum continues.
**Momentum Indicators:**
- **Stochastic RSI & Relative Strength Index (RSI):**
- The **Stochastic RSI** shows a recent overbought condition, followed by a decline, indicating potential bearish momentum.
- The **RSI also exhibits bearish divergence**, where price made a higher high while RSI formed a lower high, suggesting weakening bullish strength.
**Market Sentiment & Potential Trade Opportunities:**
- Given the rejection at **1.44627**, a **short position** could be considered if confirmation of further downside emerges.
- A break below **1.43968** could reinforce the bearish bias, with **1.42596** as a potential target.
- However, if the price finds support and rebounds, a bullish continuation could be anticipated, requiring further validation.
**Conclusion:**
The **Crab harmonic pattern, overbought momentum indicators, and Fibonacci confluence suggest a possible bearish reversal**. Traders should monitor **key support levels and momentum shifts** to determine whether the bearish scenario plays out or if buyers regain control. Risk management and confirmation signals are crucial before entering a trade.
DJ FXCM Index

GBP/USD 15-Minute Chart: Bearish Reversal at Harmonic CompletionThe chart showcases a well-defined harmonic pattern, the Shark, with the price reaching the terminal zone at 1.2670 , marked by a red downward triangle. This suggests a potential reversal zone where selling pressure may emerge.
Key observations:
The price has reacted strongly at the completion point, aligning with Fibonacci extensions.
Overbought conditions are evident in the RSI and other momentum indicators, indicating potential exhaustion of the bullish trend.
Target levels:
T1: 1.26241
T2: 1.25741
Suggests a possible downside move if the reversal confirms.
Traders should watch for bearish confirmation before entering short positions, while bulls may seek a break above 1.2670 for further upside.

USD/CAD Market Analysis: Potential Reversal from Resistance ZoneThe USD/CAD pair on the 15-minute timeframe is showing signs of a potential bearish reversal. The price has been in an uptrend, forming higher highs and higher lows while respecting a diagonal support trendline. However, it has now approached a key resistance zone around 1.43575, as marked by the M15 supply area.
The current price action suggests a rejection from this resistance, with wicks indicating selling pressure. If the price breaks below the ascending trendline, a further decline towards the 1.42794 support level is likely. The risk-to-reward setup favours short positions if confirmation of a bearish structure shift occurs.
Traders should monitor price action closely for a trendline break or a strong bearish engulfing candle to confirm the sell-off.

USD | USD INDEX Weekly FOREX Forecast: March 10 - 14thIn this video, we will analyze the USD through the USD INDEX (DXY). We'll determine the bias for the upcoming week, and look for the best setups to take.
The USD is bearish, and there is plenty of economic news coming up this week. Should be plenty of opportunities from Tues through Friday.
Short term bullishness, in the form of a pullback, is potentially there. But longer term bearishness is likely to continue.
Enjoy!
May profits be upon you.
Leave any questions or comments in the comment section.
I appreciate any feedback from my viewers!
Like and/or subscribe if you want more accurate analysis.
Thank you so much!
Disclaimer:
I do not provide personal investment advice and I am not a qualified licensed investment advisor.
All information found here, including any ideas, opinions, views, predictions, forecasts, commentaries, suggestions, expressed or implied herein, are for informational, entertainment or educational purposes only and should not be construed as personal investment advice. While the information provided is believed to be accurate, it may include errors or inaccuracies.
I will not and cannot be held liable for any actions you take as a result of anything you read here.
Conduct your own due diligence, or consult a licensed financial advisor or broker before making any and all investment decisions. Any investments, trades, speculations, or decisions made on the basis of any information found on this channel, expressed or implied herein, are committed at your own risk, financial or otherwise.

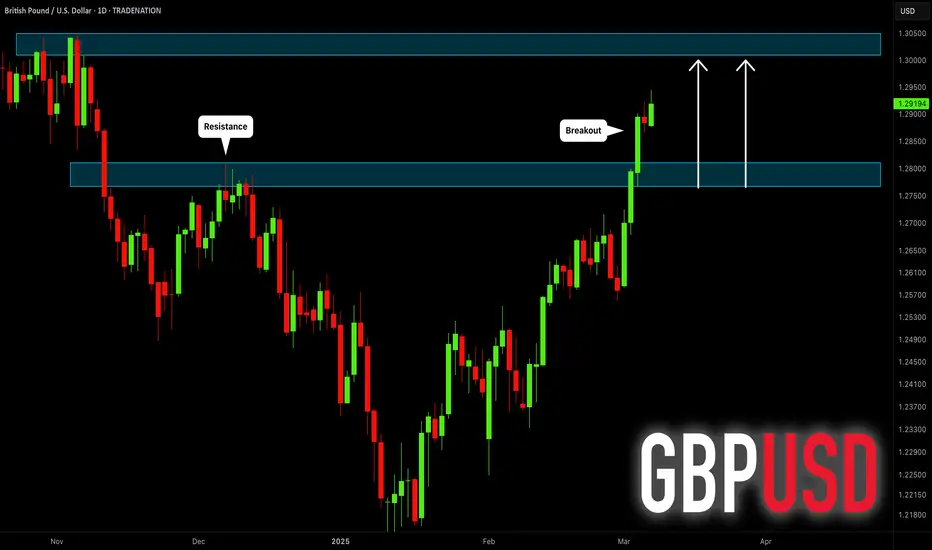
GBPUSD: Bullish Outlook For Next Week Explained 🇬🇧🇺🇸
GBPUSD broke and closed above a key daily horizontal
resistance this week.
The next strong historic structure is 1.3.
It will most likely be the next goal for the buyers the following week.
❤️Please, support my work with like, thank you!❤️
I am part of Trade Nation's Influencer program and receive a monthly fee for using their TradingView charts in my analysis.
Market Forecast UPDATES! Monday, Mar 3rdIn this video, we will update the forecasts posted last March 2nd for the following markets:
ES \ S&P 500
NQ | NASDAQ 100
YM | Dow Jones 30
GC |Gold
SiI | Silver
PL | Platinum
HG | Copper
Enjoy!
May profits be upon you.
Leave any questions or comments in the comment section.
I appreciate any feedback from my viewers!
Like and/or subscribe if you want more accurate analysis.
Thank you so much!
Disclaimer:
I do not provide personal investment advice and I am not a qualified licensed investment advisor.
All information found here, including any ideas, opinions, views, predictions, forecasts, commentaries, suggestions, expressed or implied herein, are for informational, entertainment or educational purposes only and should not be construed as personal investment advice. While the information provided is believed to be accurate, it may include errors or inaccuracies.
I will not and cannot be held liable for any actions you take as a result of anything you read here.
Conduct your own due diligence, or consult a licensed financial advisor or broker before making any and all investment decisions. Any investments, trades, speculations, or decisions made on the basis of any information found on this channel, expressed or implied herein, are committed at your own risk, financial or otherwise.

USDCHF: Channel Down bottomed. Buy opportunity.USDCHF turned oversold on its 1D technical outlook (RSI = 30.423, MACD = -0.005, ADX = 28.684), hitting the LL bottom of the Channel Down. The 4H RSI has made a Double Bottom and this is technically an ideal level to start buying the pair again. We expect a +2.60% rise like the late January bullish wave that will test the 4H MA200. The trade is long, TP = 0.89900.
## If you like our free content follow our profile to get more daily ideas. ##
## Comments and likes are greatly appreciated. ##

Falling towards overlap support?US Dollar Index (DXY) is falling towards the pivot and could bounce to the 1st resistance.
Pivot: 103.53
1st Support: 102.36
1st Resistance: 105.62
Risk Warning:
Trading Forex and CFDs carries a high level of risk to your capital and you should only trade with money you can afford to lose. Trading Forex and CFDs may not be suitable for all investors, so please ensure that you fully understand the risks involved and seek independent advice if necessary.
Disclaimer:
The above opinions given constitute general market commentary, and do not constitute the opinion or advice of IC Markets or any form of personal or investment advice.
Any opinions, news, research, analyses, prices, other information, or links to third-party sites contained on this website are provided on an "as-is" basis, are intended only to be informative, is not an advice nor a recommendation, nor research, or a record of our trading prices, or an offer of, or solicitation for a transaction in any financial instrument and thus should not be treated as such. The information provided does not involve any specific investment objectives, financial situation and needs of any specific person who may receive it. Please be aware, that past performance is not a reliable indicator of future performance and/or results. Past Performance or Forward-looking scenarios based upon the reasonable beliefs of the third-party provider are not a guarantee of future performance. Actual results may differ materially from those anticipated in forward-looking or past performance statements. IC Markets makes no representation or warranty and assumes no liability as to the accuracy or completeness of the information provided, nor any loss arising from any investment based on a recommendation, forecast or any information supplied by any third-party.


EUR/USD Falling Wedge The falling wedge pattern on the EUR/USD 12-hour chart has been confirmed, signaling a potential bullish breakout. This classic technical setup indicates a reversal from the prior downtrend, with buyers stepping in as price breaks above the upper resistance line of the wedge.
Key Details:
Pattern Confirmation: The breakout above the wedge resistance line confirms the pattern, with a retest further validating the upward move.
Targets:
Target 1: 1.0600 – Based on previous support-turned-resistance levels.
Target 2: 1.0900 – The measured move from the height of the wedge added to the breakout point.
This setup reflects the strength of technical analysis, with the falling wedge showing the market's tendency to reverse after sustained selling pressure. A strong support level provides the foundation for this bullish move.

USD/CHF Bearish Flag (06.3.25)The USD/CHF Pair on the M30 timeframe presents a Potential Selling Opportunity due to a recent Formation of a Bearish Flag Pattern. This suggests a shift in momentum towards the downside in the coming hours.
Possible Short Trade:
Entry: Consider Entering A Short Position around Trendline Of The Pattern.
Target Levels:
1st Support – 0.8826
2nd Support – 0.8787
🎁 Please hit the like button and
🎁 Leave a comment to support for My Post !
Your likes and comments are incredibly motivating and will encourage me to share more analysis with you.
Best Regards, KABHI_TA_TRADING
Thank you.

US Dollar Is Falling ImpulsivelyTrump tariffs and trade wars continue to dominate the market, and we have seen a strong sell-off in the US dollar recently. This reinforces the idea that the US may not win this battle easily, as some other countries have already responded and are trying to hit back. So it’s not a surprise that in this uncertainty stocks are also in a consolidation, but approaching a potential support.
Finally the USD is coming down, now breaking some key support at 106 which is an important indication for a resumption of a downtrend, especially if we consider that the current sell-off is sharp and can be third of a third wave.
So, a bearish trend can stay in play for much lower levels, mainly because Tariffs are delayed again, until April 2nd. Markets are stabilizing and recovering, while USDollar - DXY remains under bearish pressure with space for more weakness. Risk-On sentiment back?

gold on short bearish to reform back on buy.#XAUUSD price have dropped below 2900, which formed new pattern on bearish.
Now we await for another retracment below 2892 which holds strong sell. Target 2870-2865, stop loss 2906.
Below 2865 holds bullish reform because the candle moves shows a reversal to buy. Breakout above 2912 will continue bullish.

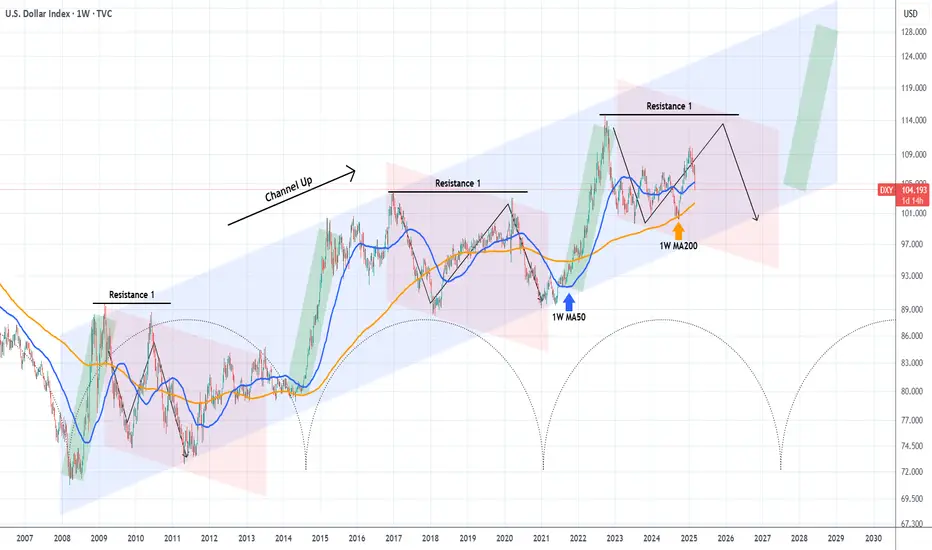
DXY looking for a final push higher before collapse.The U.S. Dollar index (DXY) has been on a strong decline recently, having even broken below its 1W MA50 (blue trend-line).
The multi-year trend is however bullish, a Channel Up pattern since the 2008 market bottom. With the use of the time Cycles tool, we can estimate when the next Bullish Leg starts, and that's not before 2027.
Based on the previous Channel Up corrections (red Channels) we should be expecting one final push towards Resistance 1, before a long-term decline and completion of the Bearish Leg.
As a result, as long as the 1W MA200 (orange trend-line) holds, we can take a low risk buy and target the 112.000 - 114.000 Zone.
-------------------------------------------------------------------------------
** Please LIKE 👍, FOLLOW ✅, SHARE 🙌 and COMMENT ✍ if you enjoy this idea! Also share your ideas and charts in the comments section below! This is best way to keep it relevant, support us, keep the content here free and allow the idea to reach as many people as possible. **
-------------------------------------------------------------------------------
💸💸💸💸💸💸
👇 👇 👇 👇 👇 👇
XAU/USD Bullish Flag (06.03.25)The XAU/USD pair on the M30 timeframe presents a Potential Buying Opportunity due to a recent Formation of a Bullish Flag Pattern. This suggests a shift in momentum towards the upside and a higher likelihood of further advances in the coming hours.
Possible Long Trade:
Entry: Consider Entering A Long Position around Trendline Of The Pattern.
Target Levels:
1st Resistance – 2949
2nd Resistance – 2969
🎁 Please hit the like button and
🎁 Leave a comment to support for My Post !
Your likes and comments are incredibly motivating and will encourage me to share more analysis with you.
Best Regards, KABHI_TA_TRADING
Thank you.

DXY (Bitcoin - Alt Season - Bullish) everyone suddenly started posting DXY chart so I figured I should give my 2 cents on it as well.
People are finding hopes in DXY but main charts are still BTC.D and USDT.D
Monthly Chart has the whole picture
Weekly Chart (above) is what interests us
Breaking that Green Macro Trendline will be the 1st step towards success!
remember how yesterday everyone and their mothers were bearish except me?
This drama will continue, ignore the noise...

US DOLLAR Approaching Key Support – Will Buyers Step In?TVC:DXY is approaching a key support level, highlighted by strong buying interest. This area aligns with a trendline support level, increasing the likelihood of a bullish bounce if buyers step in.
If the price confirms support within this zone through bullish price action—such as long lower wicks or bullish engulfing candles—we could see a reversal toward 106.200, a logical target based on previous market structure and price behavior.
However, if the price breaks below this support zone and sustains, the bullish outlook would be invalidated, potentially leading to further downside.
Just my take on support and resistance zones—not financial advice. Always confirm your setups and trade with solid risk management.
Best of luck!

EURUSD BUY...hello friends
As you can see, the price is correcting and we have identified its important supports for you.
Each of the supports is very important and we expect a reaction from each of them...
So here we can give you two suggestions:
1_React on any trade support (buy in low time and get fast)
2- In the 4 specified support areas, open a purchase transaction step by step, which is the same way we suggest to you.
*Trade safely with us*

btc on bullish#BTCUSD price have multiple retest below 81k and more. Now we await new formation above 93k
#BTC needs to decline above 93k which holds another short bearish retest, buy between 88700 which take profit is 93k. Stop loss at 87200.
Above 91k have bullish range also.

USD Down, but bounce expected. Intraday Update: The DXY hit the 161% extension of the Jan 27th lows to Feb 2nd highs. It's also the longer term 50% retracement. This "confluence" may allow for a bounce back to the 106.00 level before downside resumption.

gold on bullish#XAUUSD price still shows bullish range, we expected target will reach 2940.
Firstly we await for breakout above 2922, take profit 2935-2940. Stop loss 2908
Below 2900, price have a third pattern which can hold on bullish or breakout below for another correction below.

EURUSD Channel Up testing 1D MA200 after 4 months!The EURUSD pair has been trading within a Channel Up since the January 13 Low and after the 1D MA50 (blue trend-line) bounce, the current Bullish Leg is testing the 1D MA200 (orange trend-line).
This is the first 1D MA200 test since November 06 2024 and happens to be at the top of the Channel Up with the 1D RSI almost overbought (70.00). These conditions create a low risk opportunity for a short-term Sell. Our Target is the bottom of the Channel Up and the 1D MA50 at 1.04500.
-------------------------------------------------------------------------------
** Please LIKE 👍, FOLLOW ✅, SHARE 🙌 and COMMENT ✍ if you enjoy this idea! Also share your ideas and charts in the comments section below! This is best way to keep it relevant, support us, keep the content here free and allow the idea to reach as many people as possible. **
-------------------------------------------------------------------------------
Disclosure: I am part of Trade Nation's Influencer program and receive a monthly fee for using their TradingView charts in my analysis.
💸💸💸💸💸💸
👇 👇 👇 👇 👇 👇

US DOLLAR: Sell Opportunity after support breakTVC:DXY has broken below a key support zone, indicating a potential shift in momentum. The price is now retesting this zone, which previously acted as support and could serve as resistance, aligning with a potential bearish continuation.
If sellers confirm resistance at this level, the price is likely to decline further toward the 105.800 target , which aligns with a major support level. Conversely, a breakout above the zone could signal further upside.
Before considering short positions, look for bearish confirmation signals such as bearish engulfing candles, strong wicks rejecting the resistance zone, or increased selling volume.
Just my take on support and resistance zones—not financial advice. Always confirm your setups and trade with solid risk management.
Best of luck!
