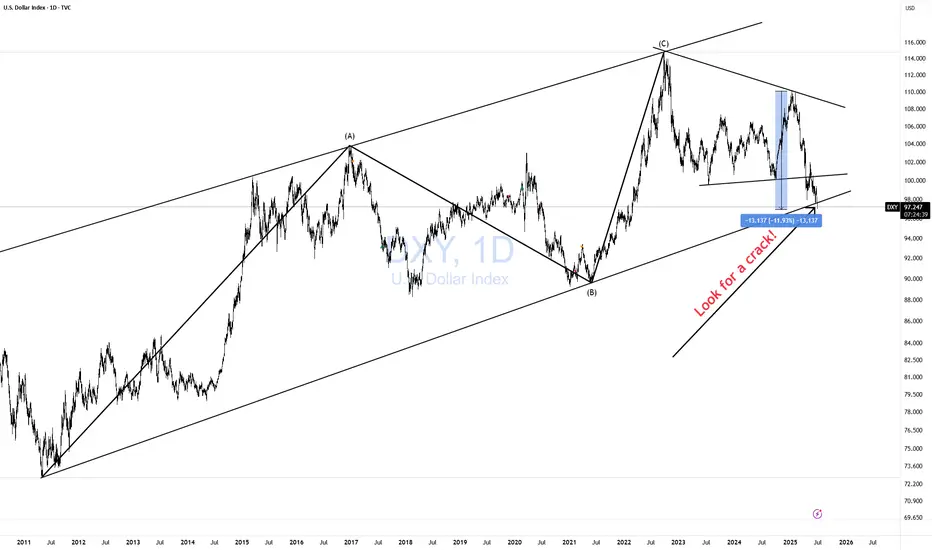
DXY CRACK! BAD JUJU!After Trump unilaterally imposed Tariffs (Taxes) on its citizens to buy imported goods from the rest of the world, promising 90 deals in 90 days, "in two weeks", the demand for the dollar payment system has collapsed by -12% reducing purchasing power for all $ holders'.
Imports of goods mean exporting $s to the rest of the world. As a world reserve currency (WRC), the US gets the benefit of seeing those $s invested back into the US. That creates demand for the $ payment system, and raises $ holders' purchasing power, reducing inflation.
What else happens? A bit complicated but I will try to explain. High demand for $ means the US indirectly exports inflation. Meaning, more $ for the same amount of goods and services. However, as a WRC, the US is not really exporting inflation. That is a bit inaccurate bc the US payment system as a WRC is actually includes a lot more goods and services from the entire planet. This makes sense if you think about it. However only going one way, meaning as long as the demand from the world for our payment system, more $ required by the world reflect more goods and services. As such not inflationary.
Now let's reverse it so you can see why it is not entirely accurate. Should the Global Economy (which is worth today about $100 trillion,) demand ever drop off. The $ value will collapse as people sell their $ holdings in exchange for other currencies. What you are seeing right now in this chart with a CRACK in it.
The US GDP is currently about $30 trillion. There is no way! A $ payment system designed for a $100T economy can suddenly absorb all those $ in a $30T economy. Inflation would skyrocket as more and more $ chase the same amount of goods and services ($30T). This is not rocket science. This is basic 3rd-grade arithmetic!
This CRACK! could be very bad JUJU!
CAUTION is in order. Don't let normality bias fool you. No matter how you feel about Trump. It is irrelevant to basic arithmetic.
DJ FXCM Index
SP500 short USD is losing its reserve currency status but I guess it is also loosing its measuring cup status as well.
While people are cheering for all time highs in USD, SP500 in CHF does not look good at all.

DXY Short-term rebound quite likely.The U.S. Dollar index (DXY) has been trading within almost a 3-year Channel Down, which has assisted us in choosing the right levels to sell high and buy low.
Despite being now on its 2nd major Bearish Leg, we see a short-term bounce possibly up to August quite likely based on the previous major Bearish Leg. As you see, the current setup resembles the April 13 023 Low after which the price rebounded short-term just above the 0.786 Fibonacci level, only to get rejected later and complete the bottom on the 1.1 Fib extension.
Even the 1W RSI sequences between the two fractals are identical. Therefore, before diving below 96.000, we believe a 100.000 test is quite likely.
-------------------------------------------------------------------------------
** Please LIKE 👍, FOLLOW ✅, SHARE 🙌 and COMMENT ✍ if you enjoy this idea! Also share your ideas and charts in the comments section below! This is best way to keep it relevant, support us, keep the content here free and allow the idea to reach as many people as possible. **
-------------------------------------------------------------------------------
💸💸💸💸💸💸
👇 👇 👇 👇 👇 👇

Euro's Surge on USD Weakness – Is 1.20 the Next Stop?EURUSD: Euro's Surge on USD Weakness – Is 1.20 the Next Stop?
Hello TradingView Community!
The EURUSD pair is currently commanding significant attention with its strong upward momentum.
🌍 Fundamental Highlights: Euro's Tailwinds & USD's Headwinds
The Euro has demonstrated notable strength, recently breaching the 1.17 mark to hit its highest level in over 3.5 years. According to ING, if this momentum holds, the next target could be 1.20, contingent on continued USD weakness.
The US Dollar faces considerable pressure following news that President Trump intends to name a successor to Fed Chair Powell soon, sparking concerns about the Fed's independence. Such speculation often leads to expectations of a more 'dovish' monetary policy, weakening the USD.
Adding to the Euro's support are the NATO agreement to increase defense spending targets to 5% and President Trump's seemingly "less aggressive" stance towards the EU.
In summary: Should USD depreciation persist, not only the Euro but other asset classes might also attract capital inflows, particularly given the ongoing uncertainties surrounding inflation risks and monetary policy.
📊 EURUSD Technical Outlook (H4/M30 Chart):
Our technical analysis of the EURUSD chart (image_b73298.png) confirms a clear and robust uptrend, characterized by successive higher highs and higher lows. The EMAs are in a bullish alignment, reinforcing this upward trajectory.
Upside Targets (Potential BUY Zones):
1.17807: The initial potential target if the bullish momentum continues.
1.18458: A higher target representing the next potential resistance zone.
Key Support Levels (Potential BUY Zones for pullbacks):
1.16070: A strong support level where demand could emerge after a correction.
An implied intermediate support around 1.166xx (visually suggested by price action between current levels and 1.16070) could also offer buying opportunities after minor pullbacks.
🎯 EURUSD Trading Plan:
BUY Zone 1 (Intermediate Pullback):
Entry: 1.16600 - 1.16700
SL: 1.16450
TP: 1.16800 - 1.17000 - 1.17200 - 1.17500 - 1.17807 - 1.18000 - 1.18300 - 1.18458
BUY Zone 2 (Strong Support):
Entry: 1.16070
SL: 1.15900
TP: 1.16200 - 1.16400 - 1.16600 - 1.16800 - 1.17000 - 1.17300 - 1.17600 - 1.17807 - 1.18458
SELL Zone (Consider only at upside targets with clear reversal signals):
Entry: 1.18458 (This is an upside target, but also a potential resistance for selling if strong reversal signals appear).
SL: 1.18600
TP: 1.18300 - 1.18000 - 1.17807 - 1.17500 - 1.17200 - 1.17000 - 1.16800
⚠️ Key Factors to Monitor:
Fed Leadership News: Any official announcements regarding the Fed Chair succession will trigger significant USD volatility.
Eurozone Economic Data: Upcoming inflation, GDP, and employment reports.
ECB Statements: The European Central Bank's stance on monetary policy.
Geopolitical Developments: Major tensions or agreements can influence market sentiment.
Trade smart and always manage your risk effectively! Wishing everyone a profitable trading day!

Potential bulllish reveresal?The US Dollar Index (DXY) is falling towards the pivot, which aligns with the Fibonacci confluence and could reverse to the 1st resistance.
Pivot: 97.08
1st Support: 96.44
1st Resistance: 98.10
Risk Warning:
Trading Forex and CFDs carries a high level of risk to your capital and you should only trade with money you can afford to lose. Trading Forex and CFDs may not be suitable for all investors, so please ensure that you fully understand the risks involved and seek independent advice if necessary.
Disclaimer:
The above opinions given constitute general market commentary, and do not constitute the opinion or advice of IC Markets or any form of personal or investment advice.
Any opinions, news, research, analyses, prices, other information, or links to third-party sites contained on this website are provided on an "as-is" basis, are intended only to be informative, is not an advice nor a recommendation, nor research, or a record of our trading prices, or an offer of, or solicitation for a transaction in any financial instrument and thus should not be treated as such. The information provided does not involve any specific investment objectives, financial situation and needs of any specific person who may receive it. Please be aware, that past performance is not a reliable indicator of future performance and/or results. Past Performance or Forward-looking scenarios based upon the reasonable beliefs of the third-party provider are not a guarantee of future performance. Actual results may differ materially from those anticipated in forward-looking or past performance statements. IC Markets makes no representation or warranty and assumes no liability as to the accuracy or completeness of the information provided, nor any loss arising from any investment based on a recommendation, forecast or any information supplied by any third-party.

XAU/USD - Channel Breakout (26.06.2025)The XAU/USD pair on the M30 timeframe presents a Potential Buying Opportunity due to a recent Formation of a Channel Breakout Pattern. This suggests a shift in momentum towards the upside and a higher likelihood of further advances in the coming hours.
Possible Long Trade:
Entry: Consider Entering A Long Position around Trendline Of The Pattern.
Target Levels:
1st Resistance – 3385
2nd Resistance – 3410
🎁 Please hit the like button and
🎁 Leave a comment to support for My Post !
Your likes and comments are incredibly motivating and will encourage me to share more analysis with you.
Best Regards, KABHI_TA_TRADING
Thank you.
Disclosure: I am part of Trade Nation's Influencer program and receive a monthly fee for using their TradingView charts in my analysis.

$DXY Repeating 2016 Post-Election I have highlighted the 2016 to 2020 Presidential Elections time period and then pasted that timeframe onto the 2024 election and found that the pattern is going along very similarly to Trump 1.0.
If we assume that the future unfolds the same as last time, which is low probability, of course, then the future will unfold as shown in the yellow bars going into the future, as shown.
Initially in 2016 post election there was a 7% rally in the U.S. Dollar Index and then a 15% retreat for the following year. So far in 2025 we have seen the same rally and a similar decline, but only faster this time.
It would appear as thought the bulk majority of the declines in the TVC:DXY are over at this time with perhaps 4% further downside over the balance of the year.
The Dollar Index has been useful for predicting changes in the earnings estimates for the S&P500 in the USA due to the high percentage of earnings coming back to the US for quarterly reporting. I have posted a few charts in the past which have been helpful at determining the risk in the stock market.
The behavior of the global central banks has certainly had its impact on monetary aggregates and inflation. The policy response since the Covid Pandemic has been for maximum liquidity and maximum Government spending to keep the global economy afloat. The post-Covid response is now coming to a head along with new policy directives to cut wasteful Government spending and to reduce inflation (caused the Gov't spending).
Global investors have flocked to the US for access to high technology stocks and have driven up the value of US assets to extreme levels compared to other markets. This adjustment phase where investors remove money from overvalued, or highly valued, US assets back to other markets has created a wave of selling in the US Dollar and US listed equities.
What does the future hold? We never know but we sure can learn from what happened in the past by looking at charts just like this one to see what may happen. Looks like a bounce in the TVC:DXY from here, followed by a new low and then a rebound into the next few years.
All the best,
Tim
April 22, 2025 1:16PM EST TVC:DXY 98.78 last

Overlap resistance ahead?The US Dollar Index (DXY) is rising towards the pivot, which is an overlap resistance and could reverse to the 1st support that lines up with the 127.2% Fibonacci extension.
Pivot: 98.50
1st Support: 97.21
1st Resistance: 99.30
Risk Warning:
Trading Forex and CFDs carries a high level of risk to your capital and you should only trade with money you can afford to lose. Trading Forex and CFDs may not be suitable for all investors, so please ensure that you fully understand the risks involved and seek independent advice if necessary.
Disclaimer:
The above opinions given constitute general market commentary, and do not constitute the opinion or advice of IC Markets or any form of personal or investment advice.
Any opinions, news, research, analyses, prices, other information, or links to third-party sites contained on this website are provided on an "as-is" basis, are intended only to be informative, is not an advice nor a recommendation, nor research, or a record of our trading prices, or an offer of, or solicitation for a transaction in any financial instrument and thus should not be treated as such. The information provided does not involve any specific investment objectives, financial situation and needs of any specific person who may receive it. Please be aware, that past performance is not a reliable indicator of future performance and/or results. Past Performance or Forward-looking scenarios based upon the reasonable beliefs of the third-party provider are not a guarantee of future performance. Actual results may differ materially from those anticipated in forward-looking or past performance statements. IC Markets makes no representation or warranty and assumes no liability as to the accuracy or completeness of the information provided, nor any loss arising from any investment based on a recommendation, forecast or any information supplied by any third-party.

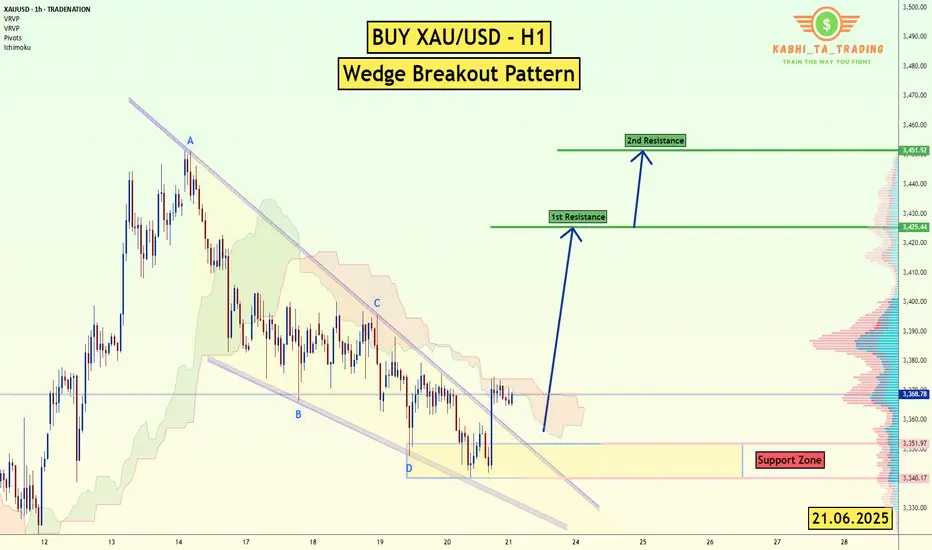
XAU/USD (Gold) - H1 - Wedge Breakout (21.06.2025)The XAU/USD pair on the H1 timeframe presents a Potential Buying Opportunity due to a recent Formation of a Wedge Breakout Pattern. This suggests a shift in momentum towards the upside and a higher likelihood of further advances in the coming Days.
Possible Long Trade:
Entry: Consider Entering A Long Position around Trendline Of The Pattern.
Target Levels:
1st Resistance – 3425
2nd Resistance – 3451
🎁 Please hit the like button and
🎁 Leave a comment to support for My Post !
Your likes and comments are incredibly motivating and will encourage me to share more analysis with you.
Best Regards, KABHI_TA_TRADING
Thank you.
Disclosure: I am part of Trade Nation's Influencer program and receive a monthly fee for using their TradingView charts in my analysis.
Bullish momentum to rise?The Aussie (AUD/USD) is reacting off the pivot which acts as an overlap resistance and could rise to the 1st resistance.
Pivot: 0.6457
1st Support: 0.6388
1st Resistance: 0.6546
Risk Warning:
Trading Forex and CFDs carries a high level of risk to your capital and you should only trade with money you can afford to lose. Trading Forex and CFDs may not be suitable for all investors, so please ensure that you fully understand the risks involved and seek independent advice if necessary.
Disclaimer:
The above opinions given constitute general market commentary, and do not constitute the opinion or advice of IC Markets or any form of personal or investment advice.
Any opinions, news, research, analyses, prices, other information, or links to third-party sites contained on this website are provided on an "as-is" basis, are intended only to be informative, is not an advice nor a recommendation, nor research, or a record of our trading prices, or an offer of, or solicitation for a transaction in any financial instrument and thus should not be treated as such. The information provided does not involve any specific investment objectives, financial situation and needs of any specific person who may receive it. Please be aware, that past performance is not a reliable indicator of future performance and/or results. Past Performance or Forward-looking scenarios based upon the reasonable beliefs of the third-party provider are not a guarantee of future performance. Actual results may differ materially from those anticipated in forward-looking or past performance statements. IC Markets makes no representation or warranty and assumes no liability as to the accuracy or completeness of the information provided, nor any loss arising from any investment based on a recommendation, forecast or any information supplied by any third-party.

Bearish drop?US Dollar Index (DXY) has reacted off the pivot and could drop to the 1st support.
Pivot: 98.59
1st Support: 97.69
1st Resistance: 99.25
Risk Warning:
Trading Forex and CFDs carries a high level of risk to your capital and you should only trade with money you can afford to lose. Trading Forex and CFDs may not be suitable for all investors, so please ensure that you fully understand the risks involved and seek independent advice if necessary.
Disclaimer:
The above opinions given constitute general market commentary, and do not constitute the opinion or advice of IC Markets or any form of personal or investment advice.
Any opinions, news, research, analyses, prices, other information, or links to third-party sites contained on this website are provided on an "as-is" basis, are intended only to be informative, is not an advice nor a recommendation, nor research, or a record of our trading prices, or an offer of, or solicitation for a transaction in any financial instrument and thus should not be treated as such. The information provided does not involve any specific investment objectives, financial situation and needs of any specific person who may receive it. Please be aware, that past performance is not a reliable indicator of future performance and/or results. Past Performance or Forward-looking scenarios based upon the reasonable beliefs of the third-party provider are not a guarantee of future performance. Actual results may differ materially from those anticipated in forward-looking or past performance statements. IC Markets makes no representation or warranty and assumes no liability as to the accuracy or completeness of the information provided, nor any loss arising from any investment based on a recommendation, forecast or any information supplied by any third-party.

EURUSD Channel Up formed bottom. Heavily bullish.The EURUSD pair has been trading within a Channel Up since the May 12 Low. Today it hit its 4H MA100 (green trend-line) for the first time since May 12 and having just broken also above its 4H MA50 (blue trend-line), it confirmed that the pattern has already priced its bottom.
This is initiating the new Bullish Leg and based on the previous two, it should grow by at least +3.21%. We have a modest short-term Target at 1.1800.
-------------------------------------------------------------------------------
** Please LIKE 👍, FOLLOW ✅, SHARE 🙌 and COMMENT ✍ if you enjoy this idea! Also share your ideas and charts in the comments section below! This is best way to keep it relevant, support us, keep the content here free and allow the idea to reach as many people as possible. **
-------------------------------------------------------------------------------
Disclosure: I am part of Trade Nation's Influencer program and receive a monthly fee for using their TradingView charts in my analysis.
💸💸💸💸💸💸
👇 👇 👇 👇 👇 👇

US Missiles Flyin'! Buy USD vs EUR GBP AUD NZD CAD CHF JPY!This is the FOREX futures outlook for the week of Jun 22-28th.
In this video, we will analyze the following FX markets:
USD Index, EUR, GBP, AUD, NZD, CAD, CHF, and JPY.
The USD is the world's reserve currency. When there are geo-political hot spots in the world, the USD sees inflows from investors. In light of US strikes against Iranians nuke sites last night, buying the USD versus other currencies is prudent and wise.
The USD should see more gains as long as the current tensions are high. If Iran comes back to the negotiations table, then the environment switches back to a risk on scenario, where the outflows from the USD go back into riskier assets like the stock market.
Enjoy!
May profits be upon you.
Leave any questions or comments in the comment section.
I appreciate any feedback from my viewers!
Like and/or subscribe if you want more accurate analysis.
Thank you so much!
Disclaimer:
I do not provide personal investment advice and I am not a qualified licensed investment advisor.
All information found here, including any ideas, opinions, views, predictions, forecasts, commentaries, suggestions, expressed or implied herein, are for informational, entertainment or educational purposes only and should not be construed as personal investment advice. While the information provided is believed to be accurate, it may include errors or inaccuracies.
I will not and cannot be held liable for any actions you take as a result of anything you read here.
Conduct your own due diligence, or consult a licensed financial advisor or broker before making any and all investment decisions. Any investments, trades, speculations, or decisions made on the basis of any information found on this channel, expressed or implied herein, are committed at your own risk, financial or otherwise.

USDJPY: Ready for Wave 5?USDJPY is showing a strong bullish wave structure, with a clear path toward higher levels based on Elliott Wave Theory. After a successful breakout from a multi-year consolidation, price action appears to be completing a Wave (4) correction thereby setting the stage for a Wave (5) rally.
Based on the bullish structure and projected continuation:
1st Target = 157.78
2nd Target = 177.41
Final Target = 209.16 Full wave extension, top of macro channel
With support holding above ¥140.00 and a bullish bounce forming, this could mark the Wave C bottom of (4), setting the stage for the next major leg up.
Disclaimer:
This analysis is for informational and educational purposes only and does not constitute financial advice. Markets are dynamic and unpredictable.

EUR/USD - H4 - Triangle Formation (31.05.2025)The EUR/USD pair on the H4 timeframe presents a recent Formation of a Triangle Pattern.
1. Wait for Breakout with Good Volume
2. Conformation in short Timeframe Must
🎁 Please hit the like button and
🎁 Leave a comment to support for My Post !
Fundamental Updates :
Dollar mixed on tariff uncertainty, U.S. President Donald Trump to battle a U.S. trade court ruling that blocked most of his proposed tariffs.
Your likes and comments are incredibly motivating and will encourage me to share more analysis with you.
Best Regards, KABHI_TA_TRADING
Thank you.
Disclosure: I am part of Trade Nation's Influencer program and receive a monthly fee for using their TradingView charts in my analysis.

GBPUSD hit its 1D MA50. Perfect buy signal.The GBPUSD pair has been trading within a Channel Up pattern since the January 13 2025 market bottom. Yesterday it hit its 1D MA50 (blue trend-line) for the first time since April 08.
This is the most efficient buy entry as the 1D MA50 has been supporting since the February 13 break-out. Even the 1D CCI turned oversold and rebounded, which is consistent with all bottom buys inside the Channel Up.
The Bullish Leg can extend to as high as +5.05% but due to the presence of the Inner Higher Highs trend-line, we first target 1.3850 (+3.43% rise).
-------------------------------------------------------------------------------
** Please LIKE 👍, FOLLOW ✅, SHARE 🙌 and COMMENT ✍ if you enjoy this idea! Also share your ideas and charts in the comments section below! This is best way to keep it relevant, support us, keep the content here free and allow the idea to reach as many people as possible. **
-------------------------------------------------------------------------------
💸💸💸💸💸💸
👇 👇 👇 👇 👇 👇

DXY US DOLLAR INDEXAs we can see on the chart, there’s a clear pattern emerging. The current movement of the index closely resembles the price action we saw between April 2015 and August 2018.
Assuming this fractal continues to play out, we could see more sideways movement until the end of the year — before a potential trend reversal kicks in.

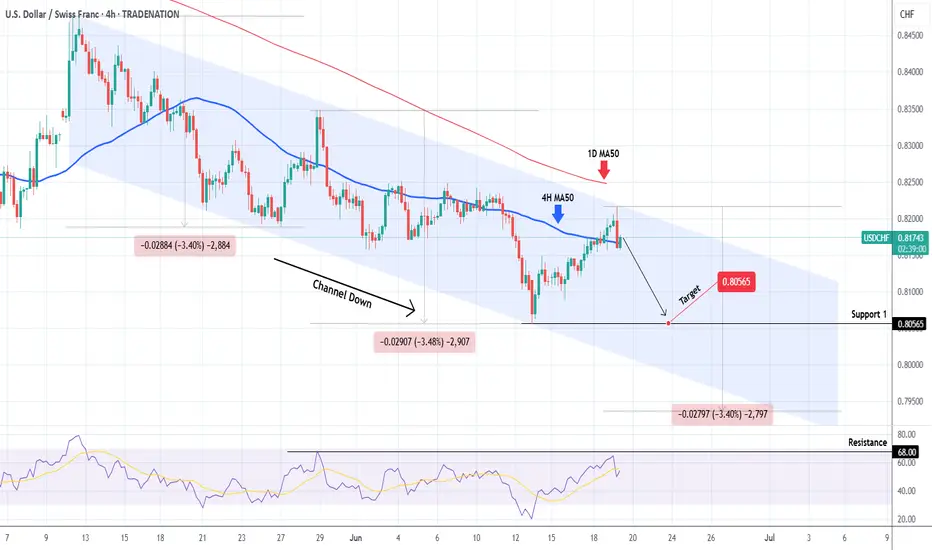
USDCHF Channel Down reached its top. Sell signal.The USDCHF pair has been trading within a Channel Down pattern since the May 12 High and today the price hit its top again. Trading above its 4H MA50 (blue trend-line) but still below the 1D MA50 (red trend-line), that maintains the medium-term bearish trend.
This is a strong bearish signal as it technically indicates that the new Bearish Leg is about to start. Support 1 at 0.80565 is a low risk Target. The previous 2 Bearish Legs have both gone for -3.40% declines, so technically the downside can be extended beyond Support 1.
-------------------------------------------------------------------------------
** Please LIKE 👍, FOLLOW ✅, SHARE 🙌 and COMMENT ✍ if you enjoy this idea! Also share your ideas and charts in the comments section below! This is best way to keep it relevant, support us, keep the content here free and allow the idea to reach as many people as possible. **
-------------------------------------------------------------------------------
Disclosure: I am part of Trade Nation's Influencer program and receive a monthly fee for using their TradingView charts in my analysis.
💸💸💸💸💸💸
👇 👇 👇 👇 👇 👇
GBP/USD - For FOMC & Fed Interest RateThe GBP/USD pair on the M30 timeframe presents a Potential Buying Opportunity due to a recent Formation of a Channel Pattern. This suggests a shift in momentum towards the upside and a higher likelihood of further advances in the coming hours.
Possible Long Trade:
Entry: Consider Entering A Long Position around Trendline Of The Pattern.
Target Levels:
1st Resistance – 1.3567
2nd Resistance – 1.3682
🎁 Please hit the like button and
🎁 Leave a comment to support for My Post !
Your likes and comments are incredibly motivating and will encourage me to share more analysis with you.
Best Regards, KABHI_TA_TRADING
Thank you.
Disclosure: I am part of Trade Nation's Influencer program and receive a monthly fee for using their TradingView charts in my analysis.

$USINTR -Fed Keeps Rates Uncut (June/2025)ECONOMICS:USINTR
June/2025
source: Federal Reserve
- The Federal Reserve left the federal funds rate unchanged at 4.25%–4.50% for a fourth consecutive meeting in June 2025, in line with expectations, as policymakers take a cautious stance to fully evaluate the economic impact of President Trump’s policies, particularly those related to tariffs, immigration, and taxation. However, officials are still pricing in two rate cuts this year.

Bullish bounce?US Dollar Index (DXY) is reacting off the pivot and could rise to the 1st resistance.
Pivot: 98.48
1st Support: 98.09
1st Resistance: 99.25
Risk Warning:
Trading Forex and CFDs carries a high level of risk to your capital and you should only trade with money you can afford to lose. Trading Forex and CFDs may not be suitable for all investors, so please ensure that you fully understand the risks involved and seek independent advice if necessary.
Disclaimer:
The above opinions given constitute general market commentary, and do not constitute the opinion or advice of IC Markets or any form of personal or investment advice.
Any opinions, news, research, analyses, prices, other information, or links to third-party sites contained on this website are provided on an "as-is" basis, are intended only to be informative, is not an advice nor a recommendation, nor research, or a record of our trading prices, or an offer of, or solicitation for a transaction in any financial instrument and thus should not be treated as such. The information provided does not involve any specific investment objectives, financial situation and needs of any specific person who may receive it. Please be aware, that past performance is not a reliable indicator of future performance and/or results. Past Performance or Forward-looking scenarios based upon the reasonable beliefs of the third-party provider are not a guarantee of future performance. Actual results may differ materially from those anticipated in forward-looking or past performance statements. IC Markets makes no representation or warranty and assumes no liability as to the accuracy or completeness of the information provided, nor any loss arising from any investment based on a recommendation, forecast or any information supplied by any third-party.

EURUSD: 4H MA50 may start aggressive rally to 1.17900.EURUSD is bullish on its 1D technical outlook (RSI = 58.513, MACD = 0.005, ADX = 36.044), trading inside a Channel Up for the past 5 weeks. Yesterday it made contact with its 4H MA50, which is the most common level of support inside this pattern. Based on that, we find highly probable for the pair to start the new bullish wave. A HH on the 2.0 Fibonacci extension has been a common feature of this Channel Up, hence we are turning bullish here with TP = 1.17900.
## If you like our free content follow our profile to get more daily ideas. ##
## Comments and likes are greatly appreciated. ##

DXY June 18 2025We believe that Trump's tariffs and the downward trend in U.S. interest rates will continue to put pressure on the dollar, leading to further depreciation.
Monthly Target: 95.445-101.977
