US-DOLLAR will probably move up!Crazy moves by the market today❗️
Higher inflation than expected and a stagnating Jobmarket shocked the market.
In the evening we`ve got a statement by James Bullard (St.Louis Fed) saying that it is possible for the FED to raise interest-rates even up to 1% until July.
As a result the US-Yields broke the 2% Resistance and is back at pre-pandemic-level.... how volatile.🙈
What do I expect for the next days?
Pumping US-Dollar and falling equities and so fakeouts everywhere.
Usdollarforecast

US DOLLAR CURRENCY INDEX : 1W ANALYSIS 💰
Some trading analysis for US Dollar Currency Index
We can see that price is respect zones and order blocks,
You have everything other on chart in small details.
If you find this helpful please hit like and follow.

DXY US Dollar Index: 1M Chart UpdateToday I am charting the The US Dollar Index (DXY) on a monthly chart over a multi-year period.
The chart shows a long term descending parallel channel (generally bullish), which the DXY has been trading in. Most recently it has broken a multi-year resistance zone, created through a double bottom pattern.
If the DXY breaks out of the descending parallel channel, we can see the price go up significantly as shown by the Fibonacci Extension (Trend-Based Fib Extension).
If the price gets rejected at the channel top, the price can go back down to as low as $60-65, which will create a triple bottom (generally bullish pattern).
This is a multi-year chart so don't expect everything to move quickly.
When zooming out, the US Dollar price looks very bullish in the long-term.
What are your opinions on this? I love reading your comments below.
Disclosure: This is just my opinion and not any type of financial advice. I enjoy charting and discussing technical analysis. Don't trade based on my advice. Do your own research! #cryptopickk

$DXY - USDOLLAR Loosing momentum ⚠️ - This idea is based on my technical analysis only. Do your research and trade on your own risk!

US DOLLAR INDEX READY FOR A MOVE DOWNUS Dollar index at a huge level of resistance so may give a push down to back the other currencies I'm looking at trading, USD index to push down would give EURUSD a nice upside move! Also a weaker US dollar will back my short bias on USDCAD. Anyone that doesn't use these index's as a reference I think should, it gives a good indication of how that currency is preforming.

DXY create bearish butterfly pattern. So, Short sell Now...
29 NOVEMBER 2021
DOLLAR INDEX MY VIEW-
N.B-DXY chart create bearish butterfly pattern.
So market seems bullish to 96.440 resistance zone. Then
market down to 95.828 and 95.114 support level.
If market break out 97.037 resistance level. Then
this case is invalid.

Can The Bulls Push The Dollar Higher?The Dollar index topped 96.00 last week and is now retracing. The bulls can potentially push price higher again if price can stay above the higher low at 95.51.
In this video, I've also added USDDKK which is a positively correlating currency pair. Take look and be sure you're following me here on Tradingview and Youtube(SLFX Trading).
Have a safe trading week.

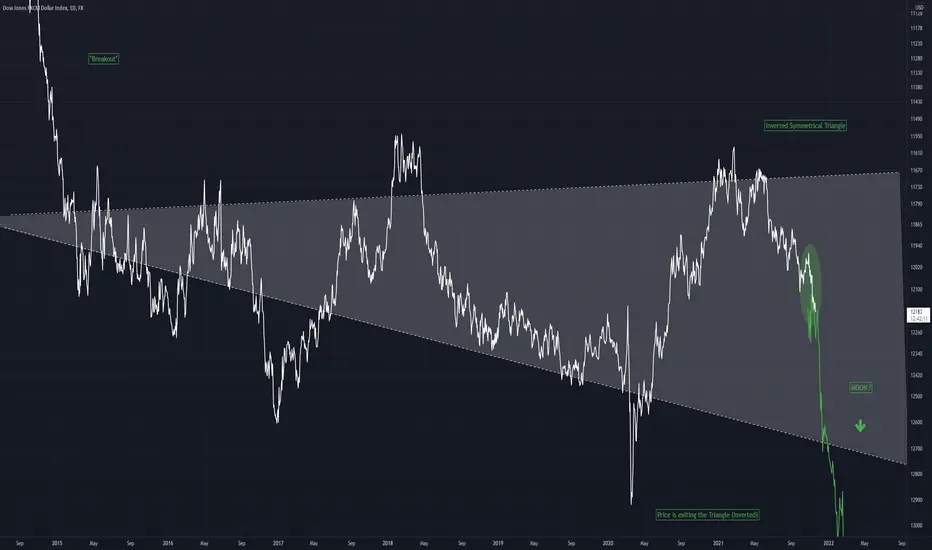
USDOLLAR Analysis - Symmetrical Triangle This is a chart for the USDOLLAR, which has been inverted to display the nature of a symmetrical triangle
Price can be seen to enter and exit on opposite sides
Using this assumption we can say that price will rise, at it climbs to exit the triangle (inverted)
#DXY US Dollar Index Forecast BullishToday I am charting the The US Dollar Index ( DXY ) on a monthly chart over a multi-year period.
The chart shows a long term descending parallel channel (generally bullish), which the DXY has been trading in. Most recently it has broken a multi-year resistance zone, created through a double bottom pattern, and now looking to test the top of the channel around $109-$110.
If the DXY breaks out of the descending parallel channel, we can see the price go to around $150-$155.
If the price gets rejected at the channel top, the price can go back down to as low as $60-65, which will create a triple bottom (generally bullish pattern).
Naturally this is a multi-year chart so it will take time.
When zooming out, the US Dollar price looks very bullish in the long-term.
What are your opinions on this? I love reading your comments below.
Disclosure: This is just my opinion and not any type of financial advice. I enjoy charting and discussing technical analysis. Don't trade based on my advice. Do your own research! #cryptopickk

possible of dxy wave 2 if dxy can stay below that red resistance probably we can expect dxy going for wave 2 and get a bearish trend for correct at least 50% of his wave 1 that i mention
saty safe and positive in market
if u like may idea follow and smash like plz

DXY create Head & Shoulder Pattern.So, SELL NOW....
DXY chart short term create heat and shoulder pattern. So market down to
93.920 & 93.600 zone. If the market break out 94.500 resistance level then
this case is invalid.
AronnoFX will not accept any liability for loss or damage as a result of
reliance on the information contained within this channel including
data, quotes, charts and buy/sell signals
If you like this idea, do not forget to support with a like and follow.
Traders, if you like this idea or have your own opinion about it,
write in the comments. I will be glad.

USDOLLAR:NEW BULLISH IMPUSE COMING ? LONG VIEW + TARGETS 🔔The Dollar, finally after the release of the NPF last Friday seems to be starting to breathe today after the last sessions in which the price has fallen inexorably. We can also see that EUR/USD today started the session with the USD in recovery, link in the description. As for this chart, we can technically analyze that the price has been in a rising trend for some time, just look at the rising lows and highs that appears today a rebound on a dynamic support / trendline, the price that has moved above the 200 average and that the stocastic seems to come out of the oversold zone with divergence. Bearish volumes seem to be decreasing. We await a new bullish impulse.

US-DOLLAR possible RALLY!Hey tradomaniacs,
So... the market was waiting for Powell and got the so called "Nothing Burger".
Powells Key-Notes:
1️⃣ Clear progress towards foll employment.
2️⃣ Could be appropriate to begin with tapering this year.
„My view is that the „substantial further progress“ test has been met for inflation. There has also been clear progress toward maximum employment. At the FOMC’s recent July meeting, I was of the view, as were most participants, that if the economy evolved broadly as anticipated, it could be appropriate to start reducing the pace of asset purchases this year.“
3️⃣ Dovish: The timing and pace of the coming reduction in asset purchases will not be intended to carry a direct signal regarding the timing of interest rate liftoff.
4️⃣ Inflation has reached 2 percent and is on track to moderately exceed 2 percent for some time.
So what did we get here? Well the market with a drastic sell-off of the US-Dollar and indicies rallied due to the hope that liquidity will still be provided, probably because the market has expected to see tapering until Q1 of 2022 and has priced that in.
However, for me personally all this is not really a dovish, more like a mixed statement that has dissapointed US-Bulls as things are not progressing as fast as expected. If data from the U.S. are good this week we could see more US-DOLLAR bulls taking action to push price up.
I will keep it slow this today as we get to see the Non-Farm-Payrolls, which will probably have a very strong impact in the market as market-players will evaluate the probabillity of more hawkish statements in the future.
We have often see strong moves after these vacuous statements which then got reversed quickly within a few days, which is why I want to observe price-action first also because the dovish news have pushed many pairs into resistance-zones and so good spots to follow the current trends.
Example: AUD/USD 👉https://www.tradingview.com/x/FqcCdCbO/
LEAVE A LIKE AND A COMMENT - I appreciate every support! =)
Peace and good trades
Irasor
Wanna see more? Don`t forget to follow me

Dollar Index on 1D Chart (Aug, 18th) "The US dollar index extended its upward momentum to, close to levels not seen since the end of March benefiting from a safe-haven bid on fears that a surge in infections of the Delta variant could derail the global recovery and a batch of mixed economic data.
Retail sales in the US declined more than forecast in July, with the core index also posting an unexpected drop while industrial production rose for a fifth consecutive month.
Also, US homebuilder confidence sank to over a one-year low as home prices surge.
Meanwhile, investors await more clarity from the Fed on the tapering timeline with FOMC minutes due on Wednesday."

Is the US Dollar Doomed?An absolute monster bearish setup is underway for the TVC:DXY . Inflation is coming!
Is this the crisis that initiates the inevitable switch to digital currency?
Everything shared here is my own opinion and no results are guaranteed. Good luck!

USDOLLARIt appears the usd has some room to run still until it reaches a higher time frame resistance area. I expect a volatile week because of significant event risk. inflation and J Powell is on the docket. In my opinion. To start the week, I expect the dollar to continue to fall towards near term support. The usd is vulnerable under 11850.00,in my opinion, and may retest the main support lower down on a break down of said price level. In the event inflation comes in hotter than expected we may see a run up to test the " key price area" i have outlined. Then it all depends on Powell"s statement for the determination for a possible break out of the range or drop back down under 11850. Never the less, the upside seems limited, as there is, what appears to be strong resistance higher up.


DXY Waite to Good Contamination......DXY chart create Dubble Top pattern. So, when market breakout 90.200 RISISTANCE zone.
Then the market and go up to 90.431 and 90.850 risistance zone.
If breakout 89.788 support level then dollar index buy case invalid.And down to 88.937 level.
Hello Traders, here is the full analysis for this pair,
let me know in the comment section below if you have any questions,
the entry will be taken only if all rules of the strategies will be
satisfied. I suggest you keep this pair on your watch list and see if
the rules of your strategy are satisfied.
PLZ! LIKE COMMAND AND SUBSCRIBE.

DOLLAR INDEX CHART UPDATE.....SELL
Dollar index chart break out support zone 92.500 level and retest that zone.
so, now its possible to reach 92.000 ,91.680 .up to 91.450 level.
dear Traders, here is the full analysis for this pair,
let me know in the comment section below if you have any questions,
I suggest you keep this pair on your watch list and see if
the rules of your strategy are satisfied.

USDOLLAR Index ForecastDollar in Range and will break either side after Accumulation or Redistribution of Prices

DOLLAR IN A BULLISH TREND! U.S government efforts to restore the dollar power + market history that we can see on the weekly timeframe can give the dollar a power to continue its bullish trend that began 22 February 2021!

US Dollar Index- Reverse Head and ShouldersUS Dollar Index- Reverse Head and Shoulders pattern confirmed.

