Double Bottom On US Dollar Index, Just Another Reason To LONGThe concerns over the second wave of Covid-19 has put US Economy into recession again, mostly on retail and manufacturing sides. However, double bottom on the chart gives us a hope that the US Dollar Index might recover in the short run.
Key Trading Plan:
i) LONG from the current price with the Take Profit Target at 97.84.
ii) SHORT if the price breaks the support level 95.72 with the Take Profit Target of 95.08.
‼️Disclaimer: Please be advised that we are NOT Financial Advisors. We are not responsible for the results of your Forex or CFDs trading. The only person responsible for profits or losses is yourself. You should not consider any market information, educational and analytical material as trading advice that defines your trading actions but purely as educational market material. Please be advised that S.I.D. Capital shall not be liable for any errors in quotes and trading platform software errors.
‼️This Channel and all information is intended for educational purposes only and does not give financial advice. S.I.D. Capital Signals is not a service to provide legal and financial advice; any information provided here is only the personal opinion of the author (not advice or financial advice in any sense, and in the sense of any act, ordinance or law of any country) and must not be used for financial activities.
Usdollarlong

My expectation on $This is what I expect DXY (USD index) to do. On M chart the USDX is on uptrend channel and currently trading at the bottom of channel. The index could reverse any time soon.
USDollar
USDollarIndex

US DOLLAR - Tracking Minor Waves - Wave 2 Almost CompleteJust a quick update on the status of the US Dollar following on from my previous idea linked below.
If you would like to learn how AriasWave works with regards to understanding corrections visit my website.
Please LIKE and FOLLOW to get notification of updates and future posts.

DXY US DOLLAR INDEX ABOUT TO EXPLODE HIGHER DXY US DOLLAR INDEX completing wave ii of 3 of C HIGHER.
This jives and confirms my Elliotwave bearish analysis on the S&P Futures (SPX500USD) just posted.
See link to S&P Forecast below.
Cheers!
Cyrus

US DOLLAR IdeaBig broadening wedge forming
Hopefully the recent drops acts as a double bottom and pushes price back up into the wedge
The recent touch of the fib transition line suggests the action through it will be bOOlish


USDCAD a strong possibility LONGUSDCAD at the flipzone and could rally up once the USD is ready to move and would stop acting up. As usual trade with care and use proper risk management.

#DXY ANALYSIS.. The US Dollar Index is currently on the verge of a very critical resistance, #DXY can be considered as an important leading indicator in the course of the markets on a global scale.. The increase of # DXY significantly reduces the risk appetite of investors in the markets and the demand for the dollar increases. In this context, examining the #DXY chart gives serious clues about the fluctuations that may occur in the markets..
If we look at the #DXY chart within the technical framework, we can easily express that the price movements from past to present constitute a structural similarity.. I firmly believe that #DXY is ready to go up, we will wait and see.. 102 is a very important resistance point and, if exceeded, #DXY can reach levels 112 and 120.. Just watch fractals..
The increase in demand for # Dollars in the crisis times from past to present brought strong sales in the stock and commodity markets, and also caused deep depreciation in the developing countries' currencies.. I think markets will become very interesting after 3,4 months..
Please do your own due diligence when it comes to trading.. Invest at your own risk..
I wish you all the best..

US Dollar - Back from Closing the Gap - Told You It'd Be Back!As I mentioned in my previous I idea USD has a a slightly different wave structure going on than the Euro. See, related posts.
I am expecting the US Dollar to get extremely strong in a Major Wave 3.
Stay tuned, more in depth analysis on the way once we break the highs.
Please LIKE and FOLLOW to get notification of updates and future posts.

GBPUSD; Bearish on the British Pound Against the US Dollar1. We have gotten a short signal on GBPUSD from our Silver Scalper strategy on the daily timeframe as our Range MA shows a downtrend (background Red) and our Bull/Bear has given a short signal.
2. If the market opens in the R1 range then you can consider entering short and remaining short until we get a Bull signal from Bull/Bear or Range MA shows an uptrend (background Green).
3. Levels to watch to the upside are the ranges at R1 - R3.
4. If the downtrend is still valid, we can add to our short position on additional Bear signals.
5. Levels to watch for reactions to the downside are S1 and S2 where we would hope to see a bull signal to exit short.
---
NOTE: We conduct market analysis on a daily basis from a trend trading perspective using our own in house built tools. If you like any of the content we provide please leave a like and a follow to show your appreciation.
---
STRATEGY USED: Silver Scalper
Trend Confirmation = Range MA
Entry Signal = Bull/Bear Power
Exit Signal = Bull/Bear Power OR Range MA

MCO vs USDOLLAR fractalComparison fractal of MCOBTC to USDOLLAR, very strange to see this correlation across such different pairs. Any thoughts? leave them below :) It can be seen that an ascending scallop led to a bullish breakout in both.


USDOLLAR Bullish Flag Continuation on H1; Awaiting BreakoutThe USDOLLAR's green 5-hour EMA has crossed above its orange 10-hour EMA (green ellipse) and the RSI is above 50 (blue rectangle). These are bullish developments and suggest an underlying positive momentum. We note that the greenback has almost completed a flag pattern (red parallel trend lines). To complete we need to see a breakout to the upside. A flag pattern is a continuation pattern i.e. the previous impulse up is the dominant direction if the pattern is a true flag. Moreover, flags fly at "half-mast”, which give a price target of 12,513 if realized.


USDOLLAR Runs into Resistance; Oscillators due to NormaliseHere we see the daily chart of FXCM's USDOLLAR index. We note that the green 5-day EMA is above the orange 10-day EMA with good angle and separation. This is indicative of the strong upwards momentum of the greenback. However, technically, the index has run into overhead resistance (red shaded horizontal) at a time when the RSI is overbought (in excess of 80). Furthermore, we can see that the EMAs crossed in early January at about the time the RSI pushed above 50 (aqua ellipses). Thus,the current impulse move is mature and certainly may be close to a correction. If a pullback does chart, it may very well be a buying opportunity. The greenback is a beneficiary of the renewed fears surrounding the spread of the coronvirus, particularity to areas outside of China (we have seen a jump in cases in South Korea and Italy). I.e. the USDOLLAR is currently being utilised as a safe haven and this is likely to continue given the poor choice of alternatives (the JPY seems to have been stripped of this status, at least temporarily. following its 1.6% GDP contraction last week).

USD/CAD Trend ReversalWe expect USD getting stronger and stronger against CAD and reverse of trends when it comes to midterm.
Entry: 1.305
Stop-Loss: 1.295
Target: 1.327
Have a nice week! Follow for more

DXY Wave Pattern and Candlesticks suggest 99.00Candlestick matches in dollar price action (see blue boxes) and fairly clear impulse wave structure suggest a move now to 99, and possibly further advances. Buy 98 for 99, L 97.50, 2:1

USDOLLAR Ascending inverse scallopAscending inverse scallop, looks like the short term drop has already begun, looking for bullish continuation.
DXY 08102019DXY ready for take-off ?
Share your thoughts and observation in comments session :)
-------------------------------------
Risk warning!
Trading carries a high level of risk to your capital and may result in losses that exceed your initial deposit.
Supplied information is not advice.
-------------------------------------

USDJPY formed bullish shark | A good long opportunityAfter successful formation of bullish Shark pattern the price line of US Dollar / Japanese Forex pair Yen has formed another bullish shark pattern.
Even though the price action has hit the sell zone upto 0.382 fibonacci but all indicators are still turning bullish therefore I am expecting more profit.
MACD is turning bullish
Stochastic is oversold and has given bull cross
Volume profile is showing less interest of traders at this area.
I have used Fibonacci sequence to set the targets:
Buy between: 105.502 to 103.691
Sell between: 107.035 to 110.572
Regards,
Atif Akbar (moon333)


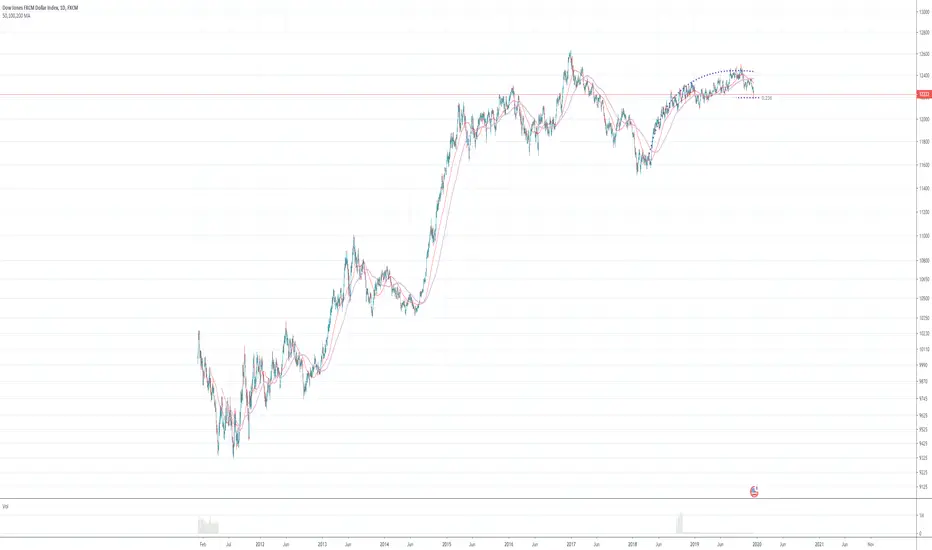
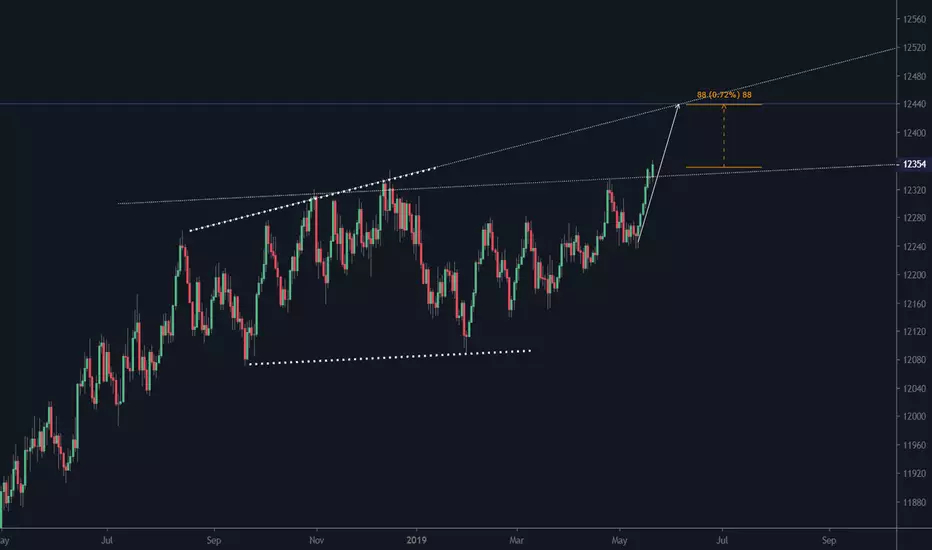
USDOLLAR before 0.72% increase. The exchange rate builds a rising wave structure. The target price is 12435
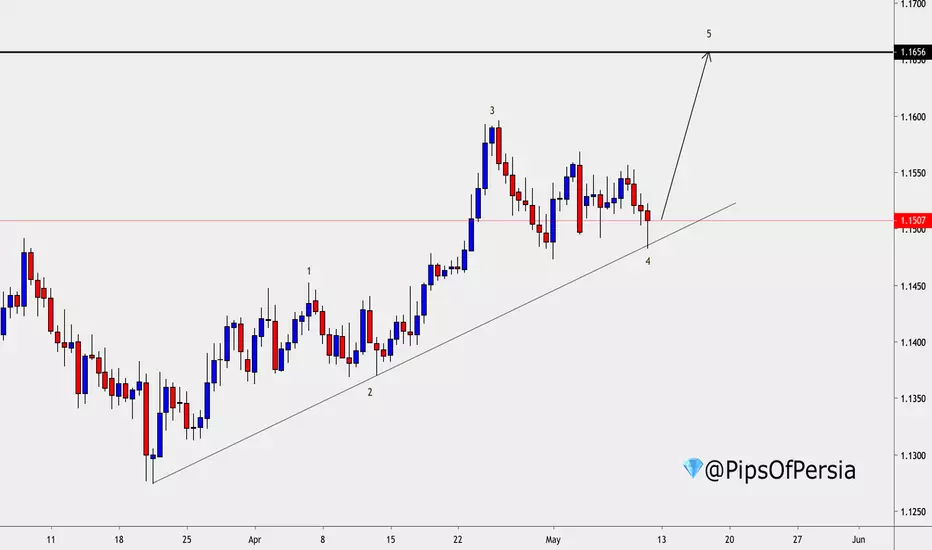
BULLISH USD?!Simple 12H analysis on the USD Weighted Index (not DXY)
Seems as though we are creating a 1-5 elliott wave, and reacting strongly to the drawn trendline.
I expect the market to form the final wave, completing the elliott pattern, and for the impulse to be exact same size as the first wave, which will then bring us to the marked zone, which is a very key weekly reversal area.
USD still has some room to gain strength, even with all the trade wars happening. So i expect this to be a smooth journey for a bullish USD across the board.
@PipsOfPersia
t.me