Let's make some money boysThe case for USDJPY longs is strong:
1) Strong support area
2) Strong correlation with 10Y yield differential (shown in white). This differential should increase dramatically in the next few weeks/months.
3) Speculative interest is no longer at its highest levels.
4) Other risk assets (e.g. equities) remain well supported.
The market can remain irrational for longer than 'makes sense'.
However these are the opportunities to make real money.
Usdollarlong

BUY USD: Month-end rebalancing flowsToday's month-end rebalancing flows were understandably USD negative, given the recent USD positioning in the market.
They have given us excellent levels to add to USD longs.
The USD uptrend should resume, given the strong fundamentals in play.
Donald Trump's jawboning simply cannot weaken the USD materially, since he cannot reduce the structural dollar shortage, the $10 trillion off-shore debt or the normal mean reversion of term premia on longer dated treasuries.
I maintain that these are excellent levels to buy USD against all major currencies except gold, given the current monetary policy divergence and structural divergence.
DXY TO RESUME UPTREND: Divergence with 10Y YieldBond yields are moving upwards - NOT because of rate hike or inflation expectations - but because of changes in term premia of longer dated bonds.
Investors are demanding a higher premium to hold longer dated Treasuries.
This naturally pushes bond yields up.
DXY is normally extremely correlated with Treasury yields.
Right now, DXY is trading at a discount compared to the 10Y yield.
This needs to be corrected - suggesting that DXY will resume its uptrend.
Furthermore, US Treasuries are now 'high yielding' bonds.
This should result in capital inflows to the US, away from low yielding currencies such as EUR and JPY.
Equity markets suggest that the current economic climate favours risk, i.e. a 'risk-on' environment.
This, historically, supports high yielding currencies, in particular USD versus EUR and JPY.
All things considered, there are many fundamental arguments supporting USD against most G10 currencies.

Prepare your USD longs!From the chart we can see that the US downtrend will probably end around the 3rd of Feb. A bounce around 12200 and break from the red line, would clearly indicate the end of the pullback after the strong USD rally.
Many important news are coming at the end of this week and during next week, which could really speed things up depending on how good or bad they are for the US trading pairs. I don't expect the fundamentals to be that bad for the US economy and I think the most important things to look at is the FED meeting on the 1st of Feb, as well as the unemployment, non-farm payrolls and the ISM non-manufacturing data on the 3rd of Feb.
www.dailyfx.com

Long Setup for USDCADLooking for a breakout to the upside, due to the strengthening of the US dollar


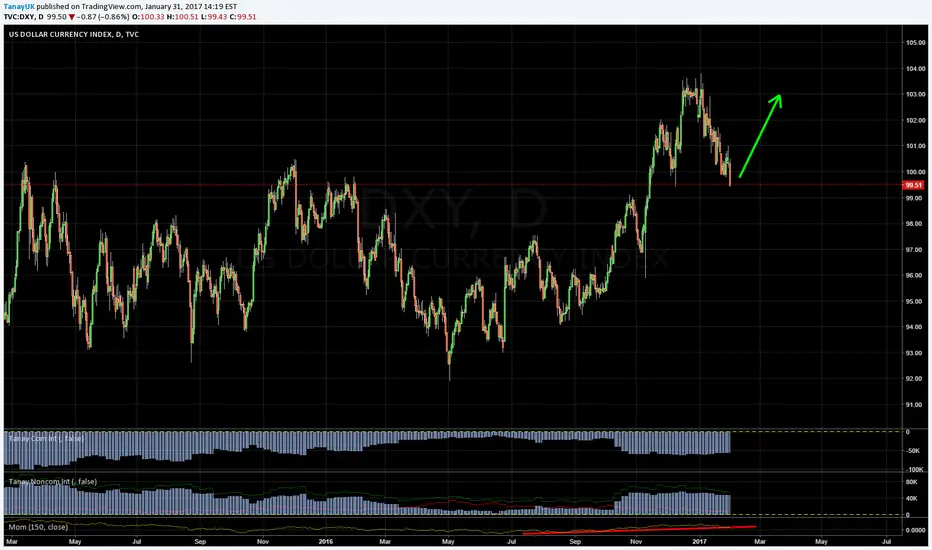
US DOLLAR (DXY) MEDIUM TERM LONG: Fundamental and TechnicalFundamentally: rising interest rates, higher inflation expectations and a rise in US yields relative to other major G10 currencies should continue to drive the dollar higher.
Further into 2017, $10 trillion of off-shore dollar denominated debt is massively bullish for the greenback.
Technically: The dollar index has broken 100.50 - a major multi-year resistance level.
It has now corrected back to that level, and is supported by the 100.50 - 100.00 region.
After this correction, the dollar index should continue higher to the 105 handle.

New lows in gold for 2017?$GC1! has pretty much proven the 2016 rally was just a reaction high. We'll have confirmation if we close year end below 1307. A close below the 1179 quarterly bearish for year end would raise the probability of new lows DRAMATICALLY.
Would be great value if we could get a pullback to the previously elected monthly bearish level (1242.1) and 50/60 ema. That move would most likely coincide with a pullback in the $DXY -0.14% and $DJY0 to their fib/ema areas.
As Marty always says, just watch the numbers.

USDJPY 10% Move Coming...One of my Golden Pattern is being formed in USDJPY charts and it suggests an up move of 10% very soon, buying zone is till 99, targets could be of around 110, initial.

usdollar dollar is heading up if the opec meetings on november go to plan in cutting oil. Also the dollar is retesting 12100 to 12160 until the interest rate decisions.

DXY UPDATE - Konrad $ Comp ReviewMy Dollar Combo Index has been shaping up nicely on the count of the two cycles and I am seeing other items of similar process. I believe that we either had the bottom on 8/16 with the low at 11691 or a new low will only be a minor test and slightly lower. Based on the Count the suggestion to buy the open on August 18 would still hold. Stops can be low risk at this juncture.
We are we:
1) We are at Day 7. In the first count this was the absolute low, it is possible that day 6 (8/16) produced the low.
2) Divergences have materialized in both counts with the Stochastic and %R
3) The Murrey Math Osc, has gotten to the squeeze point of staying long. In the previous count prices were coming off of the low point and Day 8 produced a Buy Signal in Osc. I think here it will only be the squeeze and then a resumption of up.
The Bias is to Buy on August 18 on the open of Trading. With Stops below the must recent low. This count becomes invalid on a close below the most recent low as then it would have potential to move back in to the support band. Obviously no one can predict the future and this advice is only provided as a means of a potential observation. Trade at your own risk


US DOLLAR INDEX - BULLISHDaily US Dollar Index - Bullish Bias.
To determine whether price is trending up or down - is it making higher highs and higher lows (uptrend) or is making lower lows and lower highs (downtrend.) At the start of December, the price of the US dollar started a down trend. It made lower lows (highlighted by orange circles) and lower highs (highlighted by yellow circles.) A trend reversal happens when the price fails to create a new lower low and price rises above the previous lower high. An inverse head & shoulders pattern is a perfect example of this as price at the right shoulder failed to go below price at the head.
We can also see a huge bullish candle breaking a descending inner trend line confirming a trend change for the time being.
An extra confluence for my bullish bias is my moving averages have crossed to the upside (just before the trend line break) hinting price is to rise. On the weekly time frame, my moving averages are about to cross over to the upside too - another confluence.
A simple A,B,C,D pattern shows us a 61.8% Fibonacci retracement at the C leg. I'm expecting price to reach 97.00 to complete the D leg and pattern.
If we get a break of the neckline from the head & shoulders pattern, and a break of the weekly resistance (we've had 3 weeks where price has failed to break above it) we could see price test the outer descending trend line. If we can get a break of that, I think price may head up to 100.00 in the weeks to come. Measuring the head to the neckline and copying it to neckline breakout area. Lines up well with monthly resistance at 100.00
Just got to wait and see how it plays out!

DXY - US DOLLAR - Long to 1.618 extensionUS Dollar 15m Long
DXY Long
We have just completed an ABC -and retest of the trendline for more upside next week.
The 0-2 might be an ABC correction, either way, the trajectory still looks long for a few days next week.

DXY - 4HR LONGDXY - Long on 4HR/Daily Chart to the 1.618
break and retest of trendline as part of bullish elliot wave pattern

US Dollar Currency Index (DXY) - Waiting for a ConsolidationThe price is touching a resistance + MA (200). The price will probably drop down to this area and then will continue its upward trend.

They Said USD Dooming - ORLY?I don´t think so.... In the aftermaths of the incoming Brexit the US Dollar will be KING!
All The Best... Stay Safe!
Happy Tarding


DXY bounce from 94 / 93.5 bullish divergence RSI LONGDXY bounce from 94 / 93.5 bullish divergence RSI LONG

USDOLLAR Index ready for an upswing?The USDOLLAR index has reached the bottom of the upward channel it has been maintaining for months. The last candle is indicating that the index is ready for an upswing, the stochastic indicator confirm this appreciation. It is time to watch related pairs like USDJPY, GBPUSD and EURUSD for good trades.

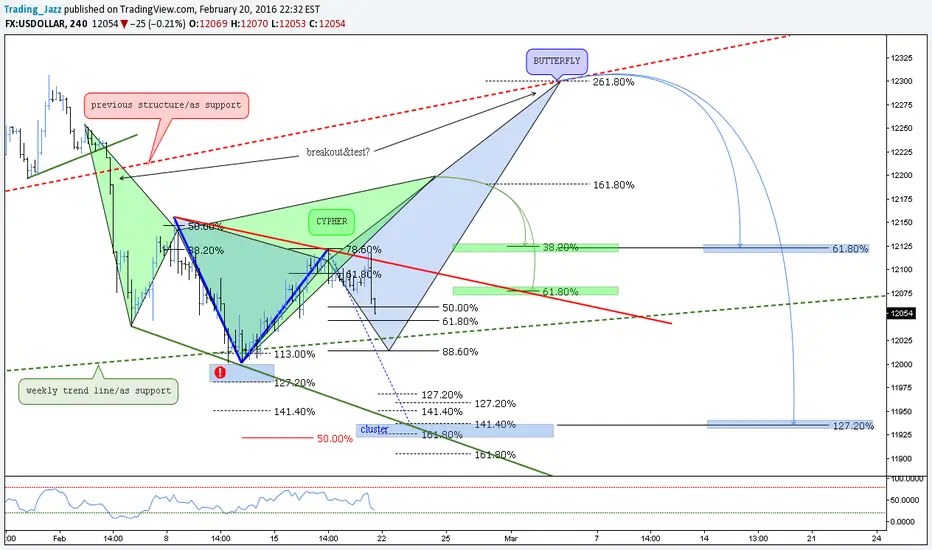
(4h) Harmonics, Cluster & The Previous Structure // IF=THEN ®FX:USDOLLAR
CYPHER:
Point B:
38.2% to 61.8% XA
Point C:
127% to 141% ext XA
Point D:
78.6% XC
Target:
TP1 38.2% CD
TP2 61.8% CD
BUTTERFLY
Point B:
78.6% XA
Point C:
38.2% AB
88.6% AB
Point D
161% ext BC
261% ext BC
Targets:
TP1 61.8% CD
TP2 127% CD
Safe Trades;