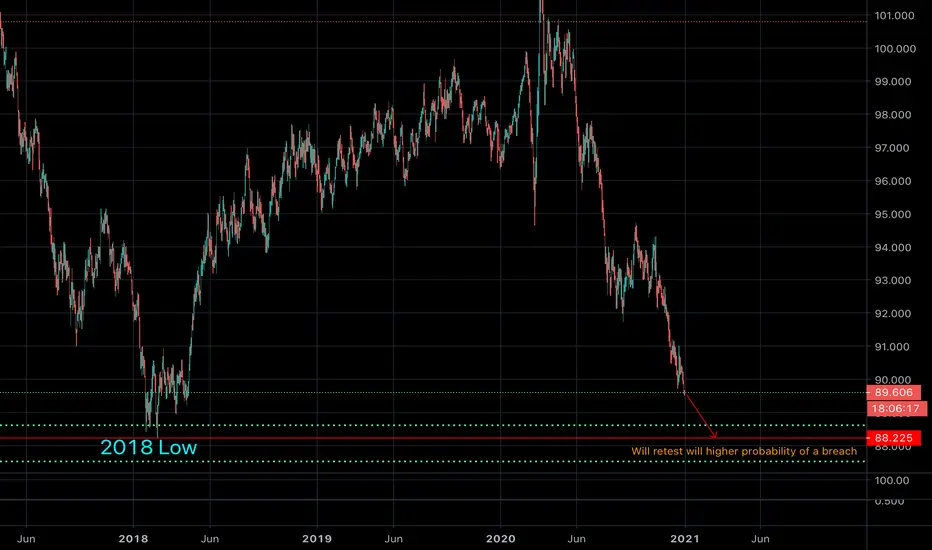
Twin Deficit forcing Psych levelsTwin deficit has resurfaced as a driving force towards DXY decline. At this point pairs are being controlled by psychological trend levels.
Presented is the DXY day chart. We can see a clear drop for a retest of the 2018 low which in contrast brings pairs such as NZDUSD, EURUSD, GBPUSD, etc to levels breached in Jan 2018.
A fundamentalist like myself begins to wonder if Twin Deficit sentiment is the ultimate driving factor for these psych occurrences taking place in 2018 and current. While COVID would be a logical main factor, ultimately any factor that would push double negative accounts.
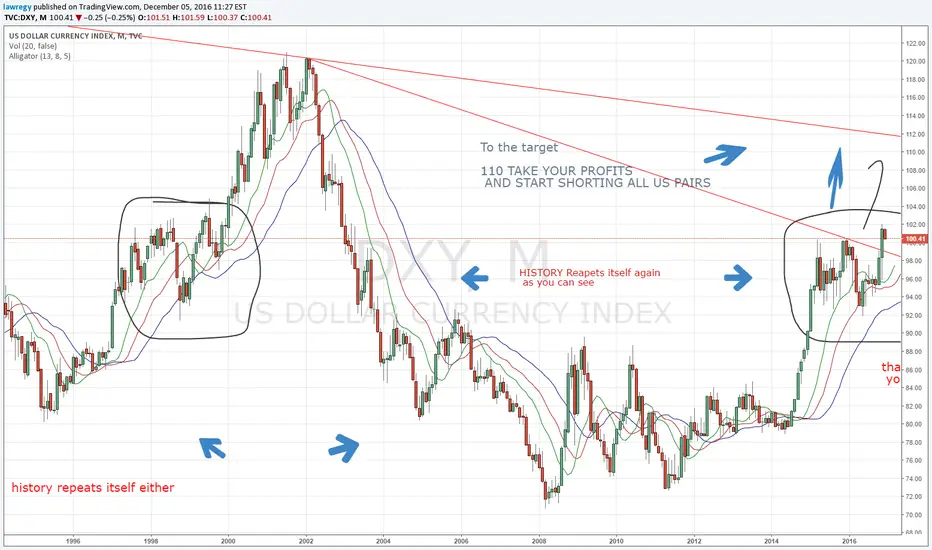
Attached is my previous DXY idea as well as my 2018 high retest idea of USD pairs I published over a month ago. Anyone patient enough to hold USD pairs have certainly played their cards well.
Expect a retest of 88.225 to match 2018 with a higher breach probability for a new low.
Please comment with any thoughts and Ideas. Thank you.
Usdpairs
Potential Reversal - EURUSDThe overall trend was upward and the trend was violated as you can see I've drawn the blue dotted line.
The current price has started making Lower-Highs (LH) . However, the there is no Lower-Low (LL) .
If you go into technical terms, Rising Wedge and Symmetrical Triangle is being formed

USDCAD LONGUSDCAD- If we look closely we can see that it rejects from the trend line. And we expect that in the next period to rise 200 pips. First around 1.31700 then around 1.33200. And if we look carefully we think that in this area it forms a W.


EURUSD has hit a glass ceiling - Short!EURUSD has hit a resistance that it recently tumbled down from. Expecting a downturn to 1.1043

USDCHF Rising This low could not get any lower... at least, not for now. The chart does depicts a lower high which could signal a downward trend once it breaks the firm support at 0.9604. But for now, this support is showing signs that it's holding firm which gives bottom pickers a buying opportunity to step in.

AUDUSD LONG for the Long TermAUDUSD faces a resistance at 0.6665 but is poised to break this level for further heights.
Between 0.6665 and 0.6664 are great buy in opportunities for the long ride.


Forex Divergence Watch: USD Pairs 20190419USDCAD: Resistance in 1D, Yellow, Range
USDAUD: Conflict Signals
Bullish Divergence (Blue) in 339m (5.6H), Support
Bearish Divergence (Yellow) in 4D-5D Resistance
USD Pairs being monitored:
USDAUD , USDCAD , USDCHF , USDGBP , USDJPY , USDEUR
Time Frame:
1H - 2D
DISCLAIMER
This is only a personal opinion and does NOT serve as investing advice NOR trading advice.
Please make their own decisions, carefully assess risks and be responsible for your own investing and trading activities.

Possible movements of Dollar In this chart i draw possible movements of dollar index. In the coming weeks the first move is down to 92 level.

USD/JPY AUg 2018 (A massive downside potential is spotted)This will be my views of USD/JPY (Aug 2018)
Please make sure to read the "update" comment as there will be changes along the way.
Cheers.
S0nic
Disclaimer:
The information contained in this presentation is solely for educational purposes and does not constitute investment advice. We may or We may not take the trade.
The risk of trading in securities markets can be substantial. You should carefully consider if engaging in such activity is suitable to your own financial situation.
We, Sonicr Mastery dot com is not responsible for any liabilities arising from the result of your market involvement or individual trade activities.
You should be aware of all the risks associated with foreign exchange trading, and seek advice from an independent financial advisor if you have any doubts.


USD/CNH Short IdeaUSD/CNH is showing signs of exhaustion after a bull rally which started in April 2018. Appearance of wick rejection at current high. On the day chart we see an evening star pattern, and a large bearish engulfing candle. Using fib and impulsive movement of price anticipate retracement to at least 50% or 61.8% fib level, which are key levels of this pair. Dollar is also weakening which is playing into this analysis. Placement of stop loss above previous high. Low risk to reward. Trade at your own risk. This idea is for demonstration and study purposes only.