USDRUB Market Structure Analysisif you have your market view, please share it in comments
Also, you can ask me questions and which you have in comments
Have a great day everyone!
USDRUB

Trade like a boss ;)I have 5 trade ideas. Just look at this movements.
At the end I will talk about the positions .
1. FX_IDC:EURUSD look at that. EURUSD disaster.
A little bit deeper.
What trend is it?
Deeper.
Waves...
So, we are somewhere in 3 in 3 in 3. This type of waves means a deep collapse with a very sharp structure.
And... I will take leveraged short position on EUR. Details at the end.
2. Another disaster. Welcom, BINANCE:BTCUSDT .
Without a doubt, we are in a global c wave. Below you can see my full Elliot Wave structure of global b, that I am so missing about...
Guess what? We finished this wonderful rally and future year will be boring and red.
Now we somewhere in c...
Bye, bye, brother ;(
So, another short, guys.
3. Honestly, do not like shorts. It will be better with some tasty longs in my bag. Look at that guy.
Did you see it? Amazing formation. Bet, it will be huge rally ;) And... Yes, it's time for disappearing correlation between BINANCE:ETHUSD and BINANCE:BTCUSDT . Crazy moment :)
Look at that one more time.
Looks nice. One more position in my bag.
4. This guy makes me sad. Just no comments.
Thanks for that opportunity Mr. ...
5. And only lucky ticket can make my bag absolutely ready for fly ;)
Huge volume spike, yes? Bottom is near or... Just lucky ticket, ok? ;)
Resume
My positions will be:
1. 5.35/10 of bank 3 leveraged short on EURUSD and 1 leveraged long USDRUB.
Entry points: 1.118-1.11/63-64
No stop loss.
Targets: 1.02/0.9/0.86 | 100/120/160
This positions go together because a short position on the EURUSD blocks negative USDRUB swaps.
2. 2/10 of bank 3 leveraged short on BTCUSD.
Entry points: now! 9550-9000 I hold 3 leveraged short from 10400 from my last idea.
No stop loss.
Targets: 8000/6000/4000/1000/600
3.1/10 of bank 2 leveraged long on ETHUSD.
Entry points: 185-175.
No stop loss.
Targets: 400+ and ATH later
4. 0.75/10 of bank on buy AMPBTC.
Entry points: 90-10.
No stop loss ;)
Targets: unlimited ;)
Thanks, good luck, guys ;)


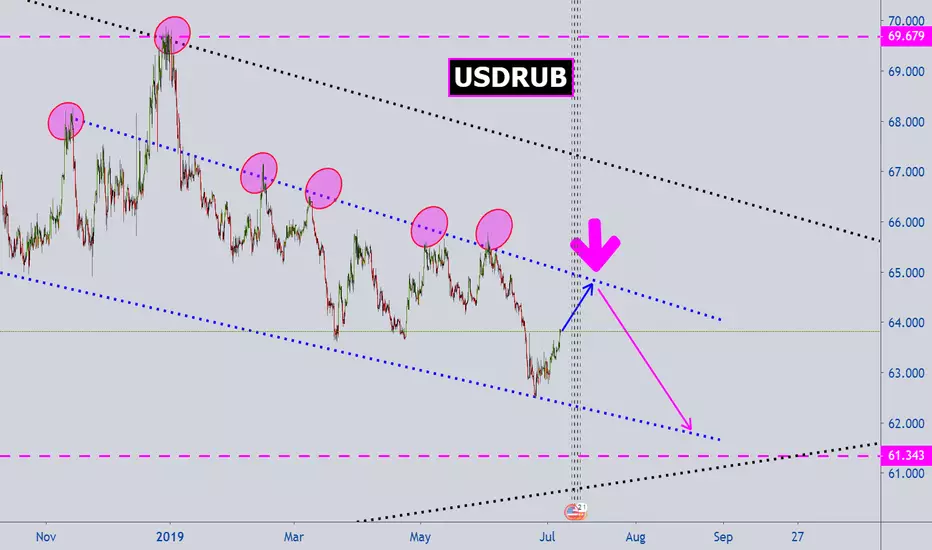
USD/RUB Bullish IdeaWe see a break in the trend movement in the initial cycle. This is the first reason to check demand. The second reason is the positional area of 63-61. In this area, we see weak downward movement and large shadows on the bars.
I will buy above 63 with targets up to 64.5-65.

USDRUBChart speaks it all. WAIT a rally to sell in reverse, IF U BUY now, make sure it is a small time frame and u enter and exit with MA cross. Better to wait the sell because it has more potential to fall than to rise.
#USDRUBThe price has reached a resistance level and should be expected to go ahead in the event of failure or returning to the orange range;
Time limit is specified;
The price is within the channel,


USDRUB - US vs Russia Currencies Quick long term idea on USDRUB pair. It is heading to $57 during second half of 2019. Maybe the move time frame will spill into beginning of 2020.

Long futures USDRUB, 1D, June, 4. Close position on June, 8.Trend analysis with ADX and oscillator analysis with MACD of the MOEX futures price on USDRUB indicates the position to buy the pair on June, 4 and close the position on June, 8. ADX analysis shows D+ (green) > D- (red) meaning the bullish trend supported by the MACD analysis, where MACD fast (blue) crossed MACD signal (orange) from below.
On June, 8, D+ (green) can cross D- (red) from above. The situation D+ < D- suggests selling the asset.
Also, MACD fast (blue) can cross MACD signal (orange) from above signalling the trend change.

USDRUB copies the earlier corrective structureI put the zigzag pattern based on earlier corrective structure and price goes with it since end of April.
Let's see what will happen next.

USD/RUB Strengthen of Russian RUB At the moment, the key factor determining the dynamics of the Russian currency is the inflow and outflow of money in Russian bonds. The current rubble appreciation is associated with a new influx of non-residents in GOV Bonds. Wave analysis of Eliot showed that at the moment we are drawing A to ABC (B is of a higher order), which means that the rubble will gradually strengthen. The correlation between RGBI and RUB / USD is more than 90%, making up a dependency model and substituting the potential values of the RUB / USD index, it received that the rubble could reach 61-62 rubbles per dollar. The fact that the wave in wave A 5 turned out to be stretched is indicated by the analysis of relations. According to Eliot, in the case of a stretched fifth wave, the motion ratio is (1 + 3) / 5 = either 1/1, or 0.618, or 1.618, in this case the ratio is a drop (1 + 3) wave = -4.6%, and a drop in 5 wave -7.6%, so 7.6 / 4.6 = 1.602, 4.6 / 7.6 = 0.605, which is close to the golden ratio.

USD/RUB 1D (Long)Hey
Read Carefully
Candle Will go down to the 1st Demand Zone.
DOWN) If the candle crosses the 1st demand zone , the candle goes down to the 2nd demand zone .
UP) If the candle crosses the 1st resistance, the candle will go Up
and if the candle touches the 1st demand zone , the candle will go to the 1st Resistance zone

Russian Ruble (USD/RUB) Sell limit 64.80 >>> 61.39Russian Ruble:
During breakdown of the first candle. growth is same size of candle. ( TD )
Current candle is big. So we size a little different.
Daily chart
Current = Trend is down
MN = time frame
We have a big candle (First candle (TD))
I'm waiting on daily chart 64.80 (RUB) and after that we have Low trade zone/support for fixing deal = Target is 61.39 (RUB)
---
Sell Limit = 64.80
Take Profit = 61.39
Stop Loss = 67.17
---
Profit = 5.26%
Risk = 3.66%


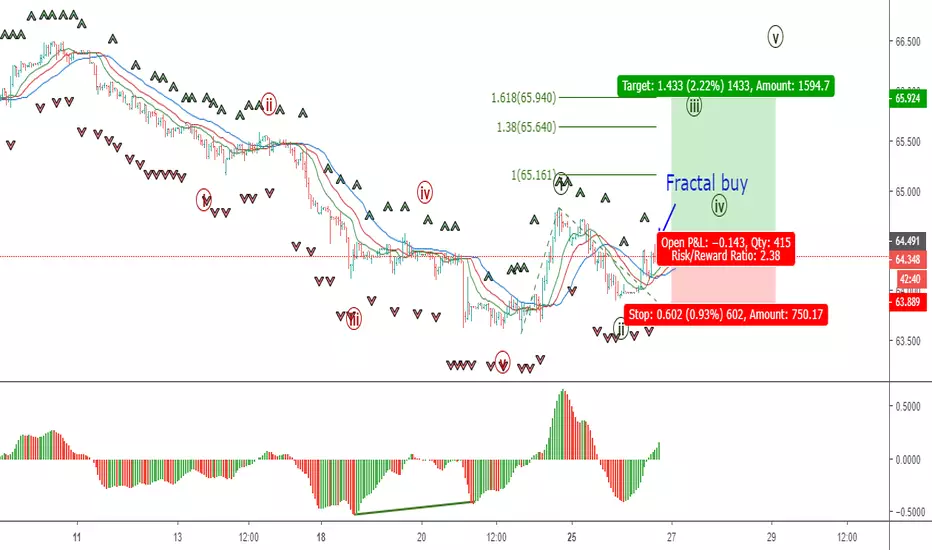
USDRUB: bullish signalThe price has formed a bullish fractal level on the hourly chart of the USDRUB. In my opinion, the instrument is starting a new bullish Elliott wave cycle, more precisely in the wave 3.
classic ichimoku sell Ichimoku sell conditions
o Tenkan-sen is below Kijun-sen
o rejection at resistance or kijun-sen
o Selling pressure is strong now
and expected to weaken in the future
o the1%


USDRUB bullish return after bottomAfter testing strong support of 63.6, bullish trend is being restored. RUB got strong enough to test 63.6 support because of a set of factors - tax period for Russian companies, good economics reports of Russian Central Bank, as well as S&P drop and sanctions temporary put on hold by US government.
Return to 65.5 resistance.

Second stage of EM rally?After previously tracking the reversal (see attached: "Another key reversal in play in USDRUB") finally the break of 65 has come. From a technical standpoint this was important as it unlocked the 62.5 lows.
Russia has been one of the out performers on the currency board so far this year and I continue to see scope for more gains, irrespective of the very near term reversal in dollar.
The risk here to the setup is coming from sanctions related risk. Russian authorities have been quick to take measures to insulate the economy (reaction to DASKAA bill).
Best of luck all those trading EM and thanks for keeping the likes and comments rolling
