USD/RUB Long IdeaUSD/RUB possible teacup formation. Using the Fibonacci tool , there is a marked confluence at a key price level. Note confluence of 61.8% and 50% fib levels on two major swing points at 62.8-63 price area (also highlighted in yellow). If price pulls back to this key level I would anticipate price to make a bull run and extend beyond brim of teacup. This trade is for demonstration and educational purposes only.
USDRUB

USD/RUB 1H Chart: Falling wedge in sightThe Russian Ruble has been appreciating against the US Dollar after the currency pair reversed from the resistance level formed by the monthly PP at 67.17. This movement has been bounded in a falling wedge.
As apparent on the chart, a breakout from the pattern should occur in the nearest future. From a theoretical point of view, the exchange rate should break given wedge north and surge towards the 66.40/66.80 range.
However, technical indicators suggest that expected advance might not be immediate, and the pair could decline to the psychological level at 65.20.

EW ANALYSIS: Long-term And Short-term View On Russian RubleHello traders!
Today we will talk about pretty clear Russian Ruble. From a technical perspective, we see very interesting price action and wave structure based on Elliott Wave theory.
Let's start with Weekly chart:
In EW theory, after every five waves, a three-wave correction follows and as you can see, USDRUB is turning down after five waves up. So, we can expect at least three waves A-B-C of decline where wave C is still missing, which means that strong Russian Ruble can be coming in the next few weeks/months.
Daily chart:
Looking at the daily chart we can see an impulsive five-wave rally within wave (C) of B, so seems like USDRUB has completed a flat correction and found a resistance at 70.65 level, especially because of a current sharp and impulsive decline into wave A/1 away from highs. So, what we expect now is minimum three waves of decline at least back to 61.61 area, A/1 - B/2 - C/3.
Intra-day hourly chart:
At the hourly chart, we can see a very nice bounce away from A/1 lows with five waves up and three waves of pullback, which means that wave B/2 can be underway and should be made by three waves a-b-c, where wave c is still missing and can be reached around ideal 61,8% Fibonacci retracement and 68 area.
However, we want to say that Russian Ruble can be strong in the upcoming year, so we decided to share our view, just keep in mind that this may become more complex, so as long as it's trading below 70.65 invalidation level, we will remain bearish!
Disclosure: Please be informed that information we provide is NOT a trading recommendation or investment advice. All of our work is for educational purposes only.

Buying USDRUBOn the hourly chart, there was a trend change in the bullish impulse of wave A(1) with correction in 2(B) wave. Currently the is instrument is above the Alligator indicator with AO above the zero line. Buying if the price breaks the latest fractal with target at C wave.

Both targets hit. Expecting to rebound within the 1W Channel Up.Both 69.000 and 66.000 got hit as USDRUB first rose and the pulled back within the 1W Channel Up (RSI = 59.930, MACD = 1.888) to price a Higher Low at 64.900 (Highs/Lows = 0.0380). The next Higher High should be near 74.000, so our long TP is a little lower at 73.000.


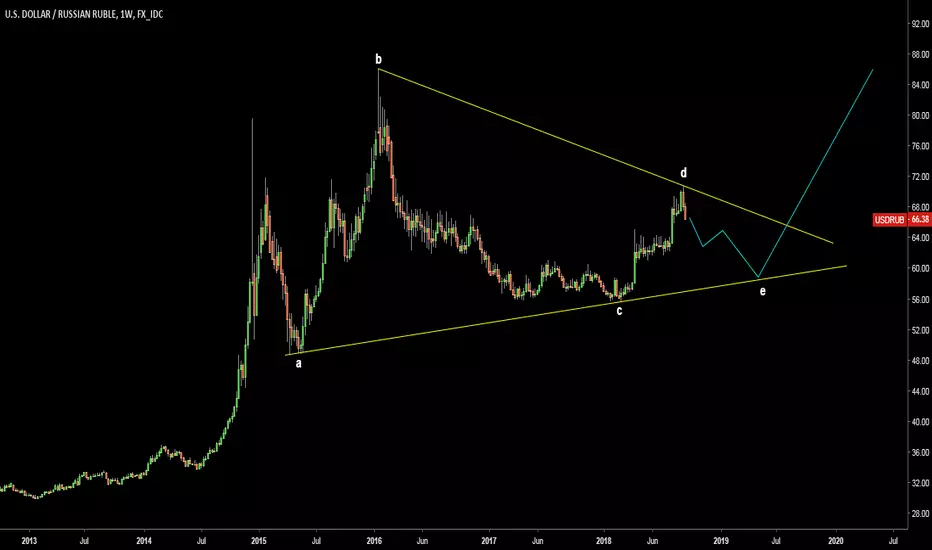
USDRUB. Possible map for large consolidation. TriangleThis idea correlates with my earlier EEM idea (related).

Another key reversal in play in USDRUB=> Very similar to the USDINR idea we posted, there is significant bearish divergence and the downside is unlocked for some testing.
=> Here we are playing into the 66.0988 and 65.0446 levels before anything else.
=> This is a corrective play across EM currencies, nothing more, nothing less.


4h short-term trade USD/RUBA simple trade showing both MACD change and market bottom indicator flashing. After bouncing off the fib level, this trade has a low risk and high reward considering the timeframe of approximately 3-5 days.

USD/RUB 1H Chart: Short-term channel in sightThe Russian Ruble has been depreciating against the US Dollar since early August under the pressure from new the US sanctions.
At the time of this analysis, the exchange rate had reached the lower boundary of a short-term ascending channel near 67.20. It is very likely that an upside momentum starts prevailing in the nearest future as the 55-period SMA (4H) push the rate up.
Technical indicators on the 4H and 1D time-framers support this bullish scenario. The nearest target for the exchange rate is the 68.00/50 area.

Defining the Carry TradeSuppose that the deposit interest rate in the US stands at 1.5% and the interest rate in Europe stands at 0%. Let's also assume that the EURUSD rate is at 1.10 and that we do not expect it to move in the next year. Investors, aware of this situation would be willing to borrow from Europe deposit in the US, benefiting from the interest rate differential, and ensure a 1.5% risk-free return. This investment, where money is "carried" to another location (physically until mid-20th century), is called the carry trade.
While the carry trade appears to be very simple, many dangers lie in its application. Remember that our second and most crucial assumption was that the exchange rate would not move. Nonetheless, exchange rates seldom remain stable. In fact, the inflow of capital - deposits in our example - is what actually makes the exchange rate move. This is why, in an earlier post , we have already specified that a change in interest rates can be suggestive of the future movement of the exchange rate.
In order for the trade to be successful, the EURUSD rate must not depreciate to an extent after which profits will be eaten out. Suppose that an investor wishes to borrow EUR1 mln and carry it to the US. Thus, he would be depositing USD1.1 mln in the US with hopes of getting back USD 1.1165 mln one year from now. If the exchange rate remains at 1.10, then the investor would transform the money to EUR1.015, repay the loan and enjoy a EUR15,000 profit. Nonetheless, if the exchange rate moves to 1.11, then the investor's profit is reduced to just EUR 5,000 after the loan is repaid. As you can imagine, the Dollar profit turns into a Euro loss if the exchange rate moves to 1.12. As you may have guessed, in order for the trade to be profitable, the exchange rate should not move by more than the exchange rate differential, which is not what the Inverse Fisher effect suggests.
As such, for the carry trade to be successful, there needs to be substantial room for error. As such, a large interest rate differential is required. Further to this, traders need to find a currency pair in which the currency with the highest interest rate is not expected to depreciate by much.
Is the carry trade an easy trade to find? Of course not. But it is possible. In 2016, the Russian interest rate stood at 11%, while the respective interest rate in the US stood at 0.5% and remained at that point until December . This would imply an interest rate differential of approximately 10.5% for the year. The USDRUB exchange rate stood at 72.91 on January 4, 2016 and ended up at 60.68 on December 29, 2016. Suppose now that an investor borrowed USD 1 mln, exchanged it for RUB 72.91 mln and invested it in Russia. By the end of the year, the investor would have gained 11% on his RUB investment, at a value of RUB 80.93 mln. Exchanging it back to USD at the 60.68 rate would mean that the trade would have ended with a value of USD 1.334 mln, which after deducting the USD 1.005 mln, would leave the trader with approximately USD 330,000, or a 33% return on investment.
Hence, while carry trade opportunities are rare, they can be present if good and careful research is made. However, it should be remembered that carry trades are high-risk strategies and thus proper risk management strategies should be used.
Disclaimer: This material is provided as a general marketing communication for information purposes only and does not constitute an independent investment research. Nothing in this communication contains, or should be considered as containing, an investment advice or an investment recommendation or a solicitation for the purpose of buying or selling of any financial instrument. All information provided is gathered from reputable sources and any information containing an indication of past performance is not a guarantee or reliable indicator of future performance. Users acknowledge that any investment in FX and CFDs products is characterized by a certain degree of uncertainty and that any investment of this nature involves a high level of risk for which the users are solely responsible and liable. We assume no liability for any loss arising from any investment made based on the information provided in this communication. This communication must not be reproduced or further distributed without our prior written permission.

USDRUB Bear Market ScenarioTA is suggesting that USDRUB will complete a countertrend rally up to 70 USDRUB. Most likely, the correction will resume to at least 61. 56 is also a probable target. There is also a possibility that we will go to the 10 year MA at 47.
If we stay above 71 for a few weeks, a new study needs to be made.

Ruble falling to 71USDRUB price is moving around important support/resistance area ~37.35. If goes through next resistance will be at 67.80. And I don't think it will hold so target is 71 rubles per one USD. That will be the top - good zone for shortening although a small chance of price flying like a rocket towards 73 is also real. Keep in mind the cold war is only in the very beginning.


USDRUB targets 71 The pair is in the possible triangular consolidation.
The spike higher is expected to hit 71 area

Possible pattern recurrence. Neutral.USDRUB has broken the previous Rectangle on 1D to the upside (RSI = 67.004, MACD = 1.132, Highs/Lows = 1.0010, B/BP = 2.0066). However the currently High Volatility on 1D (ATR = 0.9168) as well as the overbought action on 1W (RSI = 73.797, STOCHRSI = 76.158, Williams = -15.552, CCI = 219.8375) indicate that the pair may enter another consolidation phase/ Rectangle. That is a scalping opportunity with (due to the 1W Channel Up) a bullish primary sentiment (dip buying).

USDRUB - Remain Long USD RUB - Remain long, Consolidation is continuing to suggest strength in USD against the Ruble. This is on concert with other USD pairs such as the Lira.

USDRUB reached a 16 month high..what's next?Last night USDRUB struggled to continue after reaching a 16-month high.
This was an excellent opportunity for traders to short it.


Russian ruble: causes of the fall and prospectsOver the past few days, the Russian ruble has lost about 10%. In a natural way, this attracted considerable interest to it. So, we need to talk about the current and medium-term prospects of the ruble.
The current decline in the Russian currency is the result of a few factors. Both internal and external ones. Let's list the key theses and give some explanations on them.
External causes of the ruble fall.
1. The news about a new sanction package from the USA.
This is a US-announced package of sanctions affecting Russia's sovereign debt and state-owned banks. The package has not yet been formally adopted, nevertheless this factor provoked the emergence of a panic wave in the foreign exchange market. But this is not the only external problem of Russia, the Russian economy and the ruble.
2. Trump Trading Wars and devaluation as a way of self-defense.
Trump unleashed a global trade war in the US against the rest of the world format. The main weapon of Trump is protectionist tariff barriers. Significantly increasing import tariffs, the US makes its domestic producers more competitive. As a protection tool, the affected countries use the devaluation of the national currency. Chinese yuan, Indian rupee, Turkish lira and other currencies of emerging countries have lost 10% and more recently. Even developed countries such as the EU, Canada, Australia have significantly weakened their currencies.
3. Oil seems to have peaked.
The actual abandonment of OPEC + and the start of a new race to increase oil production puts an end to the hopes for oil prices growth in the future. Given that even with the current maximum values of oil quotations over the last couple of years, Russia's budget is literally bursting at the seams, it's even frightening to imagine what will happen to it if prices of "black" gold drop to the area of $30-40 per barrel (more than even in the foreseeable future).
4. Political isolation of Russia
Politics is a concentrated expression of the economy. Russia's actions in Ukraine, Syria, interference in the elections in the United States, the case of the Scrypal in the UK, etc., shape Russia around the image of a rogue country, which has a negative impact on the country's economy.
Internal causes of the fall of the ruble
1. Unpopular reforms as an indicator of problems in the economy.
This is primarily about the budget deficit. To combat it, a few rather painful reforms are proposed, ranging from raising the retirement age to the growth of VAT. Most painful was precisely the issue of raising the retirement age, since the Russian authorities inherently sacred the term "stability", elevating it to the Absolute. And now they refuse it, and in the worst part. Obviously, it is vital to go for such unpopular measures, that is, all other options for solving the problem have already been exhausted.
In addition, these reforms are clearly not the last in the list. Incoming the increasing of the tax burden on companies and others.
All these in aggregate worsen the already weak investment climate in the country.
2. Inadequate structure of the economy.
Russia is often called a gas-station country, hinting at its total dependence on hydrocarbon exports. Strategically, such a structure looks very vulnerable, especially against the backdrop of a shale oil and gas sector and alternative energy technologies (already now, the increase in energy capacity in the US is not due to the increase in hydrocarbon consumption, but from alternative energy sources).
That is, the current structure of the Russian economy is, at best, the last century, while to remain competitive, the economy must compete in the high-tech sphere, which is not in sight.
That is, in the long term, the gap between the developed countries and Russia will increase. And the resource rent, due to which the economy is now living, is a dead-end path of development.
If we add to this the growth of the state's share in the economy (the last signal is the purchase of the retail giant Magnit by the state-owned VTB), the vector of development or, more correctly, the degradation of the Russian economy becomes evident.
3. Inefficient infrastructure projects.
To stimulate economic activity, government funds are very actively invested in various mega-infrastructure projects such as the Olympic Games in Sochi, the World Football Cup, the construction of the Crimean Bridge, etc. The medium- and long-term economic effect of such projects is extremely doubtful, but the expenses are simply gigantic, especially for a country that is in acute shortage of financial resources. Well, talking about the launch of a new mega-project of building a bridge to Sakhalin with a value of 500 billion rubles only confirms our previous conclusions.
4. Problematic banking and other sectors of Russia
The process of "cleaning" (if mass bankruptcy of banks in Russia can be called so) of the banking system continues. All this happens against the backdrop of the growth of bad debts in the credit portfolio of banks.
In this light, it is also worth noting the wave of bankruptcies among touristic companies, mass cuts in several industrial enterprises-giants in Russia etc.
So, here and now the ruble looks vulnerable because of the panic wave associated with the news of sanctions. In the medium term, the weak Russian economy and unpopular reforms that reduce economic activity, as well as the potential decline in oil prices, will put pressure on the ruble. In the long term, an inefficient corrupted economy coupled with a dubious vector of its development creates the prerequisites for further lagging behind the Russian economy from developed countries, which will also have a negative impact on the ruble.
Total, on all time horizons analyzed, the ruble looks vulnerable, so any growth of it should be used for sales.

USDRUB: bullish flagBreakout of the upper line of the pattern could start the new Elliott wave cycle.
