Michigan consumer sentiment will shock us all In 6 days we have a major update to come and technically speaking we have what i call a sandwich panel set up in which a bearish candle is stocked in between 2 bullish ones now once the said second bullish candle close exceeds the high of the said bearish lone candle we can count on a perfect trend reversal .
USDSGD

Long USDSGDIt appears that USDSGD may be setting up for a multi-day bull run.
Last week USDSGD posted a green weekly Heiken Ashi candle and I suspect it may do it again.
It is also the case that USDSGD posted a green daily Heiken Ashi candle after multiple red Heiken Ashi candles on the daily.
This signals to me that we may be in for a bull run this week.

Technical Analysis: USDSGD Forex Pair 📈 #ForexAnalysis #USDSGD #ShortPosition #BearishPressure 📉
🔍 Technical Analysis: USDSGD Forex Pair 🔍
Hey traders! 📊 Today, let's take a closer look at the US Dollar/Singapore Dollar (USDSGD) Forex pair and explore some interesting insights that could potentially guide our trading decisions. 🤝
📉 Price Action and Trend Observation:
The USDSGD pair has recently experienced a significant event - the breaking of its support levels from January 4th, 2021. 📅 This bearish move suggests a potential shift in the trend, indicating a possible downward direction.
💔 Broken Flag Support:
As of now, the price is testing the broken flag support, which could act as a resistance level. 🚧 This retest offers traders an opportunity to take advantage of the bearish momentum in the market.
🐻 Too Much Bearish Pressure:
The prevailing bearish sentiment is evident, and it appears that there is substantial bearish pressure that may deter any immediate bullish comeback. 📉 The sellers seem to be waiting eagerly to add to their positions if the price attempts to rally, which might act as a barrier to any upward movement.
📉 Short Position Strategy:
Given the bearish environment, I have just opened a short position in the USDSGD pair. If the price happens to rally, I'm prepared to add another short position to capitalize on potential further downside. 💼 However, it is essential to stay cautious and manage risk appropriately, considering the volatile nature of the Forex market.
⏳ Time Frame and Potential Scenario:
This analysis is based on a 1-week time frame, suggesting that the anticipated downward move may take a few more days to unfold. But keep in mind, when the price falls, it often does so rapidly, offering excellent trading opportunities for short-term gains.
Remember, successful trading involves a combination of analysis, risk management, and discipline. 🚀 Always use proper risk-to-reward ratios and employ stop-loss orders to protect your capital.
#ForexTrading #TradingOpportunities #TechnicalAnalysis #ShortingOpportunity #TradeSmart #RiskManagement #USDSGDAnalysis
Disclaimer: This analysis is for informational purposes only and should not be considered as financial advice. Trading Forex involves substantial risk, and traders should exercise caution and conduct their research before making any trading decisions. Always do your due diligence and consult with a qualified financial advisor if needed. Happy trading! 📈📉

Usdsgd watching for pullbacks to short
**Find out more from my Tradingview Stream this week**
***************************************************************************************
Hello there!
If you like my analysis and it helped you ,do give me a thumbs ups on tradingview! 🙏
And if you would like to show further support for me, you can gift me some coins on tradingview! 😁
Thank you!
Disclaimers:
The analysis shared through this channel are purely for educational and entertainment purposes only. They are by no means professional advice for individual/s to enter trades for investment or trading purposes.
The author/producer of these content shall not and will not be responsible for any form of financial/physical/assets losses incurred from trades executed from the derived conclusion of the individual from these content shared.
Thank you, and please do your due diligence before any putting on any trades!

USDSGD ____ INCOMING BULLISH RALLYHello Guys,
As I had previously published, the dollar index seems to be setting up for a bullish rally (analysis inserted below) and USDSGD which is correlated with the dollar index is aligning accordingly.
You will also notice that the price has buy-side liquidity to hunt. I have set an alert to know when price trades into the daily order block from which I will be looking out for a CHOCH on the 1-hour timeframe to go long.
Also, USDCHF is aligning for this long (analysis inserted below)
Follow me for more updates.
US DOLLAR INDEX ANALYSIS
USDCHF ANALYSIS
Cheers,
Jabari

AUD/USD, USD/SGD, EUR/CAD and USD/CAD on watch for me today.AUD/USD:
• If price pushes down to and ideally just below the lower descending trend line of our most recent piece of structure, then regardless of how it does so I'll be waiting for a convincing impulse back up followed by a tight flag and then I'll be looking to get long with a reduced risk entry on the break of the flag.
• If price simply impulses back up above our rayline, it does so in a convincing manner and a subsequent tight flag forms, then I'll again be looking to get short with a reduced risk entry on the break of the flag.
• If neither of these setups present themselves then I will simply wait until another setup which meets my plan materialises.
• If there's any ambiguity then I will not place either of these trades.
USD/SGD:
• If price pushes up to and ideally just above our rayline, then regardless of how it does so I'll be waiting for a convincing impulse back down followed by a tight flag and then I'll be looking to get short with a reduced risk entry on the break of the flag.
• If this setup doesn't present itself then I will simply wait until another setup which meets my plan materialises.
• If there's any ambiguity then I will not place this trade.
EUR/CAD:
• If price pushes up to and ideally just above our rayline, then regardless of how it does so I'll be waiting for a convincing impulse back down followed by a tight flag and then I'll be looking to get short with a reduced risk entry on the break of the flag.
• If price simply impulses back down, it does so in a convincing manner and a subsequent tight one hour flag forms, then I'll again be looking to get short with a reduced risk entry on the break of the flag.
• If neither of these setups present themselves then I will simply wait until another setup which meets my plan materialises.
• If there's any ambiguity then I will not place either of these trades.
USD/CAD:
• If price impulses down below our rayline and it does so in a convincing manner, then I'll be looking to get short with a reduced risk entry on the break of a subsequent tight flag.
• If this setup doesn't present itself then I will simply wait until another setup which meets my plan materialises.
• If there's any ambiguity then I will not place this trade.

USDSGD ____ INCOMING BULLISH MOVEHey Guys,
USDSGD hunted sell-side liquidity last week Thursday & Friday and also traded into the weekly FVG. From the weekly FVG, I speculate that the price will rally to hunt the buy-side liquidity and head into the daily FVG.
However, I expect that price will try again to go lower at the beginning of the week and start the bullish rally.
Also, as a confluence, the dollar index is also getting ready for the bullish rally (see below my analysis on DXY)
Follow for more updates.
Feel free to DM me.
See my Dollar Index analysis
Other USD-related pairs
GBPUSD
NZDUSD
USDJPY
Cheers,
Jabari

USDSGD Triangle break-out. Buy signal.Last time we looked at the USDSGD pair (October 11 2022) we gave the best sell signal possible (see idea below) as the price entered the 6 year Resistance Zone:
This time we have a buy signal flashing as the price not only broke above the Triangle pattern on the 1D time-frame but also above the 1D MA50 (blue trend-line). As long as Support 1 holds, we are bullish targeting 1.35500. If Support 1 breaks (1.32050), we will book the loss and open a sell, targeting 1.30550.
-------------------------------------------------------------------------------
** Please LIKE 👍, FOLLOW ✅, SHARE 🙌 and COMMENT ✍ if you enjoy this idea! Also share your ideas and charts in the comments section below! **
-------------------------------------------------------------------------------
💸💸💸💸💸💸
👇 👇 👇 👇 👇 👇

USDSGD _____ UPCOMING BULLISH MOVEHello Traders,
If you are following me, you would know by now that I have a bullish bias on USD. This bias is based on my analysis of the Dollar Index. However, USDSGD just entered a key demand level and I am waiting for CHOCH for me to go long on this pair.
I have also done an analysis on GBPUSD and it is currently playing out as speculated. (see below)
Also, see my analysis of the dollar index below.
What do you think? is there something you think I might have missed or you agree with me?
Let me know your thoughts.
Cheers,
David

USDSGD Reaching a key level to watch**Find out more from my Tradingview Stream this week**
***************************************************************************************
Hello there!
If you like my analysis and it helped you ,do give me a thumbs ups on tradingview! 🙏
And if you would like to show further support for me, you can gift me some coins on tradingview! 😁
Thank you!
Disclaimers:
The analysis shared through this channel are purely for educational and entertainment purposes only. They are by no means professional advice for individual/s to enter trades for investment or trading purposes.
The author/producer of these content shall not and will not be responsible for any form of financial/physical/assets losses incurred from trades executed from the derived conclusion of the individual from these content shared.
Thank you, and please do your due diligence before any putting on any trades!

USD/SGD - SellLike to buy USD against SGD at 1.33180 where stop loss at 1.33510 and profit target around 3:1

usdsgd a down trend It is down on the daily and h4 timeframe..just look for setup to go short.
Hello there!
If you like my analysis and it helped you ,do give me a thumbs ups on tradingview! 🙏
And if you would like to show further support for me, you can gift me some coins on tradingview! 😁
Thank you!
Disclaimers:
The analysis shared through this channel are purely for educational and entertainment purposes only. They are by no means professional advice for individual/s to enter trades for investment or trading purposes.
The author/producer of these content shall not and will not be responsible for any form of financial/physical/assets losses incurred from trades executed from the derived conclusion of the individual from these content shared.
Thank you, and please do your due diligence before any putting on any trades!

EURSGDEURSGD - Break out...Coming soon!
EURSGD - Technically it's brewing for break out to either direction. We are currently within the ranges of Highs: 1.44965 Lows: 1.41187
If we are to break the lows, expect the recently low areas of 1.37625 to be target areas.
If we are to break the hight, expect the the two key resistance areas to be tested and to be target areas 1. 1.47285 & 2. 1.49660
I have even enjoyed trading the USDSGD - very clean set ups!
Have a great week ahead,
Trade Journal

USDSGD - Potential Cup and Handle FailureNon- impulsive move up. IMO, price already triggered a potential failure.
Target 1.32.

USDSGD Trading The Corrective CycleIn this update we review the recent price action in the USDSGD and identify the next high probability trading opportunity and price objectives to target

USDSGD HOT PROJECTIONThis market is in a current dominant downtrend. Price action dictates an exhaustion in the short-lived uptrend correction and a continuation of the downtrend. The daily trendline aligns with the current price and the short trendline drawn using the 4hr and 1hr timeframe signifies a possible entry for a lengthy downtrend continuation for the week.

USDSGD - Long from HTF support zonePotential Power of 3 reversal trade.
This is only the first touch of support zone and price could still go lower even if this pattern plays out.
Good luck.

USDSGD BUY Signal Supply And DemandHigher Timeframe Analysis:
-Price low on the sideways range
-Price sitting inside demand/support
Look for buys with confirmation on lower timeframe:
-Price broke daily/4hr downward trend lines
-Price removed opposing supply zones
-DBR daily demand created
-Wait for pullback and either trading whole zone or use the daily/4hr demand zones as the HTF and wait for new LTF 5min/15min/1hr timeframes for entries.

USDSGD Possible drop to support levelUSDSGD Possible drop to support level.
Logic behind analysis :
1. Long term downtrend
2. Daily Bearish engulfer
3. 4H Head & shoulder on resistance with liquidity grab
Summary : A sell trade is high probable as per chart analysis.
Press the link button if you enjoy this analysis.

USDSGD Engulfing Candlestick | Entry Price 1.34566Bullish Engulfing Candle formed at Support Level. Enter a long position.

USDSGD, long position, H4 intervalI expect a breakout of the designated resistance and an upward move.
The green last weekly candle also indicates future growth (I think).
TP around 1.3750
GG
P.S. This is not financial advice of course, just my idea.

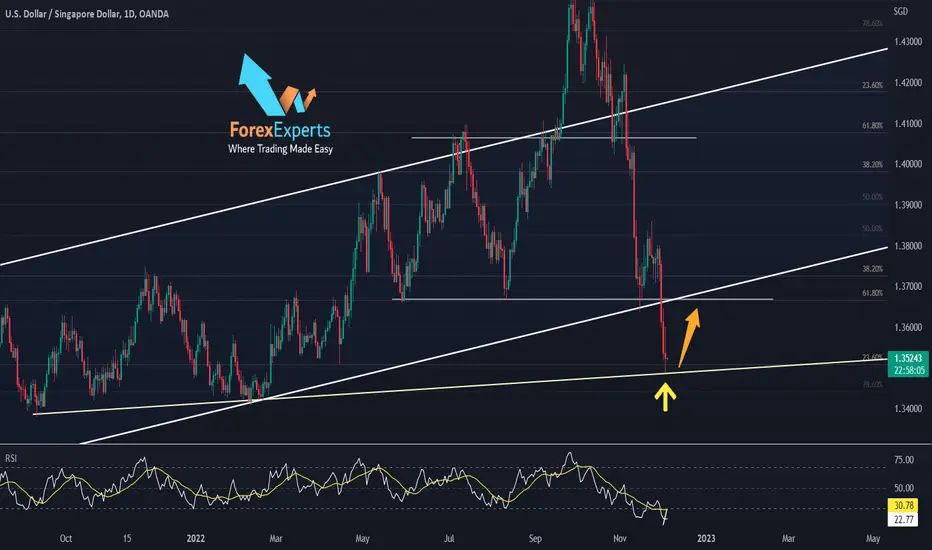
USDSGD coming back for a retestAfter USDSGD has escaped the ascending channel and the head and shoulders pattern, it is now touching an ascending trend line starting back from Sept 21 and touched again on Feb 22, also touching a 23.6 fib level,
currently looking to retest the previous support (neckline) and a 61.8 fib, which is now resistance @1.366, and also the lower channel line. Which was broken earlier.
in a 1-hour time frame appears to print a divergence on the RSI indicator, which indicates that we might have a change in the direction
--------------------------------
Feel free to share your thoughts in the comments, and kindly support the idea with a like. Your support is greatly appreciated!