Don’t Panic — It’s Just a Healthy Crypto Correction!While the crypto market has seen some red this week, the bigger picture remains intact. Let’s zoom out and make sense of the current correction.
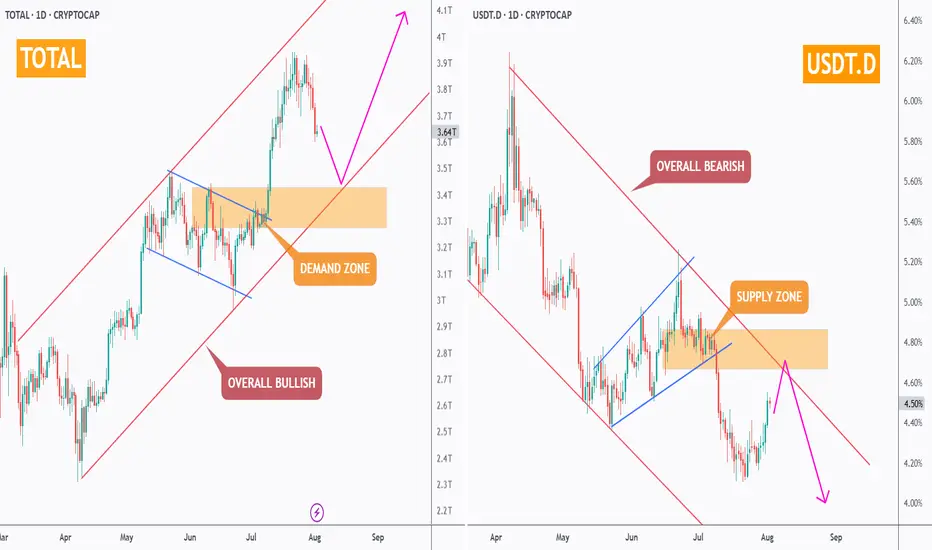
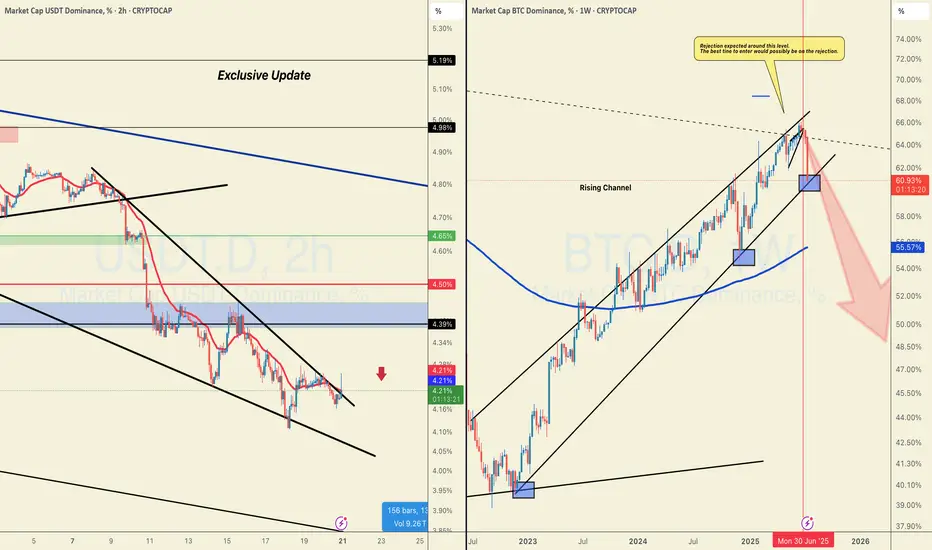
🔸 TOTAL Market Cap (left chart)
The structure remains overall bullish, trading inside the red rising channel.
After a solid rally, the market is currently pulling back toward a strong demand zone – perfectly aligned with the lower trendline. This area is likely to act as a major support, from which the next bullish impulse could kick off.
🔸 USDT Dominance (right chart)
USDT.D remains overall bearish, trading inside the red falling channel.
It’s currently pushing higher toward a well-defined supply zone, which also intersects with the upper red trendline. As long as this area holds, we expect sellers to take over again — giving altcoins the space they need to bounce back.
📌 In simple terms:
The market is in a healthy correction. Don’t let short-term dips shake your long-term view. The trend is still your friend.
➡️ As always, speak with your financial advisor and do your own research before making any investment decisions.
📚 Always follow your trading plan => including entry, risk management, and trade execution.
Good luck!
All strategies are good, if managed properly.
~ Richard Nasr
USDT-D
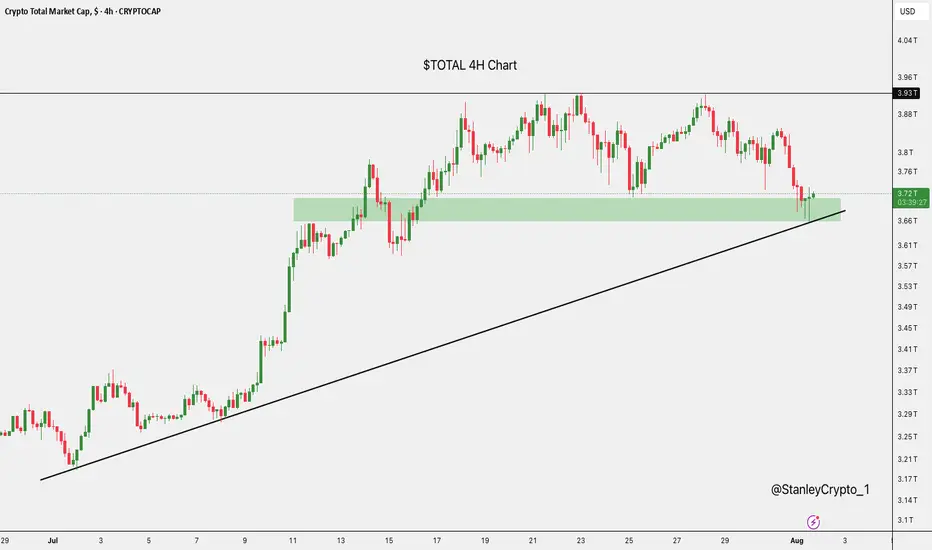
$TOTAL at Key SupportThe crypto market cap has just bounced off a strong support zone around $3.67T, right where it aligns with the rising trendline.
This area has held firm before, and it's doing the same now.
If it continues to hold, we could see a nice recovery.
But if it breaks down, there’s a risk of more downside ahead.
Tether Rakes in $4.9B Q2 Profit, Cementing Its Reign as Crypto’sTether Q2 Net Profit Hits $4.9 Billion, Pushing Total Earnings to $5.7 Billion: What It Means for the Crypto Industry
Tether Holdings Ltd., the issuer of the world’s largest stablecoin USDT, has once again made headlines with its Q2 2025 earnings report, revealing a staggering net profit of $4.96 billion. This brings the company’s total profits for the first half of the year to $5.7 billion—a record-breaking milestone for both the company and the broader stablecoin ecosystem.
This article explores the implications of Tether’s Q2 performance, the sources of its revenue, its impact on the crypto markets, and the growing significance of stablecoins in the evolving financial landscape.
________________________________________
A Record-Setting Quarter for Tether
Tether’s Q2 2025 results have astonished even seasoned analysts. The company’s reported $4.96 billion in net profit in a single quarter represents one of the most profitable periods in the history of any fintech or crypto-native company. What’s even more remarkable is that this profit was not driven by speculative trading or token sales, but by conservative, yield-generating strategies rooted in traditional finance.
The company’s Q1 earnings were already impressive at $0.76 billion, but Q2’s results eclipse those numbers entirely. Tether’s cumulative profit year-to-date now stands at $5.72 billion, putting it on track to potentially exceed $10 billion in earnings for the full year if current trends continue.
________________________________________
What’s Driving Tether’s Massive Profit?
Tether’s incredible profitability is primarily fueled by one key factor: the interest earned on its reserves. As the issuer of USDT, Tether is responsible for maintaining a 1:1 backing of every token in circulation. These reserves are primarily held in short-term U.S. Treasury Bills (T-Bills), reverse repos, and cash equivalents.
Here’s a breakdown of the main profit drivers:
1. High Interest Rates on U.S. Treasuries
With the U.S. Federal Reserve maintaining elevated interest rates to combat inflation, short-term T-Bills have become highly lucrative. Tether holds tens of billions of dollars in these instruments, generating billions in annual interest income.
For example, the yield on a 3-month Treasury bill in Q2 2025 averaged around 5.2%, and Tether’s reserve base has hovered near $90 billion to $100 billion. Even a conservative allocation can earn several billion dollars in annual yield.
2. Reverse Repurchase Agreements (Reverse Repos)
Tether has also expanded its use of reverse repos, which allow it to lend cash to counterparties in exchange for securities, earning a premium on the transaction. This has contributed significantly to its earnings, especially in a high-yield environment.
3. Gold Holdings and Bitcoin Exposure
Tether has acknowledged that a small portion of its reserves includes gold and Bitcoin holdings. These assets appreciated in Q2, contributing to the overall profit. While not the primary revenue source, their performance added notable value during the quarter.
4. Equity Investments
The company has begun investing in infrastructure and technology firms related to blockchain and AI. While these investments are not liquid, mark-to-market gains may have also contributed to the net profit figure.
________________________________________
A Closer Look at Tether’s Reserve Report
Tether’s Q2 attestation report, published alongside its earnings update, provides transparency into how its assets are allocated. Here are some highlights:
• Over 85% of reserves are held in U.S. Treasury instruments
• $5.4 billion in excess reserves—a buffer above the value of circulating USDT
• $3.3 billion in gold and Bitcoin holdings
• Minimal exposure to unsecured commercial paper or riskier debt instruments
Tether has continuously emphasized its commitment to transparency and risk management. Unlike in its early years, when it faced criticism over opaque reserve practices, the company now releases quarterly attestations audited by third-party firms such as BDO Italia.
________________________________________
USDT’s Growing Dominance
Tether’s profits are closely tied to the growth of its flagship product: USDT, the world’s largest stablecoin by market cap. As of August 2025, USDT has a circulating supply exceeding $110 billion, giving it a dominant share of the stablecoin market.
This growth can be attributed to several factors:
1. Increased Adoption in Emerging Markets
USDT is widely used in countries with unstable fiat currencies, such as Argentina, Nigeria, and Turkey. For many users, USDT represents a dollar-denominated safe haven in environments plagued by inflation and capital controls.
2. DeFi and Cross-border Payments
USDT continues to be a core asset in decentralized finance (DeFi) protocols, serving as a stable medium of exchange and collateral. It's also a preferred tool for cross-border remittances, given its speed and low transaction costs compared to traditional banking systems.
3. Institutional Integration
Major crypto exchanges, custodians, and payment processors have incorporated USDT into their platforms, driving further liquidity and utility. In many cases, USDT is preferred over fiat due to its 24/7 availability and blockchain-native nature.
________________________________________
What Does This Mean for the Crypto Industry?
Tether’s Q2 performance is more than just a corporate milestone—it’s a bellwether moment for the crypto industry. It signifies the maturation and institutionalization of digital assets and stablecoins. Here’s what it means for the broader ecosystem:
1. Stablecoins as Profitable Financial Products
Tether’s profitability proves that stablecoins are no longer just “crypto plumbing.” They are now financial products generating billions in yield, much like money market funds. This is reshaping how investors and regulators think about stablecoins—not as speculative tools, but as interest-bearing assets backed by real-world securities.
2. Regulatory Scrutiny Will Intensify
With Tether generating profits that rival traditional banks, expect regulators to increase oversight. Stablecoins have long been in the crosshairs of the U.S. Treasury, SEC, and global central banks, and Tether’s dominant market share will likely place it under further examination.
However, Tether’s transparency efforts, including quarterly attestations and reserve disclosures, may help it navigate these regulatory waters more effectively than in the past.
3. Competition Will Escalate
Tether’s extraordinary profits will likely attract new entrants and existing competitors to the stablecoin arena. Circle’s USDC, PayPal’s PYUSD, and even central bank digital currencies (CBDCs) are all vying for market share.
Tether’s early-mover advantage, global reach, and deep liquidity make it hard to displace, but increased competition could pressure margins in the long term.
4. Decentralized Alternatives Will Seek Market Share
Decentralized stablecoins like DAI, FRAX, and USDD aim to offer alternatives to centralized issuers like Tether. While they remain relatively small, the ethos of decentralization might gain appeal, especially in regulatory-heavy environments.
Still, decentralized stablecoins have struggled to maintain pegs during market stress, giving Tether an edge in terms of trust and resilience.
________________________________________
The Road Ahead for Tether
As Tether moves into the second half of 2025, several strategic themes will define its trajectory:
Continued Profitability
If interest rates remain elevated and USDT circulation continues to grow, Tether’s annual profit could reach or exceed $10 billion—putting it in league with the most profitable fintech firms globally. This surplus could be reinvested in:
• Infrastructure expansion
• Strategic acquisitions
• Reserve diversification
• R&D for stablecoin innovation
Expansion into Emerging Markets
Tether has hinted at expanding its presence in Latin America, Africa, and Southeast Asia, where demand for dollar-denominated assets is high and banking infrastructure is limited. Expect to see more localized partnerships and on-ramp/off-ramp solutions.
Embracing Blockchain Innovation
Tether is already deployed on multiple blockchains—Ethereum, Tron, Solana, and more. The company is likely to support new Layer 1s and Layer 2s to enhance speed, reduce costs, and maintain competitiveness in the DeFi space.
There are also rumors that Tether may be exploring tokenized asset offerings and programmable money features, allowing USDT to integrate more deeply with smart contracts and enterprise use cases.
________________________________________
Criticisms and Controversies: Still Lingering?
Despite its success, Tether continues to face criticism from parts of the crypto community and regulatory world. Concerns include:
• Lack of full audits (attestations are not the same as full financial audits)
• Opaque ownership structure
• Past legal issues, including settlements with the New York Attorney General and the U.S. CFTC
However, it’s worth noting that Tether has addressed many of these concerns over the past two years. Its transparency has improved, and its operations have become more conservative and professional.
Still, its scale and impact on the crypto market mean that any misstep could have systemic consequences. Investors and regulators alike will continue to scrutinize its activities.
________________________________________
Final Thoughts: Tether’s Moment of Ascendance
Tether’s Q2 2025 net profit of $4.96 billion doesn’t just reflect a successful quarter—it marks a paradigm shift in crypto finance. What began as a controversial stablecoin project has evolved into a global financial powerhouse, rivaling traditional banks and asset managers in profitability.
More than just a win for Tether, this moment signals the growing legitimacy of stablecoins in the global financial system. It shows that crypto-native firms can not only survive but thrive in traditional financial environments, leveraging yield, transparency, and blockchain infrastructure to create sustainable business models.
As the world watches, Tether’s next chapters will likely be shaped by innovation, regulation, and global expansion. But for now, with $5.7 billion in profits in just six months, one thing is clear:
Tether is no longer just a stablecoin issuer—it’s one of the most powerful financial entities
in the digital age.
________________________________________
Disclaimer: This article is for informational purposes only. It does not constitute financial advice. Always conduct your own research before making investment decisions.
HYPERUSDT Forming Bullish ContinuationHYPERUSDT is capturing significant attention as it emerges from a consolidation zone, signaling a potential bullish continuation. After a massive impulse move to the upside, the price found support at a critical zone, which has now flipped into a demand area. This area is acting as a strong base for buyers, with volume steadily increasing—a key indication of accumulation and renewed interest from market participants.
Currently, the price is forming a structure that reflects bullish momentum, supported by recent higher lows and increased wick rejections from below. This kind of setup often precedes a strong breakout, especially when reinforced by strong volume, as seen here. The chart suggests a potential upside move of over 130%, targeting previous liquidity zones and untouched resistance areas, as buyers step in aggressively.
HYPER is becoming a trending topic in the altcoin space, with investors closely watching its price action for signs of a full recovery. As trading sentiment shifts bullish and on-chain metrics support the narrative, HYPERUSDT stands out as one of the higher potential mid-cap coins. A breakout beyond recent highs could quickly accelerate gains, given the relatively thin resistance levels above.
This setup is ideal for breakout traders and swing positions, especially as the broader market regains confidence. Patience and technical confirmation will be key, but HYPERUSDT is positioning itself as a standout opportunity for the weeks ahead.
✅ Show your support by hitting the like button and
✅ Leaving a comment below! (What is You opinion about this Coin)
Your feedback and engagement keep me inspired to share more insightful market analysis with you!

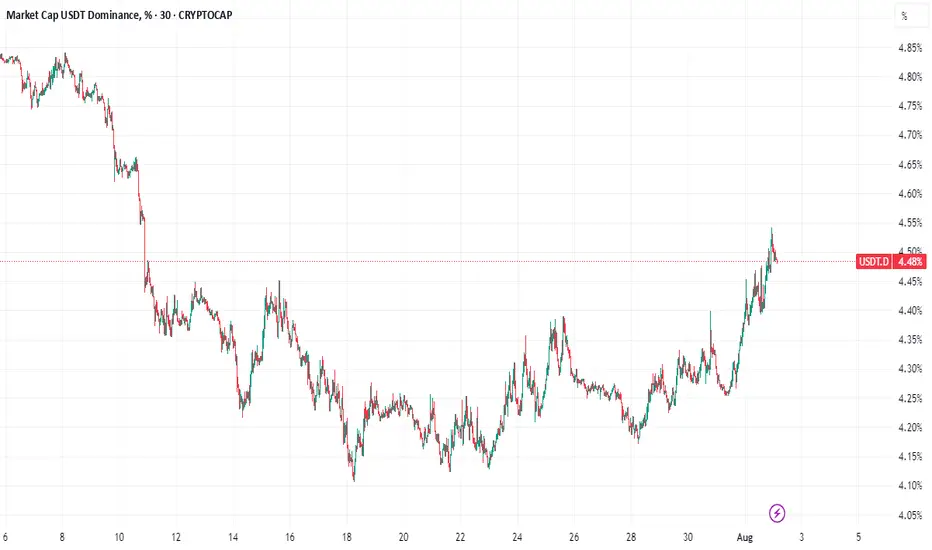
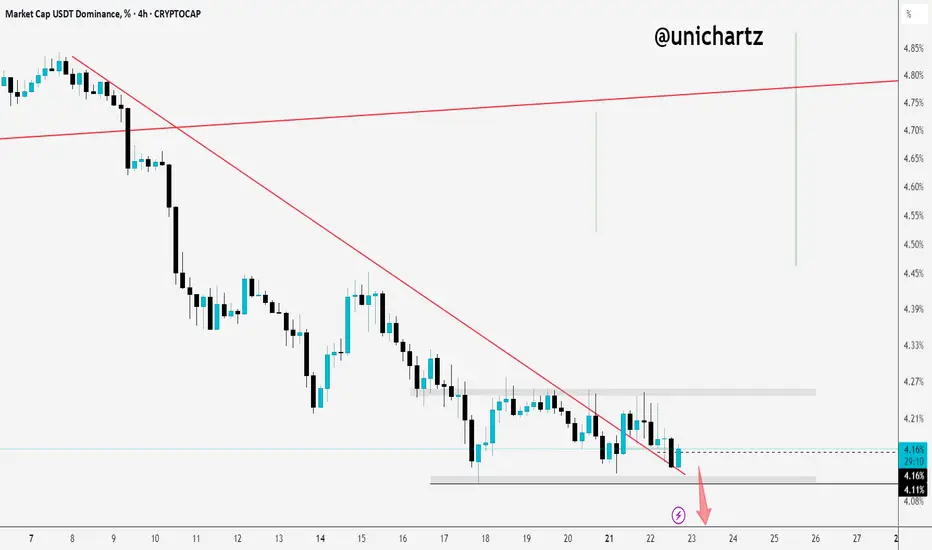
$USDT Dominance Breakdown Soon?Here’s a quick take on the CRYPTOCAP:USDT.D 1H chart: USDT dominance is bumping into a key trendline around 4.28%, right below strong resistance at 4.30%.
If it gets rejected here, we could see a drop toward 4.18%, which would be a healthy sign for altcoins.
But if dominance breaks above 4.30% with a strong candle close, that bearish setup gets invalidated.
Keep an eye on this zone, it’s a make-or-break moment.
DYOR, NFA

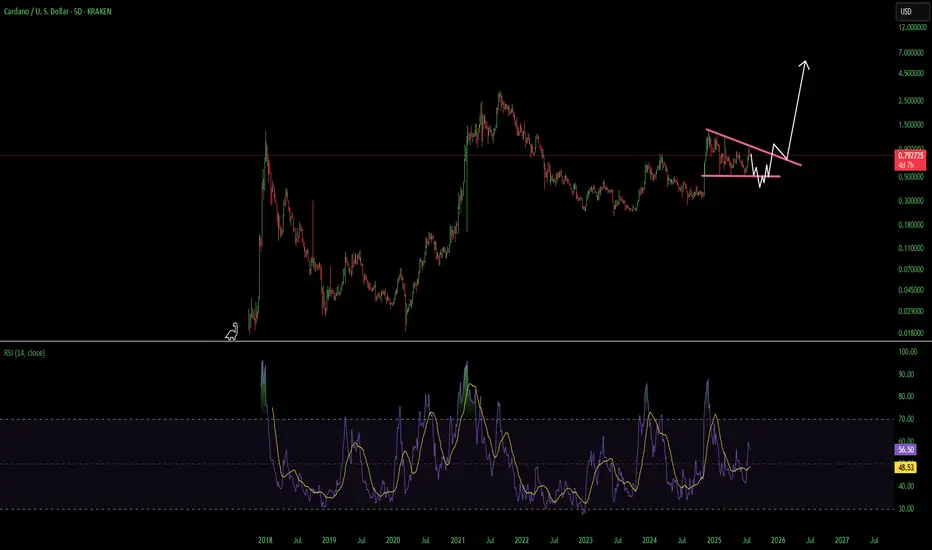
ADA Cardano Decsending Triangle Use Caution HereCardano had a heck of a move but i think its going to erase most if not all of it before it goes on its next leg up. A break over the overhead resistance line and finding support above would invalidate this. Not financial advice just my opinion. Thank you
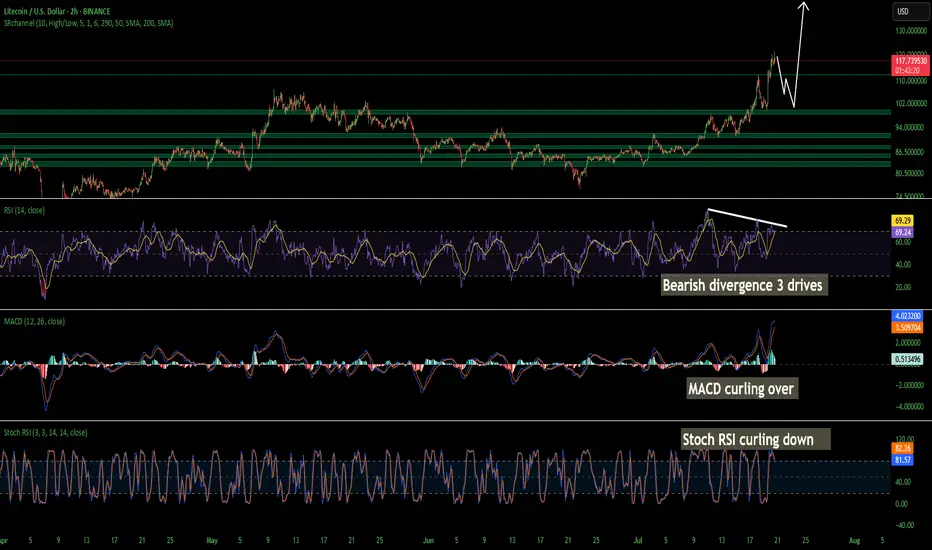
LTC Litecoin USD Textbook Cup & HandleLitecoin should finish its correction over the weekend and as we get into August the momentum will shift back to the upside. This is a washout of over-leveraged positionsbefore the next massive leg up. I still see a correction down to about 100 dollars. Could be a wick lower but not too confident. There is quite a bit of strength in Litecoin, and for good damn reason.
Not financial advice just my opinion. Thank you

$TWT/USDT Breakout Confirmed.SEED_DONKEYDAN_MARKET_CAP:TWT just broke a major downtrend and retested the breakout zone around $0.7555–$0.7898, holding above the 100 SMA.
If this support holds, we could see a 25% move toward $0.9528. Bullish structure, momentum building.
DYOR, NFA

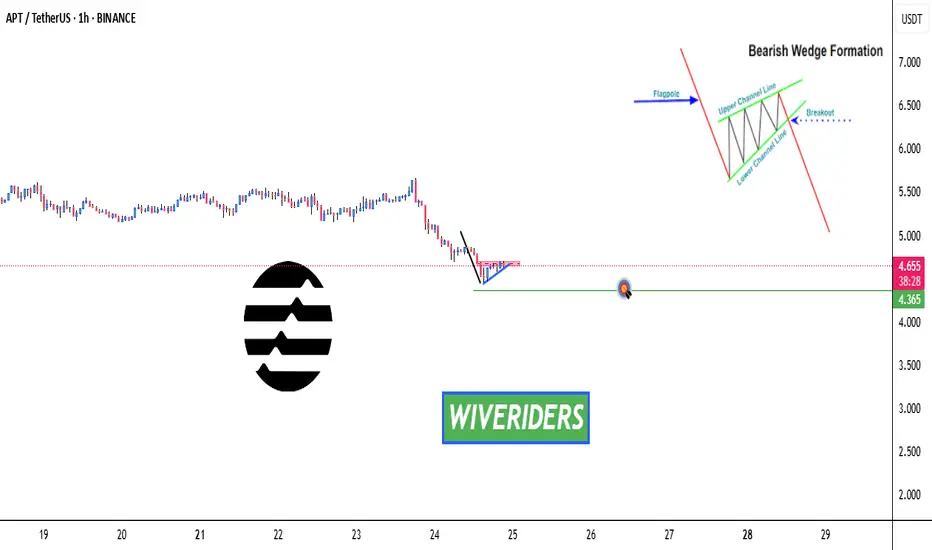
APT Forming Bearish Wedge Pattern – Watch the Support! APT Forming Bearish Wedge Pattern – Watch the Support! ⚠️📉
APT is forming a bearish wedge pattern and is now testing the blue support trendline.
🔻 If the support breaks, we could see a move down to the first green line level.
📊 Stay alert — this setup could trigger soon. Wait for confirmation before reacting.
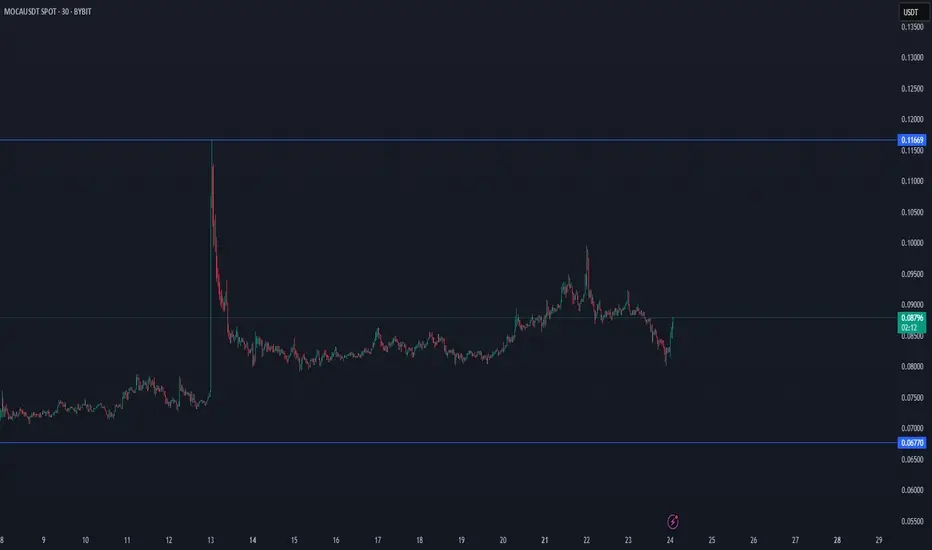
MOCA/USDT NEW VOLUME RANGEMOCA/usdt starting with new volume range, which can get confirmed in the next hours.
our follow will here for this coin to see new confirmations.
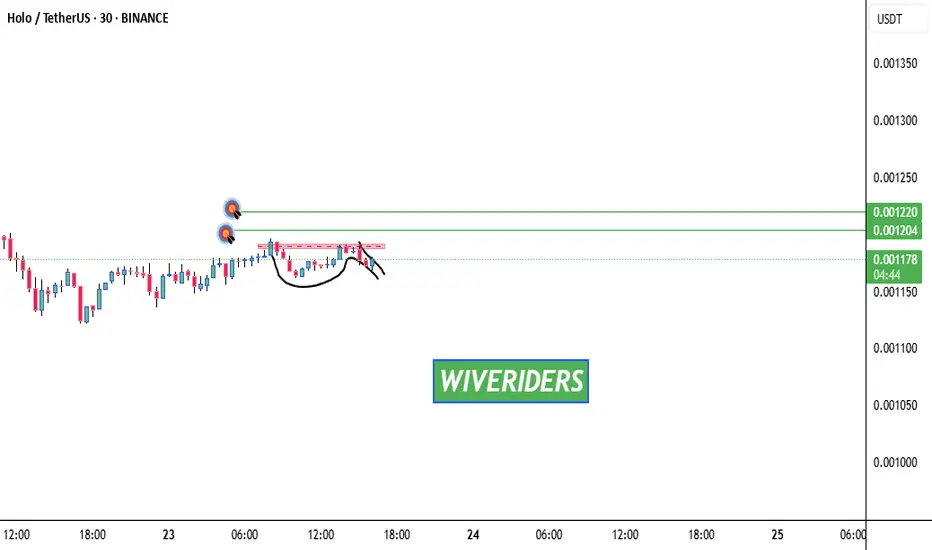
Cup & Handle Formation 🚨 XETR:HOT Testing Red Resistance – Cup & Handle Formation 📈
XETR:HOT is currently testing the red resistance zone and has formed a bullish Cup & Handle pattern on the chart — a classic continuation setup.
If breakout is confirmed, potential upside:
✅ First Target: Green line level
✅ Second Target: Green line level
🕵️♂️ Wait for clear breakout confirmation before entering long.
This pattern often signals strong momentum if buyers step in.
Trade smart. Let’s monitor for the perfect entry! 💹💼
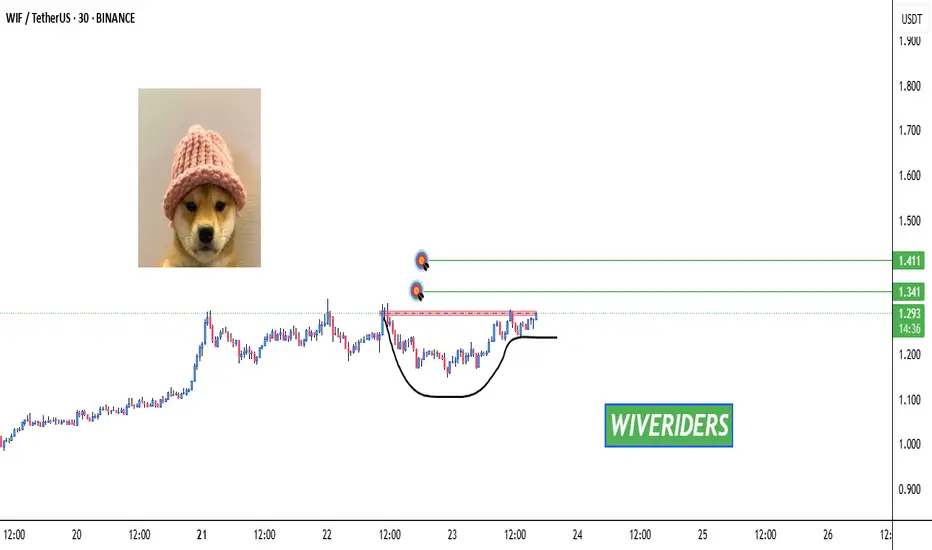
Bullish Cup & Handle Pattern Formed 🚨 SEED_WANDERIN_JIMZIP900:WIF Testing Red Resistance – Bullish Cup & Handle Pattern Formed 📈
SEED_WANDERIN_JIMZIP900:WIF is currently testing the red resistance zone and has formed a bullish cup and handle pattern on the chart.
If a breakout occurs, potential upside toward:
✅ First Target: Green line level
✅ Second Target: Green line level
Wait for breakout confirmation before entering long. 📊
Patience is key—watch this closely! 💼💸
$RAYUSDT Breakout: 146% PotentialNASDAQ:RAY just broke out of a major downtrend and flipped key resistance into support around $3.208 –$3.352.
If it holds, a move toward $8+ is on the cards, nearly
146% upside.
Momentum appears strong; watch for a clean retest and potential continuation.
DYOR, NFA

$CUSDT Breakout Targeting $0.47BITGET:CUSDT just broke out of and is now retesting the $0.34–$0.35 resistance zone.
If this level holds, we could see a strong move toward $0.47, nearly a 47% upside.
Momentum looks solid, but confirmation will come with a clean bounce.
DYOR, NFA

Tether Dominance Testing Support Zone – Big Move Coming?USDT.D is moving sideways right now.
If it breaks down below this range, it could fuel another leg up for altcoins.
Keep a close eye, the next move could shift the market.
LTC Litecoin Short Term Pull Back Quick and SharpI believe Litecoin Is topping out on the 2 hour. Looks like we may come back down and tap support at around 104 but I wouldn't be surprised a wick hits 100. I have buy orders around 103-106. I am not super confident on a deeper pullback so thats why my buys are there is so i don't miss the dip. Id rather make a little less money than miss a buy in trying to nail the bottom. Litecoin is starting its breakout from a 7 year consolidation and accumulation phase. This should be pretty massive. Litecoin is going to benefit considerably from these new bills that are being signed and many of the favorites in the top 100 will soon disappear!
The time for Litecoin to shine as I have been talking about for years is now. I am almost certain that this is that time. My predictions all still hold if you would like to go read them. I was just off on timing. Timing is the hardest thing to predict especially with how wild this planet has been lately. None of this is financial advice its just my opinion.
$CUSDT Breakout: Eyes on 94% Upside.BITGET:CUSDT is showing signs of strength again.
After a healthy pullback, it held support and broke out of the falling wedge.
This move could kickstart the next leg up, with a potential target near $0.53882, almost 94% from here.
Keep it on your radar if momentum picks up.
DYOR, NFA

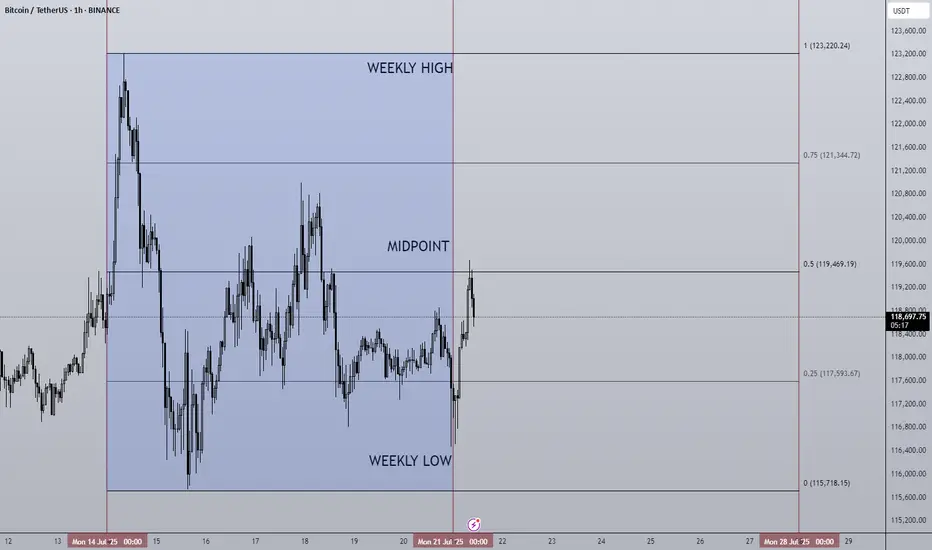
21/07/25 Weekly OutlookLast weeks high: $123,220.24
Last weeks low: $115,718.15
Midpoint: $119,469.19
New BTC ($123,220) & SPX ($6,315) ATH last week! We're really seeing progress being made on all fronts now, bitcoin saw its sixth week of net inflows into BTC ETFs ($2.39B).
The week began strong hitting the new ATH very early and then settled into a tight range to cool off. Altcoins however surged in relation to BTC to break out of HTF downtrends and begin to make up lost ground. One of the beneficiary's of this price movement has been ETH, breaking out from a multi year downtrend against BTC and hitting $3,800 in its USD pair.
For this week I do expect much of the same for BTC as momentum is with altcoins for now. However, as those altcoins reach HTF resistance levels it becomes very important for Bitcoins chop to be accumulation for the next leg up and not distribution for the way down. With so few pullbacks the threat of a sudden correction is present but the probability drops should BTC look to press higher with strong demand.
The ECB Interest rate decision takes place on Thursday but no changes to the 2.15% rate is forecast. In terms of news there are no planned upsets that I can see.
Good luck this week everybody!
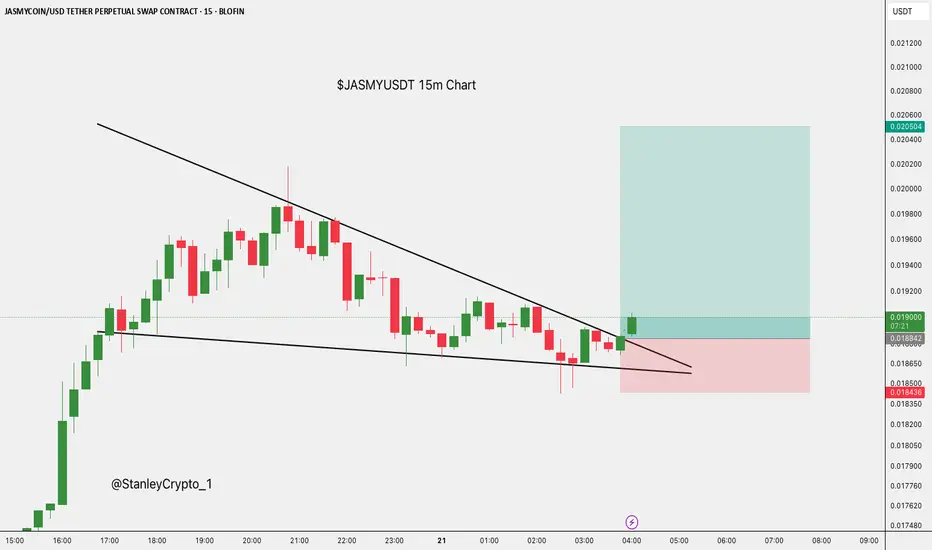
$JASMY 15Min Breakout Setup.$JASMY/USDT – 15Min Breakout Setup
- Entry: CMP
- SL: $0.018432
- Targets:
- TP1: $0.019604
- TP2: $0.020505
Wedge breakout forming.
DYOR, NFA
#BTC.D Just Hit the DAILY SUPPORT, WILL THERE BE A PULLBACK?CRYPTOCAP:USDT is breaking out on LTF while BTC.D just hit support that looks ready to break down.
Not a short call, but if you've been trading well, this is when you reduce margin and cut leverage.
Although I could be wrong about USDT here but profit-taking matters.
We will probably get a pullback this week to enter again.
It's better to watch coins rise a few more waves without you than to give it all back in a few reckless trades.
Spot bags? HODL and DCA.
Futures? Trade cautiously.
DYOR. NFA.
Do show your support with your likes if this post adds any value, and hit the like button.
Thank You
#PEACE
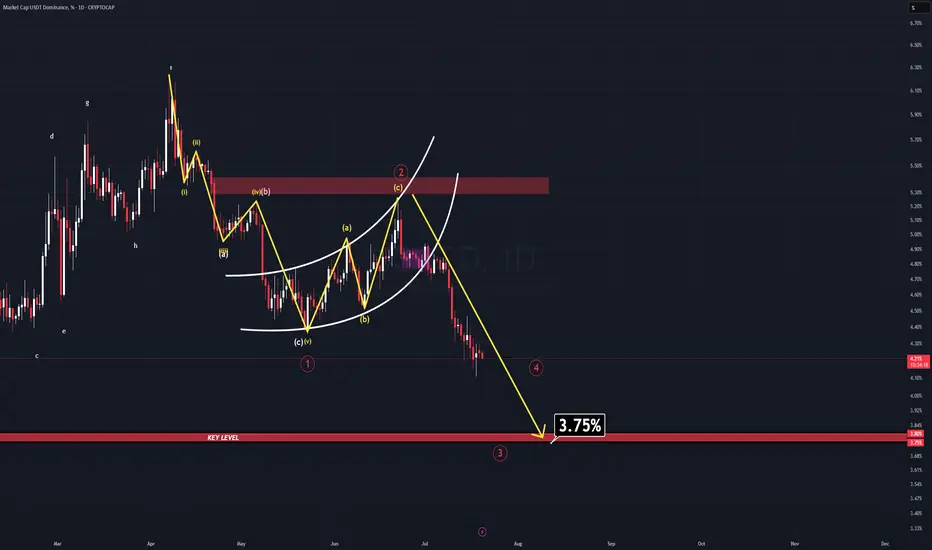
USDT DOMINANCE NEW UPDATE (1D)In a previous analysis, I mentioned that the long-term outlook for this parameter (USDT.D) remains extremely bearish. At the time, a bear flag was clearly visible—but it hadn’t been broken yet.
Well, now it has.
The breakdown confirms the bearish continuation, and there’s still more room to fall. As USDT.D continues to descend towards the projected target for Wave 3, we are likely to see a new All-Time High in Bitcoin, accompanied by a strong rally in many altcoins.
The main target for Wave 3 sits at 3.75%—a historically critical level. For years, USDT.D has never fallen below this zone, making it an extremely strong support area.
⚠️ Reminder: Consider taking profits when USDT.D approaches the 3.80–3.75% region. A reversal or temporary bounce is highly likely there.
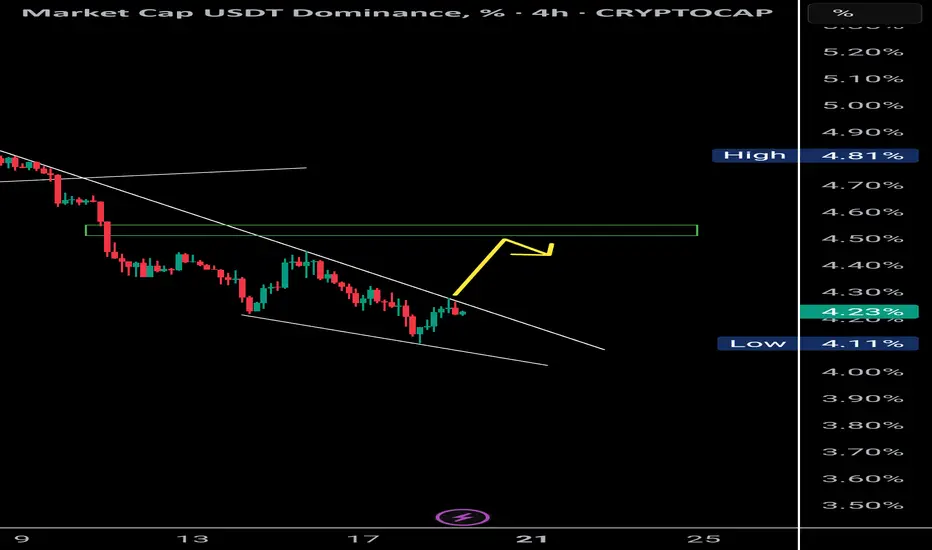
USDT Dominance Forming Bullish Divergence | Altcoins May Retest 📉 USDT Dominance (4H):
Currently forming a bullish divergence with RSI, supported by a falling wedge structure. Price is respecting a clear supply OB (resistance zone) and might retest the 4.55% level.
🔁 Historically, a rise in USDT.D signals short-term corrections in BTC and altcoins, creating opportunities for OB/supply fills and long setups.
📊 This could be the retest phase for major crypto assets before resuming upward momentum.
🧠 Use this phase wisely — it’s where strong setups begin to form.
$SUSDT (or S , ex FANTOM): good entry for a long setupCrypto Market Outlook
The overall crypto market is in a clear uptrend.
The money printer is running, and USD dominance is dropping — all signs pointing to a potential continuation of the rally in the coming months.
Unless a black swan event hits, it's not too late to position yourself if you’re still on the sidelines.
⚠️ Always manage your risk with a proper stop loss — altcoins move fast and can reverse just as quickly.
One interesting setup: $S
✅ Relatively new
✅ Didn’t pump too hard
✅ Broke out of its downtrend
✅ Found solid support
The Fib levels offer good targets for take profit zones.
🔍 Ideal entry: within the green box or lower.
Let the pump cool off — it could offer a perfect entry opportunity. Be patient and wait for a good position.
If $S pumps from here without retrace:
→ Jump in with a tight stop loss
→ Or look elsewhere for a better risk/reward setup.
DYOR.
#Crypto #Altcoins #Bitcoin #ETH #Trading #CryptoMarket #TechnicalAnalysis #RiskManagement #DYOR
