$UNI Breakout: 400% Target AheadCRYPTOCAP:UNI just broke out from its long-term accumulation zone around $4.000–$4.801, gaining +30% this week.
The market structure has turned bullish, with the next major target near $19–$24, a potential 400% upside.
As long as UNI holds above the breakout zone, further gains look likely.
Watch this one closely.
DYOR, NFA.
Usdt

$TRU 4H chartNYSE:TRU 4H chart has broken out of a descending trendline, showing bullish momentum.
Price is now approaching the key resistance zone around $0.041.
A successful breakout here could push the price toward the $0.0474 target +25%.
Watch for a possible retest of the breakout zone before continuation.
DYRO, NFA

$BTC Bulls BackCRYPTOCAP:BTC is breaking out of a descending channel after a healthy pullback from the $ 112,000–$ 114,000 resistance zone.
Strong demand at $ 102,000–$ 104,000 supported the bounce, with buyers now pushing prices higher.
A clean breakout above $106K could open the path to retest $112K+.
The $102K–$104K zone remains key support as long as BTC holds above it, the short-term bias stays bullish.
DYRO, NFA

HelenP. I Bitcoin can break resistance level and continue growHi folks today I'm prepared for you Bitcoin analytics. After looking at this chart, we can see how the price traded inside a consolidation, where it reached a resistance level, which coincided with a resistance zone. Then it some time traded between the 108500 level and then dropped to the support level, thereby exiting from consolidation and breaking the 108500 level one more time. After this, BTC started to trade inside another consolidation, where it rebounded from the support level and rose to the top part of this range. Then it some time traded near this area and then dropped to the trend line, breaking the support level and exiting from the consolidation. But then BTC started to grow and rose to the 103100 level, broke it, and continued to grow. A not long time ago, it made a correction to the trend line and then bounced and continued to move up. So, I expect that BTCUSDDT will correct to the trend line and then rise to the resistance level and break it. Then, I thought that Bitcoin might continue to move up next; therefore, I set my goal at 110000 points. If you like my analytics you may support me with your like/comment ❤️

$IDUSDT 1D chart The BINANCE:IDUSDT 1D chart shows a potential breakout from its long downtrend.
Price recently bounced off a strong demand zone at $0.1785 and is now testing above the descending trendline.
If momentum holds, a move toward the $0.4004 target +131% is possible.
Watch for strong volume confirmation to validate the breakout.
DYRO, NFA

Bitcoin will continue to fall to support level in channelHello traders, I want share with you my opinion about Bitcoin. This chart shows how the price rebounded from the support line and started to grow. In a short time, it rose to the support level, which coincided with the buyer zone, and it even soon broke this level. Next, the price rose a little and then continued to move up, but later corrected the support line. After this, BTC rebounded and rose to the seller zone, breaking the 108800 resistance level. Then it rose a little more and turned around, and started to decline inside the downward channel. In the channel, price soon broke the 108800 level and continued to fall next. Later, Bitcoin broke the support line and fell almost to the support line of the channel, after which it turned around and made an upward movement. After this movement, Bitcoin dropped to the 100300 support level, after which it turned around and, in a short time, rose to almost the resistance line of the channel. Price didn't reach this line, turned around, and continued to fall in the channel. In my mind, Bitcoin can continue to move down top support level inside the downward channel. That's why my TP is 100300 level. Please share this idea with your friends and click Boost 🚀

$ASTRUSDT Breakout Setup$ASTRU is attempting a breakout from its downtrend on the 6H chart.
Price is pushing above the descending trendline, supported by a bullish MACD crossover.
If the breakout holds, the next target is around $0.035061, with a stop below $0.025490.
Momentum looks promising for further upside.

HelenP. I Bitcoin may grow to resistance zone from trend lineHi folks today I'm prepared for you Bitcoin analytics. This chart shows how the price declined to the trend line and then made an impulse up to the support level, which coincided with the support zone. Also, price started to trades inside a pennant, where it soon broke the support level and then traded some time near it. Later, it continued to grow and in a short time rose to the resistance level, which coincided with the resistance zone and broke this level as well. Then BTC reached the resistance line of the pennant, turned around, and dropped below the 108000 level, after which a few moments traded between this level. After this, price continued to fall and after it broke 108000 leve one more time, it dropped to the trend line, which is a support line of the pennant too. Price has traded near this line and recently BTC rebounded up. So, I expect that BTCUSDT will correct to the trend line and then rise to the resistance level. After this, I think the price may break it and enter to resistance zone. That's why I set my goal at 108800 points. If you like my analytics you may support me with your like/comment ❤️

Doge coin log term that my personal view for the doge coin chart
it looks like history repeat it self my price target $2.50

$DOT Setup: Watch This BreakoutCRYPTOCAP:DOT is trading in a clear range between $3.544, $4.022 support and $10.132, $12.564 resistance.
The current pullback to the demand zone hints at potential accumulation.
A breakout above $12.423 could trigger a strong rally toward $23.654, $32.756, $53.172, and higher.
DOT is gearing up for a major move once resistance clears.
DYRO, NFA

BITCOIN - Price can reach resistance area and then dropHi guys, this is my overview for BTCUSDT, feel free to check it and write your feedback in comments👊
Recently, the price bounced from the $104500 level and rose to the $110400 level, breaking this level and rising a little more.
But then price turned around and started to decline inside a falling channel, where it fell below $110400 level.
Price tried to back up, but failed and when it touched $110400 level, it in a short time declined to support line of channel.
Then price rose above $104500 level and some time traded near this level, but not long time ago it dropped.
BTC broke $104500 level and even fell further and exited from falling channel, after which it started to grow.
Now, I expect that Bitcoin can enter to resistance area and then drop to $100900 from this area.
If this post is useful to you, you can support me with like/boost and advice in comments❤️

EURCAD BULLISH OR BEARISH DETAILED ANALYSISEURCAD is currently consolidating within a clean symmetrical triangle formation on the 8H chart, tightening between dynamic support and resistance. Price is hovering around 1.56200 and coiling at the apex of the triangle, suggesting a breakout is imminent. With this structure developing over several weeks, this setup is primed for a high-probability directional move. The overall technical picture is showing compression, and the bullish bias becomes more likely if price breaks and closes above 1.56900.
From a fundamental perspective, the euro is gaining moderate strength as the ECB is maintaining a cautiously hawkish tone while assessing economic recovery and inflation persistence. Meanwhile, the Canadian dollar is facing downward pressure following the Bank of Canada's recent interest rate cut — a shift that surprised many traders and sparked risk-on flows away from the loonie. Crude oil prices, which often support CAD, have also turned volatile with no sustained bullish momentum, weakening CAD’s support base.
This triangle pattern reflects indecision but also the perfect setup for breakout traders waiting for volatility expansion. A confirmed bullish breakout would likely target 1.59200, with short-term resistance levels offering minor friction around 1.57800. The breakout aligns with a well-balanced risk-reward setup, with a stop area potentially below 1.56000. Price action has respected this structure consistently, adding further confluence for a clean technical move.
As EURCAD inches toward a decision point, traders should be on high alert for breakout confirmation and follow-through momentum. This is a textbook volatility squeeze pattern — when it resolves, it tends to run fast and far. With favorable macro fundamentals, this setup has the potential to deliver a solid trend continuation wave in the coming sessions.

Bitcoin may break resistance level and continue to move upHello traders, I want share with you my opinion about Bitcoin. If we look at the chart, we can see how the price entered an upward channel and declined to the support line. Then it started to grow and soon reached the 93500 support level, after which it broke this level and then some time traded near. After this, the price rebounded and continued to move up inside an upward channel, where it later reached a resistance level, which coincided with the seller zone. When BTC reached this level, it broke it too and even rose to the resistance line of the channel, but soon it turned around and dropped to the seller zone. In this area, the price long time traded and later tried to grow, but failed and continued to decline. Soon, BTC broke the 106500 level and fell below the resistance level. But recently, price turned around and grew to this level again, and now trades very close. In my opinion, Bitcoin can decline a little and then break the resistance level one more time. After this movement, I expect that the price will continue to move up inside the upward channel, so I set my TP at 112000 points. Please share this idea with your friends and click Boost 🚀

Gold's Bullish Comeback Inverted Head & Shoulders Pattern📊 Chart Analysis
This is a 1-hour chart of XAU/USD (Gold Spot vs. USD) showing a classic Inverted Head and Shoulders pattern — a bullish reversal formation.
🔍 Pattern Breakdown:
Left Shoulder: Formed in early May.
Head: Deep dip mid-May.
Right Shoulder: Developed in late May.
Neckline Breakout: Price has broken above the neckline with strong bullish momentum.
📈 Key Levels:
🔵 Bullish Confirmation: 3,278.395 (breakout level, neckline)
🔼 First Target: 3,410.372 🔴
🎯 Final Target: 3,495.774 🚀
📉 EMA 70 (3,316.651) is acting as dynamic support, aligning with the bullish scenario.
🧠 Interpretation:
As long as price stays above the bullish zone (3,278), the bias remains strongly bullish.
Traders might consider entering on pullbacks or breakouts with stops below the right shoulder or neckline.
📌 Summary:
✨ Bullish Reversal Unfolding
💹 Breakout confirmed
🎯 Targeting higher highs

DOGEUSDT 0.2550 TPWe are seeing a price rebound from strong support around the ~0.1900 level, which may signal the end of the correction. A potential double bottom formation is forming, which often indicates a trend reversal to the upside.
Additional arguments:
The WT_LB oscillator shows an oversold zone and initial upward curvature of signal lines – a typical buy signal.
After a strong downtrend, a consolidation phase has occurred, likely acting as an accumulation zone before a potential move upward.
The risk-to-reward ratio (R/R) is very favorable (around 1:5), supporting a long entry at the current market structure.
📌Technical signals and a strong R/R ratio support a bullish scenario, with a target around 0.252 and a stop-loss set near 0.185.

Bitcoin may break support level and continue to fall in channelHello traders, I want share with you my opinion about Bitcoin. Previously, price was moving inside a horizontal range, consolidating between resistance and the buyer zone near 103500 - 102900. The market lacked clear direction, and price repeatedly rebounded within this structure, failing to build strong momentum either way. Eventually, BTC exited the range and began forming a downward channel. This shift introduced a clear bearish bias, with each high being lower than the previous one. Price action started respecting the descending resistance and support lines, confirming the structure. Sellers consistently stepped in from the seller zone near 109000 - 109500, pushing the price downward with each retest. Currently, BTC is hovering around the support level at 103500 points, showing short-term weakness. The latest reaction from this area didn’t generate significant bullish follow-through. In my view, BTC is likely to break through this support and continue falling inside the channel. That’s why I’ve placed my TP at 100600 points, which matches the support line of the channel and offers a logical downside target. Please share this idea with your friends and click Boost 🚀

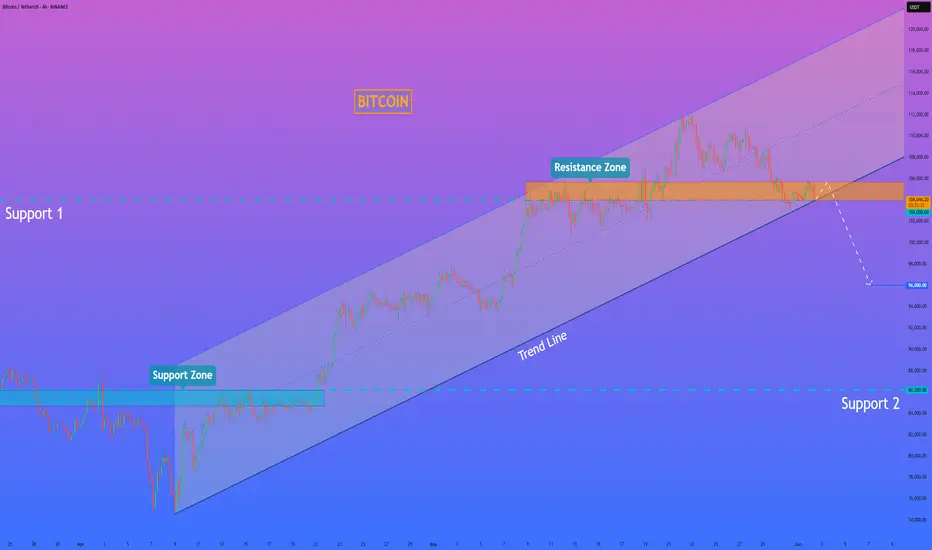
HelenP. I Bitcoin can exit break trend line and continue to fallHi folks today I'm prepared for you Bitcoin analytics. After looking at the chart, we can see how the price declined and broke support 2, which coincided with the support zone. Then the price rose to the support zone but turned around and dropped to the trend line. After this movement, BTC started to grow inside an upward channel, where it soon rose to support 2, which soon broke it and continued to move up. In the channel, price rose to support 1 and some time traded near this level. Later, BTC broke it and rose to the resistance line of the channel and turned around, and dropped to support 1. And at the moment, it traded inside the resistance zone, which coincided with the support level. So, I expect that BTCUSDT will break the support level, which coincides with the trend line, and continue to decline, thereby exiting from upward channel. That's why I set my goal at 96000 points. If you like my analytics you may support me with your like/comment ❤️
XAUUSD BULLISH OR BEARISH ------ DETAILED ANALYSISXAUUSD is currently forming a classic bullish flag pattern on the 12-hour timeframe after a strong impulsive rally from the 3145 demand zone. The consolidation is tight and orderly, holding above the key structure zone and forming lower highs and lower lows within the flag. This setup indicates a continuation pattern, and with price stabilizing around 3315, a breakout to the upside is increasingly likely. A clean breakout from the flag will likely ignite the next bullish wave toward the 3500 level.
From a fundamental perspective, gold remains supported amid renewed market concerns around inflation persistence and global macro uncertainty. The latest US economic data, including slower job growth and declining consumer sentiment, is increasing speculation that the Federal Reserve might be nearing the end of its tightening cycle. This is weakening the US dollar and boosting safe-haven demand for gold. Additionally, central banks, particularly from China and emerging markets, continue to increase gold reserves—adding to long-term bullish sentiment.
Technically, XAUUSD has already respected a strong demand zone around 3145 multiple times, which reinforces that institutional buyers are defending this area. The market structure remains bullish, and higher lows continue to form, aligning with a potential trend continuation. If price breaks above the flag resistance around 3325–3330 with volume confirmation, the bullish target of 3500 could be reached swiftly.
As long as gold holds above the 3270–3280 support zone, the risk-reward setup remains favorable for long positions. With a confluence of strong fundamentals and a high-probability technical pattern, XAUUSD is setting up for a potential breakout rally. Traders should watch closely for breakout confirmation to ride the momentum toward new highs in this evolving bullish trend.

Important Update on USDT Dominance!This might get a little tricky, guys!
On the weekly timeframe, USDT.D has broken below the 100 MA. The last time this happened, it dropped by 33%, which was enough to trigger a solid rally in BTC and the broader market.
Currently, we may see dominance attempt to retest the 100 MA, which is now acting as resistance after the breakdown. This slight rebound could bring some correction to the market — so brace yourselves and stay cautious. ⚠️
In the long run, BTC still looks strong and is likely to go parabolic. Remember, consolidation is a natural part of the market cycle — and if you know how to navigate it, you’ll be just fine. 💪
Regards,
Dexter

$BONK Breakout ConfirmedSEED_DONKEYDAN_MARKET_CAP:BONK Breakout Confirmed
The $1000BONKUSDT 1D chart shows a breakout from a long-term downtrend followed by a successful retest of the key support zone around $0.016390.
This area, previously resistant, is now acting as strong support.
If it holds, BONK could rally up to $0.040830, a potential 150% upside.
Invalidation occurs on a clean break below the support zone. Structure remains bullish for now.
DYRO, NFA

$USDT.D Rejeccted Again Altseason SignalCRYPTOCAP:USDT.D Rejected Again Altseason Signal
USDT Dominance is showing a clear rejection from the descending trendline and 200 MA, similar to the previous 16% drop.
The RSI is turning down from the overbought zone, signalling potential downside.
If this move plays out, we could see USDT.D fall toward the 4.0% zone, which is bullish for Altcoins.
DYRO, NFA

USDT.D Forecast: Time to Buy the Dip?#USDT DOMINANCE
This is what I’d like to see happen in the next 2 days.
And I believe it will. Invalidation would be a close above 4.80%.
I’m buying the dip, guys. Let’s see how this plays out.

Altseason is cancelled for now. But Should resume soon.If you're interested in altcoins, be sure to check out my ideas. I’m closely tracking CRYPTOCAP:BTC.D and CRYPTOCAP:OTHERS , and you’ll find plenty of valuable insights in those analyses.
So, what’s going on? My CRYPTOCAP:OTHERS prediction played out — May was bullish. But was it the real altseason? Not quite. The true altseason typically begins at the end of the Bitcoin cycle, and we’re not there yet.
Right now, we’re seeing price action reminiscent of December 2024. Bitcoin maximalists are aggressively buying BTC during a time it should be correcting, which is inflating BTC dominance and crushing any momentum for an altseason. They appear to be using altcoins as exit liquidity to pump BTC, especially as retail investors hesitate to buy Bitcoin above $100K.
What’s next?
The daily MACD suggests we’re entering a correction phase that could last around two weeks. A drop toward $1.2T is likely, as there's a major order block between the current level and that target. However, the real support lies below $900B — my "green box" — which I view as the ideal buy zone.
Historically, entries in this green box have offered 2x–3x returns on high-volatility altcoins from the top 100, especially in sectors like memes, DeFi, and AI.
I expect altcoins to correct into that zone in the coming weeks — keep an eye on it.
DYOR (Do Your Own Research).
#Crypto #Altcoins #Bitcoin #BTC #BTCdominance #Altseason #CryptoMarket #CryptoTrading #MACD #TechnicalAnalysis #DeFi #MemeCoins #AIcoins #AltcoinSeason #DYOR
