$WLD Price Update The downtrend continues, but we’re seeing signs of a potential bounce! 🚀
RSI at 32.15 approaching oversold levels!
Price hitting the bottom trendline of the descending channel.
Possible reversal to $2.20
Could this be the breakout we've been waiting for? 👀
Usdt

$BTC Breaks Out $155K Target in SightBitcoin has officially broken out above the key $105K resistance zone, confirming a strong bullish structure on the 1-day chart.
The price now exceeds the previous supply area, which has flipped into solid support.
As long as BTC stays above this level, momentum remains bullish with a clear path toward the next major target at $ 155 K.
This breakout marks a strong continuation of the uptrend, and traders should keep a close eye on any retest of the $105K zone for potential long
opportunities.
DYRO, NFA

Bitcoin may break support level and fall to support lineHello traders, I want share with you my opinion about Bitcoin. In this chart, we can see how the price a few moments ago declined, but then turned around and started to grow inside an upward wedge. Price at once rebounded from the support line of the wedge and made an upward impulse to the support level, which coincided with the buyer zone, after which it broke it and made a retest. Then BTC rose to the resistance line, after which it corrected to the 100900 support level and then started to slowly grow in the wedge. Some time later, Bitcoin rose to the current support level, which coincided with the support area and even climbed a little higher to the resistance line of the wedge, but soon dropped to the support line. Next, price turned around and made an upward impulse from this line, breaking the 105800 level, and at once made a retest. After this movement, BTC continued to grow and reached the resistance line of the wedge, but recently it rolled down, so now I expect that the price can rise a little. After this movement, in my opinion, BTC can drop to the support line of the wedge, breaking the current support level. Therefore, I set my TP at this line - 104200 points. Please share this idea with your friends and click Boost 🚀

$TAOUSDT Breakout ReloadedLSE:TAO just flipped a major resistance into strong support around the $410 zone after breaking out of a long-term downtrend.
This retest held perfectly, and now the bulls are back in control.
With price trending above the 180-day SMA and momentum building, the next target is the all-time high at $777.
If this move continues, we could see a powerful rally unfold from here.
Keep a close eye on it! 🚀
DYRO, NFA


PIUSDT Daily Technical AnalysisPIUSDT Daily Technical Analysis
Pi Network Coin Indicators Are POSITIVE.
The price has broken above the 21-day moving average and successfully held above it. Currently, Pi Network appears to be targeting the $0.905 resistance level. After a wave of profit-taking, its recovery has increased the likelihood of continued positive price action. Resistance levels will be monitored closely. Indicators have turned positive from lower levels and are now pointing upward.
Resistance Levels: 0.900 – 0.963 – 0.999
Support Levels: 0.830 – 0.810 – 0.787
Positive news from the Pi Network team could support further upward price movement. Accumulating Pi Network Coin at these price levels for long-term investment might be considered potentially profitable. However, the decision is entirely yours. This is not financial advice. In the long run, Pi Network Coin may test the $3 levels again — or it might remain at a lower price range.
NOT FINANCIAL ADVICE
The information, commentary, and suggestions provided here do not constitute investment advice. Investment advisory services are offered only through a formal agreement with authorized institutions such as brokerage firms, portfolio management companies, or non-deposit banks.
The content on this page reflects personal opinions only. These views may not align with your financial situation or your risk and return preferences. Therefore, investment decisions should not be made solely based on the information provided here.
If you’d like to stay updated on our technical analyses — whether positive or risky — please follow and like us. We’d really appreciate your support!

$IMXUSDT looks bullishSEED_DONKEYDAN_MARKET_CAP:IMX looks bullish on the daily chart after a clean breakout and retest of the $0.595 support.
Price is holding above the trendline and 100MA, signalling strength.
If momentum continues, the next target is around $1.03.
DYOR, NFA.

$CATUSD Breakout Setup OKX:CATUSD Breakout Setup
CATUSDT is holding above key support and an ascending trendline, showing bullish strength.
If the structure holds, a move toward 0.00025344 is possible, a potential 173% gain.
Key resistances are at 0.00013776 and 0.00018994.
It’s a volatile coin, so manage risk wisely.
DYOR, NFA.

$INITUSDT Breakout AlertINIT just broke out of a falling wedge, a strong bullish signal.
Targeting a 58% move toward $1.4488.
Momentum looks solid. Watch for follow-through!
DYOR. Not financial advice.

$NEAR 2H Trade Setup.Breakout from descending trendline, bounce from demand zone
. Entry: CMP
. SL: $2.62
. TP: $2.96 / $3.17 / $3.36
Clean breakout. Watching for follow-through.
DYRO, NFA

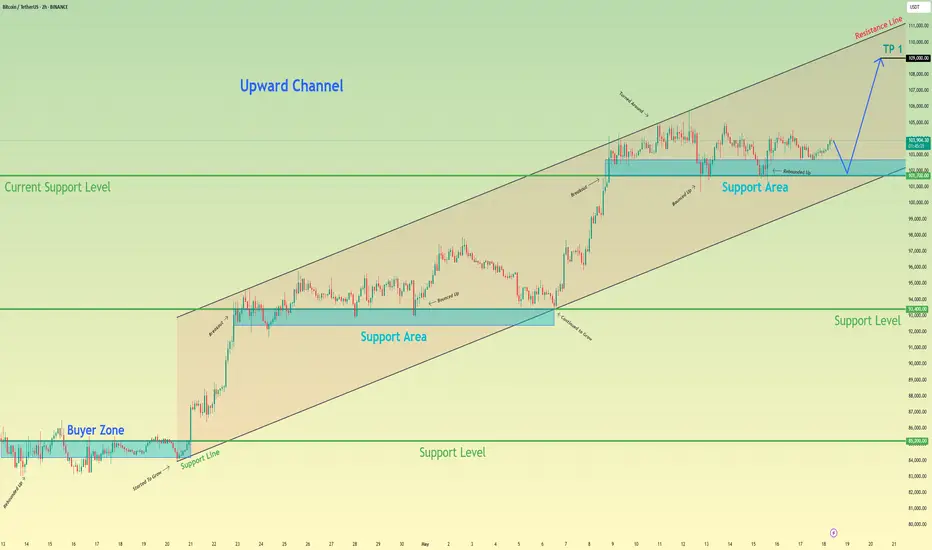
Bitcoin can continue grow in channel, after small correctionHello traders, I want share with you my opinion about Bitcoin. In this chart, we can see how the price remains inside a clear upward channel, respecting both support and resistance boundaries. After breaking above the 93400 - 92400 support area, the price continued to grow and formed a new support zone between 101700 - 102700 points. This area has been tested several times, showing strong buyer interest and keeping the bullish structure intact. Right now, BTC is hovering just above this support area. A minor correction down to this zone would be healthy and could provide fuel for the next upward leg. The market structure shows higher highs and higher lows, typical of a stable channel-driven trend. As long as the price stays above 101700 points, I expect it to move toward the upper channel boundary. That’s why my current target is set at 109000 points, which is the next key resistance and the top of the channel. This move would align with the current trend and follow the previous impulse-retracement pattern we’ve seen throughout this structure. Please share this idea with your friends and click Boost 🚀
HelenP. I Bitcoin can drop to $99500, breaking support levelHi folks today I'm prepared for you Bitcoin analytics. Price is currently testing a crucial area where multiple technical factors converge. After an extended period of consolidation between 101500 and 105100 points, the price failed to break the upper boundary and instead reversed, showing increased bearish momentum. The recent move has brought BTC right to the lower edge of the consolidation range, which aligns with the ascending trend line, a level that has held multiple times before. This time, however, the setup looks weaker. Price pierced through the trend line slightly, and while there was an initial reaction from buyers, the overall structure suggests a loss of bullish strength. The market has been forming lower highs, and this recent failure to hold above the trend line could be a signal that sellers are beginning to dominate. Given this context, I expect that BTCUSDT will soon break decisively below the ascending trend line and move through the 101500 - 100800 support zone. If this zone is lost, the next logical target lies at the 99500 level, which aligns with the broader structure and the base of a previous impulse. My outlook remains bearish for now, with 99500 as the next key objective. If you like my analytics you may support me with your like/comment ❤️

ETH going up... 🚀 ETH/USDT Current Analysis 🚀
Ethereum (ETH) is currently trading around $2535. The ongoing bullish trend suggests potential target levels at $2780 and $2900.
🔄 However, a corrective phase is anticipated, which could pull the price back towards $2290 and $2120.
📈 In the long term, our price targets are set at $3200, $3800, and $4500.
Always exercise caution in the cryptocurrency market and stay informed about the latest developments! 💹
#Ethereum #ETH #Crypto #Investment

$GOAT/USDT 1H Chart Breakout Alert!$GOAT/USDT 1H Chart Breakout Alert! 🐐
After a clean breakout from the downtrend line, price is now retesting the breakout zone + key demand area 🔥
- Entry: CMP
- Target: $0.20+
- SL: Below $0.142
Setup looks solid 👀
DYRO, NFA

$GOAT Update MIL:GOAT Update
After a strong breakout, the price has retested the trendline, and the previous resistance has now flipped into support
Bulls stepped in from the green zone like clockwork, still bullish!
Next target: $0.25+ incoming? 👀
DYRO, NFA

$PENG Trade Setup (4H Chaat)NASDAQ:PENG Trade Setup (4H Chart)
- Entry: 0.0123 – 0.0125
- Stop Loss: 0.0110
- Target: 0.0168
Structure: Trendline bounce + bullish reaction
Bias: Bullish continuation
Clean bounce from ascending trendline support, watching for strong upside follow-through!
DYRO, NFA

Monitoring USDT- Absolutely not a prediction.
- Just doing this chart to observe 1D (smaller timeframe) on USDT Dominance & Sharing.
- I usually like to use larger TF to reduce the noise on charts ( 1W, 2W, 1M, 3M ).
- USDT.D have to break out 8.4% before 13th December.
- if it does, could mean BTC more downward pressure.
- if it fails, BTC could rally up.
- Patience is the key.
Happy Tr4Ding !

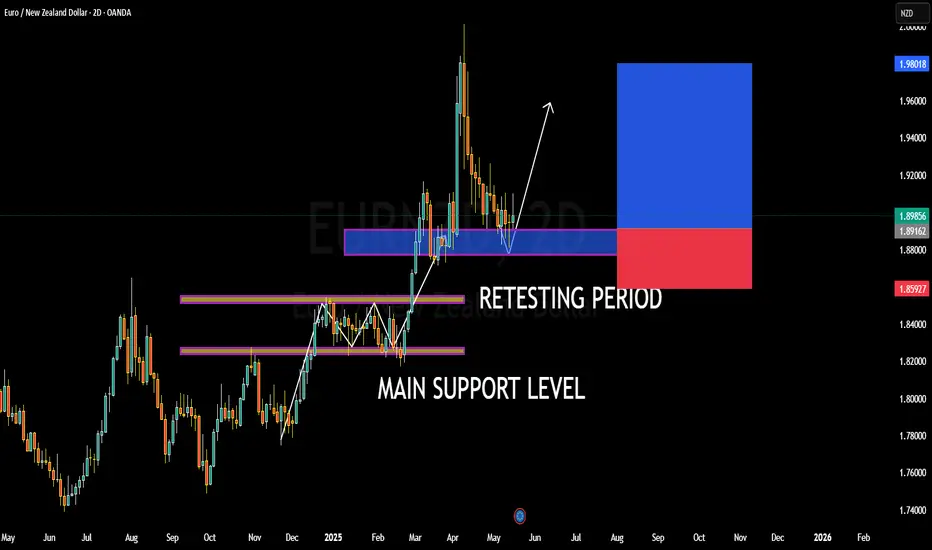
EURNZD BULLISH OR BEARISH DETAILED ANALYSISEURNZD is currently trading around the 1.89 zone after successfully completing a retest of its prior breakout area. This level aligns perfectly with a key historical demand zone, where previous resistance has now flipped into strong support. The market structure remains bullish, and the recent higher-low formation combined with increased volume suggests the pair is gearing up for its next impulsive move to the upside. The price has respected the support zone with precision, signaling institutional interest and a favorable risk-to-reward ratio for long positions.
From a fundamental perspective, the euro remains relatively supported against the New Zealand dollar due to diverging monetary policy expectations. The European Central Bank is maintaining a cautious but slightly hawkish tone amid sticky core inflation, while the Reserve Bank of New Zealand is under pressure to ease policy later this year due to softening economic indicators, including a slowdown in GDP growth and weaker labor market conditions. These macro drivers favor a bullish bias on EURNZD as capital flow leans toward safer, yield-protected assets in the eurozone.
Technically, this setup has clean market geometry. The pair has broken through a multi-month consolidation structure and is now retesting the breakout with confluence from the main support zone at 1.88–1.89. With momentum building and volume increasing on the bounce, the setup is valid for a continuation toward the 1.99 level, especially if the pair reclaims the minor resistance at 1.9050. Breakout traders and position holders should monitor this area closely for confirmation.
Overall, this is a textbook bullish continuation play. The market has absorbed sell pressure at a critical level, and the successful retest confirms the strength of the new support base. With both technical structure and macro fundamentals aligned, this setup offers high potential for trend continuation, and I'm anticipating a strong move toward 1.99 in the coming weeks.
$XLM Eyes Explosive Rally After BreakoutXLM has officially broken out of its long-term falling channel!
After months of lower highs, the breakout flips the trend bullish, with a projected move toward $0.64 (+120%).
Now consolidating just above the breakout zone. A clean hold here could be the start of something big.
Next target: $0.64 🚀
DYRO, NFA

$ONDO Ready to FlyONDO retested the breakout trendline and bounced from a strong demand zone 0.84–0.87.
If the retest holds, bulls could target $1.20 / $1.63 / $2.14 a potential 135% move!
Watch for confirmation & volume spike.
Invalid below $0.8060
DYRO, NFA

$ORDI/USDT Breakout Alert!$ORDI/USDT Breakout Alert!
After months of a brutal downtrend, ORDI has finally broken the descending trendline with strong bullish momentum. 👀
Entry:- CMP
Targets:- $ 10, $16, $23, $32, $49
Stop loss:-5.67
Risk/Reward looks 🔥 if this move holds.
Eyes on continuation! 🚀

HelenP. I Bitcoin will fall to support zone and then start riseHi folks today I'm prepared for you Bitcoin analytics. This chart shows how the price continues to trade inside a rising channel, with the price currently hovering just above the support zone around 101000. After forming a clean consolidation phase near the upper boundary of the structure, the market is showing signs of a potential pullback toward this zone. However, the broader trend remains bullish, and as long as price holds within the ascending formation, this correction may act as a base for the next move higher. The consolidation structure formed at the top indicates that buyers are not rushing in aggressively, but they are also not allowing prices to drop sharply, a classic sign of accumulation. This aligns well with the previously confirmed trend line and horizontal support zone. If BTC holds this area and finds renewed momentum, I expect a breakout from the consolidation range to the upside. My goal remains at 107000 points, which sits a little higher than the projected top of the current channel. Given the strength of the structure, the higher lows, and the recent defense of support, I maintain a bullish bias and anticipate another upward wave from this level. If you like my analytics you may support me with your like/comment ❤️

$EGLDUSDT Long Setup BINANCE:EGLDUSDT – Long Setup 🚀
TF: 1H | Pattern: Falling Wedge
Entry: $19.00–$19.20
SL: $18.53
Targets: $19.90 / $20.70 / $21.58
Bullish breakout
