USDT DOMINANCE: RISING WEDGE.Hello traders, let's read a quick update on USDT Dominance in 6 hours TF.
USDT.D has recently formed a rising wedge pattern and currently getting rejected from the resistance. If this resistance is good to be true then we may expect a drop toward 6.62% support level, nearly a 10% drop. This drop will be enough to bring some green rallies to the market.
Keeping a close eye on it. Let us see how it plays out till the daily close.
Trade safely.
Usdtd

USDT DOMINANCE: A REJECTION.Hello traders, I hope you all are doing well. Here's a quick update on the USDT dominance.
Timeframe: 12 hours.
Recap: In my previous update, we talked about the USDT.D forming a symmetrical triangle pattern in a daily timeframe. Well, looks like the dominance is leaning towards the downside.
Update: In this 12 hours timeframe, we can see a rejection taking place from the 7.2% resistance level. If it is an actual rejection then I am expecting the dominance to reach down to the lower support level (5.8%). This means a good rally in the market.
We still have 1 hour left for the daily close so, we will wait for that before jumping to any conclusion. This daily close will be interesting to watch so keep a close eye on it and be prepared for some action.
I hope this idea is helpful to you. And as always, thank you so much for your support.
God bless and trade safely.

#USDT.DOMINANCE 30M UPDATE !!Hello dear traders, we here new so we ask you to support our ideas with your LIKE and COMMENT, also be free to ask any question in the comments, and we will try to answer for all, thank you, guys.
DOMINANCE UPDATE:-As we see the Bart pattern forming in the Dominance, the Dominance suddenly dumps and we see bearish RSI in the Dominance, so here we expect the Dominance to Dump. What do you think in the comment section? Tell me
This is not a piece of financial advice. All investment made by me is at my own risk and I am held responsible for my own profit and losses. So, do your own research before investing in this trade.
Thanks for your time, we hope our work is good for you, and you are satisfied, we wish you a good day and big profits.
THANK YOU.

USDT.D inverted head and shoulders#USDT.D
The dominance of USDT is inside a descending channel, and below the upper line of this channel.
also as you can see it shaped an inverted head and shoulders.
🐮 the neckline of H&S pattern is the same with upper line of channel, so breaking out from this resistance can increase dominance toward resistance zone around 8.5%, that will cause more fall in crypto market.
🐻 rejection from upper line of channel can reverse the short-term trend and possible to drop to lower line, and as you know this move will cause reversal in crypto market and crypto will move upward.

SECRETS the USDT.D chart can reveal - Crypto Bullish or Bearish?Hi Traders, Investors and Speculators 📈📉
Ev here. Been trading crypto since 2017 and later got into stocks. I have 3 board exams on financial markets and studied economics from a top tier university for a year. Daytime job - Math Teacher. 👩🏫
In today's video analysis, I share with you the SECRET of the USDT.D chart, that otherwise seems irrelevant in predicting the ENTIRE crypto market direction... right? Watch this video to find out what the USDT chart can reveal about the general trend of Bitcoin and altcoins / TOTAL cryptocurrency market cap. I also use one of my favorite technical indicators, the correlation coefficient.
Now , you might wonder, why are market caps relevant? In general, the higher the market cap of a cryptocurrency, the more dominant it is considered to be in the market. For this reason, market cap is often regarded as the single most important indicator for ranking cryptocurrencies. The market cap of a cryptocurrency is determined by the current price multiplied by the circulating supply.
The market cap of a cryptocurrency more or less reflects the popularity of a coin over a longer term and can reveal how much market participation there is in a specific asset.
Large-cap cryptocurrencies are generally considered to be safer crypto investments. These are companies with a market cap of more than $10 billion. Investing in coins with large market capitalization is usually a conservative strategy. These coins are likely to be less volatile than other cryptocurrencies but still more volatile than traditional assets like stocks. Mid-cap cryptos (think top 20ish altcoins) are more volatile but also have a lot more growth potential than large-cap cryptocurrencies.
Micro-cap cryptocurrencies are extremely volatile and considered a highly risky investment, even though they may sometimes have a lot of potential (short-term) growth. However, be aware that they may also crash, literally from one minute to the next. They are also popular for pump and dump schemes, and liquidity rug-pulls.
_________________
📢Follow us here on TradingView for daily updates and trade ideas on crypto , stocks and commodities 💎Hit like & Follow
We thank you for your support !
CryptoCheck

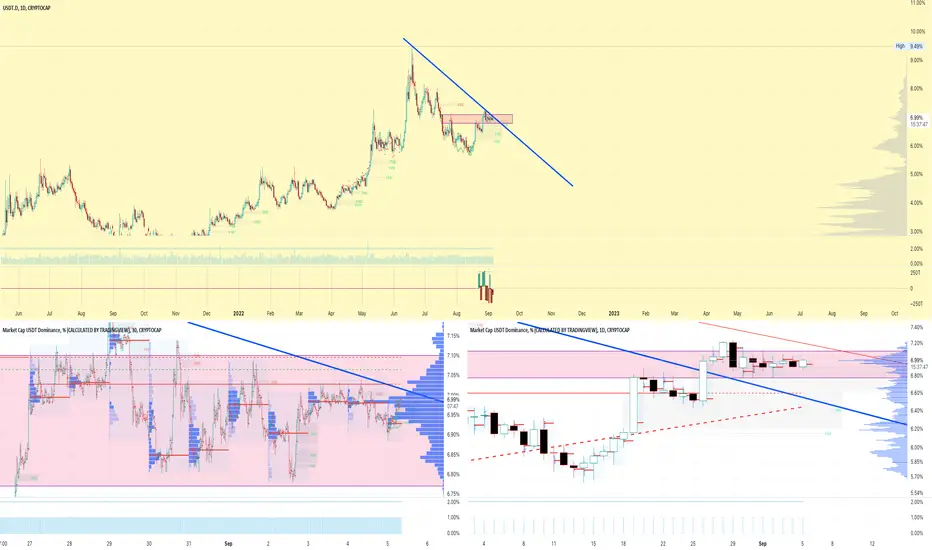
USDT DOMINANCE: A DECISION TO MAKE.Hello traders, here's a fresh update on USDT dominance in the daily timeframe.
Recap: In my previous USDT.D update, I mentioned the bounce back from the 5.8% support level. The dominance did pull back but dropped back to the supporting trendline.
Update: Currently, in the daily timeframe, the USDT.D is under the symmetrical triangle formation. We all know that the symmetrical triangle pattern is always a decision pattern where the price either goes up or goes down depending on the condition. Therefore without complicating the chart, I would like to keep it simple for you all.
The key levels for USDT dominance:
1. 7.15% resistance level: If the USDT.D manages to break above 7.15%, things will not be good for the market.
2. 6.45% support level: If the dominance breaks down below it then the market will pump hard.
Therefore, it is important to keep your eyes wide open and trade with proper risk management.
I hope this idea is helpful for you. Thank you so much for your support.
God bless and trade safely.

USDT.DIf the price engulf S1 i can say probably we are gonna see 28000 at S2 !
TIP : BTCUSDT and USDT.D have advers conection !

USDT dominance continues to grow!Hello trader Today I prepared a new idea for you. Like and subscribe to the channel there is a lot of useful information✅
Two weeks ago, I already published this chart, my expectations were for the breaking of the trend line, well, as we can see, we have successfully rebounded from it, which does not affect Bitcoin in the best way.
This chart shows that most players in the market hold their assets in Usdt and are not going to buy yet, or they are just selling and looking for the best moment to buy, most say that the bottom of bitcoin has not yet been found! And what do you think?

USDT DOMINANCE: WHAT IF???Hello traders, I hope you guys are doing well. Here's an update on the USDT dominance.
Timeframe: 2 days.
Update: The USDT.D is moving towards the upside and if it is good to be true then get ready for another dump in the market. There are three vital points that lean towards the bullish move in USDT.D:
1 . The USDT.D recently bounced back from its support level.
2. In 2 days TF, the dominance is above the 21 MA.
3. The RSI shows a hidden bullish divergence.
Until and unless, The USDT.D breaks down the 6% support level or we can say the supporting trendline, the market can't be positive. I am going to stick with this chart and observe it and also do some scalping in between.
What do you think about the USDT Dominance? Let me know your views and ideas in the comments.
Thank you for reading and supporting me.
Trade safely.

USDT.D at decision point... Hey.. up or down for USDT?! This is the big questions for now... very interesting point at the moment.. what is ur view?
USDT dominance is giving good vibes.Hello everyone,
Another 30/50 days to see a total transformation.
Enjoy.

USDT.D - I found fractal. Bitcoin will be 14 000$
to create the idea, I used my custom finobachi, degree system and cycles. The most important thing you can see here is the fractal. It clearly shows what can happen with bitcoin with a high degree of probability and with a small degree of probability this may not happen. Accept that there will be a bull trap soon and after that we will fall heavily to $12-14000 and possibly even lower. I have identified fractal bottoms, accumulations, highs and patterns that are similar to each other. The result is the same after the transition of Ethereum to proof stakes and a strong increase in the FRS rate, we are in for the strongest collapse in the history of BTC.
For those who do not know, the rise of tether dominance means the fall of bitcoin and vice versa
BTC WILL BE PUMP 27 December (week candle)

TETHER DOMINANCE correction ❌🧨Hello 🐋
Based on the chart, the price is close to the resistance zone ✔️👌
if
the price doesn't break the resistance zone to the upside, we will see more correction to the downside ❌🧨
Please, feel free to share your point of view, write it in the comments below, thanks 🐋

USDT DOMINANCE: I AM STILL STICKING WITH THE PLAN.Hello traders, I hope your weekend is going well. Here's a quick update on USDT dominance.
Timeframe: 1 Day.
Recap: In my previous update, I mentioned the H&S pattern in USDT.D. It was going all good but the FED news happened.
Update: The USDT.D showed an 11% spike after the FED news, technically dropping the entire market. Yet, it hasn't managed to break through the resistance level of 7.15% which makes this chart still valid. Things will possibly go negative if the USDT.D breaks out and closes above the 7.15% resistance level. So, until and unless, the USDT.D stays below this level, the H&S pattern will remain valid. It may sound crazy but I am sticking with my plan.
Key level: 7.15% resistance level.
What do you think about the USDT Dominance current move?
Do let me know in the comments.
Trade safe.

USDT.D below resistance zone break or make?#USDT.D
USDT Dominance is below resistance zone that is the same with the middle line of descending channel.
🐻 as long as it stays below the resistance zone crypto market will rise!
🐮 break out from the resistance zone will increase USDT Dominance to the upper line of channel and we will see more crashes in the crypto market!

USDT DOMINANCE: HEAD & SHOULDER PATTERN.Hello traders, I hope you guys are doing well. Here is a quick update on USDT dominance.
Timeframe: 1 day.
Recap: In my previous video, I mentioned 7% to 7.13% as resistance levels. According to the chart, the dominance reached 6.9% and then a slight rejection.
Update: To confirm an actual drop in the USDT.D, it has to break below two important levels-
1. The 21 MA at 6.2%, and
2. 5.7% support level.
Now, if the dominance drops to 5.7%, it will be more than enough for BTC and other altcoins to gain a good rally. And if this H&S pattern is so good to be true then we will witness a good rally in the market.
Key levels: 21 MA and 5.7% support level.
I hope this update was helpful. Do like, share, and comment. I would love to know your ideas on this one.
Trade safely and thank you for your support.


#USDT.DOMINANCE UPDATE 1DAYHello dear traders, we here new so we ask you to support our ideas with your LIKE and COMMENT, also be free to ask any question in the comments, and we will try to answer for all, thank you, guys.
USDT dominance analysis:-
USDT dominance after break of structure is making lower lows and lower highs and it bounced from the previous higher low support after creating a lower low.
Currently it is in the formation of making lower high and a down move is expected from the marked lower high box and that would be a bullish sign for the market as it works inversely proportional to the crypto market.
This is not a piece of financial advice. All investments made by me are at my own risk and I am held responsible for my profits and losses. So, do your own research before investing in this trade.
Thank you for your time, we hope that our work is good for you, and you are satisfied, we wish you a good day and big profits.
Thanks.

#ETH/USDT 4HOUR UPDATE !!Hello dear traders, we here new so we ask you to support our ideas with your LIKE and COMMENT, also be free to ask any question in the comments, and we will try to answer for all, thank you, guys.
ETH/USDT UPDATE !!
ETH broke the local support and as expected dumped towards the $1600 support area. This is the key level to hold otherwise we see a heavy sell-off in the market. The next major support is the $1400-$1450 and Ethereum resistance area $1731 -$1832
Remember:-This is not a piece of financial advice. All investment made by me is at my own risk and I am held responsible for my own profit and losses. So, do your own research before investing in this trade.
Thanks for your time, we hope our work is good for you, and you are satisfied, we wish you a good day and big profits.
THANK YOU.

USDT DOMINANCE: WARNING WAS GIVEN.Hello traders, I hope you guys are safe and sound. The market took a major drop as expected and if you have followed my previous USDT dominance update then you are safe.
Here's a quick update on USDT dominance.
Timeframe: 6 hours.
Recap: The USDT.D did break out immensely with a straight 11.8% pump from the breakout point.
Update: The warning was already given in my previous update and if you have actually followed it then you are in profit. The recent gain in the USDT.D is quite impressive but as we all know that nothing goes up or down all the time. The USDT.D is already 11.8% up and as per the analysis, we have the resistance level between 7% to 7.13%. That could possibly be a decent rejection area for the dominance.
RSI: The RSI is in the overbought zone which indicates a rejection to be somewhere around the corner.
Accumulation zone: If the USDT.D assures a rejection then we can start accumulating the market on spot.
I hope this update was helpful to you. Do like, share, and comment to support my ideas.
Thank you.

#USDT.DOMINANCE 4Hr UPDATE !!Hello dear traders, we here new so we ask you to support our ideas with your LIKE and COMMENT, also be free to ask any question in the comments, and we will try to answer for all, thank you, guys.
USDT dominance analysis:-
Dominance has been rejected several times by this resistance, so we expect it to be rejected this time too, but dominance is falling, and the wedge pattern remains. If the upper side is broken, the altcoin dumps
This is not a piece of financial advice. All investments made by me are at my own risk and I am held responsible for my profits and losses. So, do your own research before investing in this trade.
Thank you for your time, we hope that our work is good for you, and you are satisfied, we wish you a good day and big profits.
Thanks.

USDT DOMINANCE: THIS ISN'T GOOD!Welcome traders to this USDT Dominance update.
Timeframe: 6 hours.
Update: This break out right there, isn't looking good to me. It looks scary and if it doesn't drop down leaving a shadow behind, then the market will bleed bad. For the last 30 days, the USDT.D was under a falling wedge pattern and today it has broken above it. This means the market is on the red alert and we the trader should trade safely.
Conclusion: We still have 4 hours and 30 mins left for this candle to close so either we can wait for confirmation or close positions accordingly. For the last couple of weeks, I was out of trades so currently, I am not holding any positions. If you are stuck in any trades with heavy losses then you better be careful. Always use SL to be on the safer side.
I hope this idea was helpful to you.
Trade safely.

#USDT.DOMINANCE 4Hr UPDATE BY CRYPTOSANDERS !!Hello dear traders, we here new so we ask you to support our ideas with your LIKE and COMMENT, also be free to ask any question in the comments, and we will try to answer for all, thank you, guys.
USDT dominance analysis
If USDT dominance follows this then we may see a big dump in the BTC price.
This is not a piece of financial advice. All investments made by me are at my own risk and I am held responsible for my profits and losses. So, do your own research before investing in this trade.
Thank you for your time, we hope that our work is good for you, and you are satisfied, we wish you a good day and big profits.
Thanks.
