USDT.D fractal 2019#USDTD
here is another look of #USDT dominance, that I hope it go this way.
a fractal from 2019 that shows it will have a smooth downtrend to the support.
Usdtd

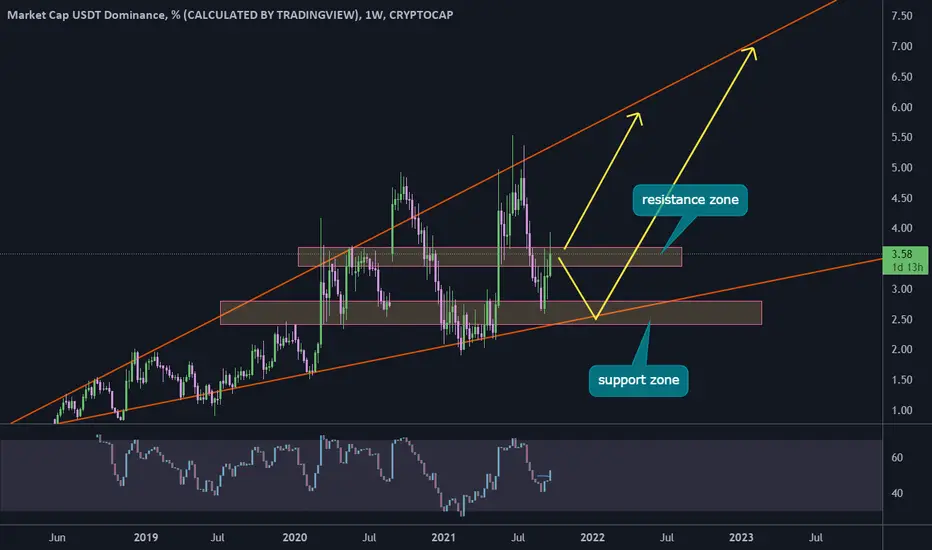
USDT.D struggle to break the resistance#USDTD
USDT Dominance seems struggle to break out the resistance zone. if it won't success to close a daily candle above resistance zone, then it is possible to dump to the support zone again, which this way make a good opportunity for #BTC to increase.
and if USDT Dominance success to break the resistance, then it will pump the ascending resistance line around 6, that is a dump for $BTC.
USDT.D Dominance usdtUSDT.D pump coming so btc dump coming ................................................................................................................................................................................................................................................................................................................................................................................................................................................................................................................................................................................................................................................................................................................

USDT.D UPDATE - Could be heading back to $4.69 or $4.83re charted USDT.D on the (weekly) based on its recent pump, doesn't look good for BTC in the upcoming weeks, but anything is possible, tread lightly with longs on BTC/ALTS but USDT.D is bullish on the weekly as of right now.
*Could be heading back to $4.69 or $4.83
*every $0.33 USDT.D goes up or down, that's roughly $5,000 gain/loss for BTC
*USDT.D goes up BTC goes down & vice versa
*By DEC 6, 2021 USDT.D should already be at the top of the reverted triangle by then, based on divergence and oscillators.

USDT.D - Where is it going ? Interesting what this could do, as you all know, BTC movement is the opposite of USDT.D
Another dump happening for BTC? who knows...we'll see

USDT DOMINANCE SPIKE: RELIEF RALLY SOON FOR ALTS/BTC?USDT Dominance measures USDT market cap against all other coins. While not as potent as BTCD or TOTAL2, it can be a helpful indicator to know what traders are doing, as many of them use USDT over fiat.
Obviously, when BTC sells off, USDTD spikes. Based on a little TA, we might expect a relief rally for the market soon. USDT is basically at resistance, but it did put in a slightly higher high. Recent volume is decreasing, signaling a reduction in selling pressure.
RSI is nearly at Overbought levels (which would be considered oversold for the rest of the market)
Just remember - When you think BTC can't go any lower... it always can.
Happy trades,
CD

usdt.d 4h scalewe predicted the index downtrend movement on the top and now it have happened, as we predicted the support zone chane it duty to the resistance and here we have faced to this resistance.... if it will broke we gonna back to uptrend move again and if not, lower support level is recognized and visible in the chart

3 scenario for USDT.DUSDT DOMINANCE is one of the factors indicating the direction of the market, which is now on its 200-day moving average, and from here we have three scenarios for it. This index along with the total market index can be used to find the general direction of the market.

USDT/D Dominancewill be pump and BTC will be dump ......................................................................................................................................................................................................................................................................................................................................................................................................................................................................................................................................................................................................................................................................................................................................................................................................................................................................................................................................................................................................................................................................................................................................................................................................................................................................................................................................................................................................................................................................................................................................................................................................................................................................................................................................................................................


How far will crypto drop, usdt.d analysisRememer when usdt goes up crypto goes down.
you can cleary see resistance on the weekly timeframe on usdt.d. The question is where crypto will continue the bullrun we previously had. Maybe this gives a small indication.
If we break current resistance a retest to the next level of resistance is expected. However for crypto to be bullish again we have to reject this resistance, maybe bitcoin will be at 28k(yearly support on btc) at this time. But if we break out of this top level resistance, i'm afraid we may see some more downside in the coming months.

BTCUSDT Pattern June 1A double bottom is happening on BTCUSDT chart, It is not completed yet
Also we can see a triangle, If price breaks through the top line of the triangle then we can see also that double bottom pattern is working.
When BTC wants to break some price level, it breaks it in fast movement
You can see the targets on chart
Also:
- A double bottom is happening in Total Market Cap
- A double Top is happening in USDT Dominance
None of them are completed yet but I think it will.
" I can see a big head and shoulders too but I think it does not happen, Not now with the fact we have, Not if the supports are not lost. "

USDT.D due for short term retrace... Then what??Chart is pretty self explanatory. Notice the bearish cross on Stoch RSI, indicating we should see a short term pullback & some relief for BTC/Alts.
However, If USDT.D continues it's reversal by breaking out from the current descending channel, BTC/Alts will continue to bleed.
If USDT.D continues to trend downward, expect upside for crypto to resume.
happy trades,
CD

BTC.d, Defi and the future.Posting it here just in case so if that happens I can say "I told you so".
Don't get deceived by Defi, it's making its first experimental growth, there will be blood when everything gets unlocked.
Defi is a tool for a bubble creation, MONEY MAKES MONEY OUT OF THIN AIR ==== CRYPTO MAKES CRYPTO via DEFI PASSIVE REWARDS.
Timing can be wrong of course, but you get the idea of what's coming. Enjoy.

USDT Dominance Chart Looks Bullish: An Alert for Crypto Market!USDT.D (Tether Dominance) looks bullish on the daily time frame. If the fractal plays out I expect a correction in the crypto market following Bitcoin as the assets flowing into USDT from other crypto coins and tokens. This scenario depends on the completion (A candle above the neckline) of the double-bottom pattern formed in the last two months.

#CRYPTO MARKET GO TOO #MOONCRYPTO MARKET
CAN GO TOO MOON
WITH THIS SIGNAL
1- break uptrend line
2- Como red cloud formation
3- Chico Span ready to come under the como cloud


USDt dominance down - BTC pump?The triangle stock pattern is a versatile chart pattern that is viewed as a continuation pattern and a reversal pattern at the same time.
Looks the triangle broke and that trend line as well. When USDT dominance is going down to the support line, Bitcoin prices going higher and vice versa. USDT Dominance is showing a strong convergence signs on 2h or 4h time frame. We will have to see how it settles over the next couple of days to figure out where it is going from here.
