Crypto is going highUSDT.D is quite weak lately.
If a red candle closes below the pink box, you can buy more crypto.
This is just for entertainment to hit "Play" in the future and see how right or wrong I was :)
Usdtd

USDT.D Retests Breakdown: Is a Strong Altcoin Rally Ahead?USDT Dominance (USDT.D) has broken below its rising trendline and is trading at a key support zone after a successful retest of the breakdown. A break below this support could trigger a sharp decline, signaling capital rotation into altcoins.
This setup aligns with the potential for a strong altcoin season and an active trading period ahead.
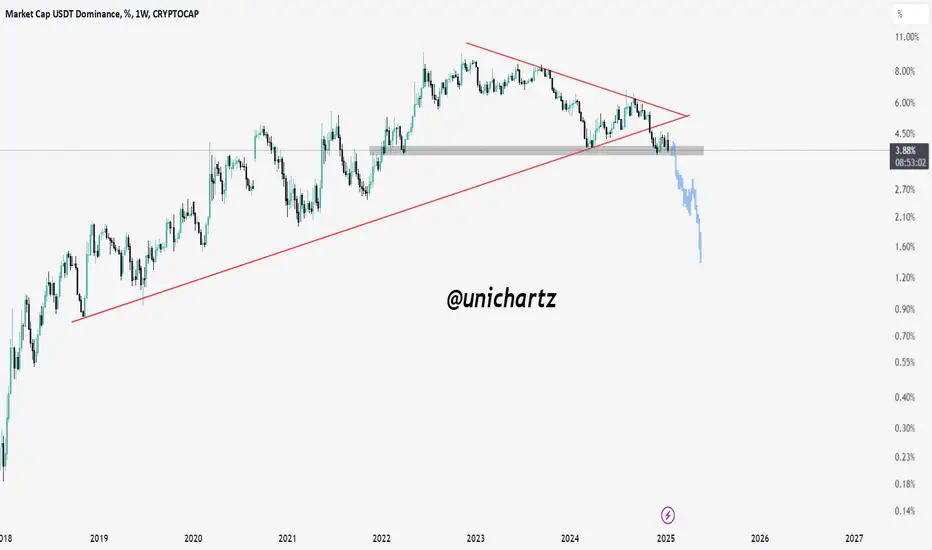
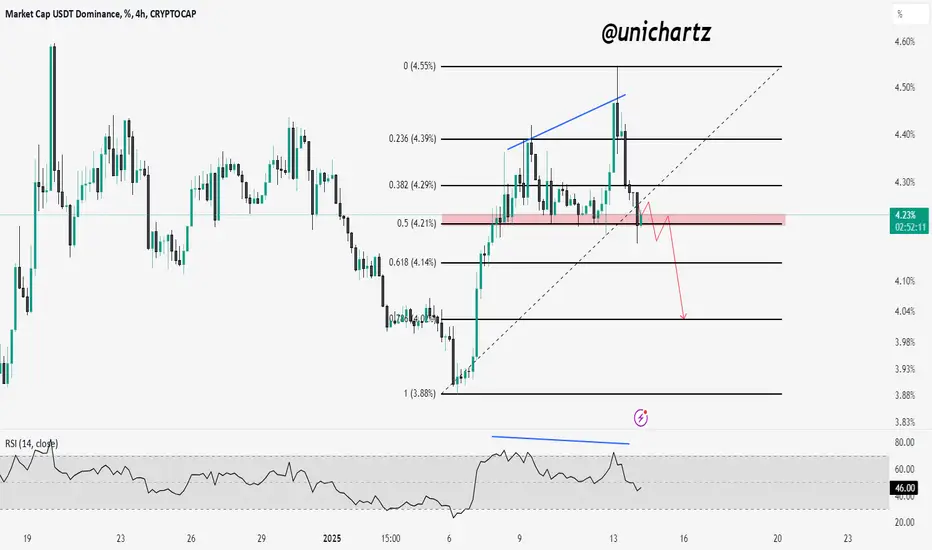
USDT.D at Key Support: Altcoin Bull Rally Ahead?USDT.D has repeatedly bounced off the marked red support zone, a strong Fibonacci level at 0.5. This support has been tested multiple times, and based on my experience, I anticipate USDT.D may break below this zone. If it does, it could trigger a bullish rally in altcoins.
I believe this is the final shakeout phase, so stay strong and focus on accumulating fundamentally solid coins. Remember to maintain discipline and practice strong money management.
USDT.DOMINANCE CHART UPDATE !!This chart provides USDT dominance, highlighting key patterns and potential market implications:
Head & Shoulders Pattern:
The chart shows a completed Head & Shoulders pattern, indicating potential bearish momentum for USDT dominance. This often signals a rotation of capital away from stablecoins and into riskier crypto assets.
USDT dominance has broken the neckline support of the Head & Shoulders pattern and is moving toward the green horizontal demand area. This area represents a crucial support area near 2.0%-2.5%.
Resistance: The neckline and the descending trendline around 4.25% now act as resistance.
Support: The green demand area near 2.0%- 2.5% is crucial. A sustained move into this area could coincide with a strong crypto market rally.
A continued decline in USDT dominance indicates growing confidence in the crypto market, with investors pouring funds into altcoins and Bitcoin.
Conversely, any improvement in USDT dominance could indicate an increase in risk aversion.
Let me know if you’d like further assistance or adjustments!
DYOR. NFA

USDT Dominance Falls, BTC Rises: What It Means for TradersThe chart highlights the inverse relationship between BTC/USDT and USDT.D (Tether Dominance). When USDT.D drops, capital flows out of stablecoins into Bitcoin, driving BTC’s price higher.
Conversely, a rise in USDT.D signals increased caution, often leading to BTC price declines. This correlation helps traders gauge market sentiment and identify potential trend shifts.

USDT Dominance Rises: A Warning for Long Positions on AltsStay cautious with your long positions as USDT Dominance (USDT.D) is gaining strength, which is a bearish signal for altcoins

Capital Shifts in Crypto: Liquidity, Corrections, and the FutureOn a growing market, each correction serves as a mechanism for capital redistribution. In the cryptocurrency sector, where the market is relatively small, profit-taking on major assets like Bitcoin (BTC) and Ethereum (ETH) has a significantly negative impact on less capitalized altcoins.
Analogy with traditional markets
Traditional financial markets follow similar principles. Here, Bitcoin can be compared to gold, while altcoins are akin to stocks or bonds. When positions in gold are closed, the fluctuations are less noticeable due to the market's greater liquidity and volume. However, stocks, with their lower capitalization, show significant volatility, leading to an equivalent increase in potential dollar gains.
Depth and structure of the crypto market
The crypto market still lacks depth, predominantly involving small-scale investment funds by global standards. Competition among expert traders and investors is limited, leading to low profitability or zero gain on bear markets, where professionals trade against each other, for instance, Wintermute traders against GSR traders. In traditional markets, where both professionals and retail investors participate, professionals have an advantage due to more variables.
Liquidity and spread
Both markets allow for earning on the spread, although currently, spreads are relatively small. The redistribution of liquidity, especially during market downturns, is driven by both psychological factors and the technical aspects of position closing, particularly when comparing futures trading with combined spot and futures trading.
Indexation and synthetic assets
The creation of indexes in the crypto sphere could be the next step. There are already examples like Reserve Rights (RSR), where real-world assets are tokenized to create stablecoins. Forming indexes similar to the S&P500 or US100 could combine crypto assets by similar characteristics, increasing liquidity and opening new investment avenues. However, this could lead to issues similar to those in 2007 in traditional markets, where "packages" included high-risk assets.
Conclusion
Implementing such tools might soften the liquidity redistribution effect for retail investors but could complicate things for funds and market makers, reducing their ability to buy assets at reduced prices. The cryptocurrency market is at the stage of mass adoption, and upon completion of this process, new forms of digital money may emerge.
Written by Alexander Kostenich (WIDECHAR),
Horban Brothers.

USDT.D is poised for a quick collapseAltcoin season is just around the corner, with all the new USDT being printed to pump altcoins and BTC realizations to further spill over to other assets. USDT.D is waiting for a huge collapse and fall into the 2% area. Let the altseason begin!
Horban Brothers.

USDT going under water.Check USDC reports backed by black rock. If you are holding USDT please please convert them into USDC. Check my bio to know more.

USDT.D Update. USDT dominance (USDT.D) appears to form a descending triangle or wedge pattern, with two converging trendlines indicating a potential breakdown.
The upper trendline is descending, indicating consecutive lower highs.
The lower trendline is relatively flat, but rising slightly.
USDT.D is approaching the lower trendline, indicating potential support.
The path drawn indicates a potential breakdown below the lower trendline.
Downward continuation is anticipated in the orange zone (3.40%–3.10%).
Resistance: ~4.20%
Support: ~3.90% and orange zone around 3.40%–3.10%
If USDT dominance falls, it usually suggests that traders move capital from stablecoins (USDT) to riskier assets like Bitcoin or altcoins, indicating a potential bullish sentiment in the broader crypto market.
Let me know if you’d like further assistance or adjustments!
DYOR. NFA

Altcoins Dump as USDT.D Gains Strength: What to Do Next?USDT.D has broken above the symmetrical triangle pattern and is gaining strength, which is a bearish signal for altcoins.
As USDT.D strengthens, altcoins are experiencing a sell-off. It is advisable to avoid opening long positions in the current market environment.
Instead, consider focusing on stablecoin or staying out of the market for a few days to minimize potential losses.

Will USDT.D Rejection Spark an Altcoin Rally?USDT dominance is nearing a key resistance trendline while holding above critical support.
A rejection here could signal increased capital into altcoins, boosting their prices. However, a breakout above the trendline may pressure altcoins further.
Watch closely for the next move!
DYOR, NFA

USDT.D Testing Critical Resistance: Breakout or Pullback?USDT.D has recently broken out of a falling wedge pattern, indicating a potential shift in momentum. The price is currently testing a critical resistance zone near 4.30%. A breakout above this level could signal further dominance for USDT, suggesting risk aversion in the crypto market.
If the resistance holds, a pullback toward the 4.20% support zone is likely. However, a confirmed breakout could lead to a continuation of the upward trend, potentially targeting the 4.40% level.
DYOR, NFA


USDT Dominance Chart Analysis !4.50%–4.60% (orange zone): This level represents a crucial resistance zone, where previous upward moves have stalled. A breakout above this level will signal bullish momentum in USDT dominance, increasing risk-off sentiment in the market.
Primary Support: 4.10%–4.20%
This zone acts as a near-term support level. A breakdown below this could lead to a further decline in USDT dominance.
Secondary Support: 3.80%–3.90%
This is a crucial demand zone, where buyers have historically come forward. If the price reaches this zone, it could signal a reversal.
The 21-period MA (thin line) and 200-period MA (thick green line) are important indicators to watch. USDT dominance is trading near the 21 MA, while the 200 MA is below, indicating potential support.
Symmetrical Triangle Formation:
USDT dominance is consolidating within a triangle pattern. A break on either side (up or down) will determine the next significant move.
Upside Breakout: This could lead to a retest of the 4.50%-4.60% area.
Downside Breakout: This could lead to a decline towards the 4.10%-4.20% support, with a possible continuation towards the 3.80% area.
DYOR, NFA
@Peter_CSAdmin

Tether dominance is bouncing well#usdt #tether dominance has bounced after made bullish divergence in daily candlestick size in mid term and now made w bounce in LTF. Accumulation is fine. Strong #usdtd if continues this odyssey, will surely damage current #btc and #altcoins ' prices in LTF. Not financial advice.

USDT Dominance Analysis!!The area highlighted in yellow is around 3.80% to 3.90%, which aligns with recent higher lows and historical demand.
4.20%: Immediate resistance where the price is currently reacting.
The dashed line indicates 4.45%: Key resistance and potential target.
Descending resistance trendline: Broken upwards, indicating a bullish reversal.
200 MA (green line):
Acting as dynamic resistance, now broken.
The descending trendline and breakout above the 200 MA suggest that USDT dominance is gaining momentum.
The price may revisit the 4.00%–4.10% area for a retest before moving towards the 4.45% target.
If dominance sustains above 4.00%, continuation towards 4.45% is likely.
Keep an eye on strong candles and rising volume to validate the breakout.
A drop below 4.00% will invalidate the bullish setup, with a possible retest of the 3.80%-3.90% support area.
The chart shows a clear breakout from a downtrend, indicating a bullish bias.
Keep an eye on a retest of support and follow-up towards 4.45%.
Disclaimer: This analysis is for informational purposes only and does not constitute financial advice. Always conduct your research and consult a financial advisor before making investment decisions.
For updates on other coins or personalized insights, feel free to reach out via DM.
@Peter_CSAdmin

$COIN Coinbase fakeout and pump?Can't even explain why but I feel like something similar might happen. Looks a bit dumpy tho.
I wouldn't enter short. Just wait for this fakeout, might be local bottom. and Pump that would take CRYPTOCAP:BTC back up and further push down CRYPTOCAP:USDT.D
Might not even reach the entry price for long. ~295$

USDT.D retest 5.5%?USDT.D been falling for 90days with no real retests, this might be it.
Also fully completed previous projection of a Dump.
Fibb Golden zone around 5.5%
Also BTC looks like it's in Diamond Top pattern. If that plays out we might see CRYPTOCAP:BTC at $85k.
But this is Bullrun so probably some Elon musk post will randomly revive market out of nowhere and the dump will stop mid way.
Keep eyes on twitter.

USDT dominance chart grows stronger#usdt #tether dominance has bounced after bullish divergence and a W bounce emerged in LTF. #usdtd is now looking stronger. Upside movements will damage #altcoins and #btc #eth . Losing the double bottom zone at %3.90 is the invalidation. Not financial advice.

$USDT.D Has Fallen Off A CliffTrump's LANDSLIDE victory and Republican's controlling Congress has signaled full RISK-ON across the board in markets.
This has caused everyone to sell their stables for CRYPTOCAP:BTC and Alts.
Expect another 10% worth of CRYPTOCAP:USDT to be dumped into the market before we see a real correction.
This will put CRYPTOCAP:USDT.D ~3.8% which was the local top in March.
The correction should be short-lived as we make our way back down to 2-2.5%

USDT dominance chart update details: “death cross” has formed, where a short-term moving average (possibly the 50-day, shown in red) has crossed below a long-term moving average (possibly the 200-day, in green). This pattern typically suggests a bearish signal, indicating the potential for further declines in USDT dominance.
The overall direction appears downward, with USDT dominance testing lower support areas within a descending channel.
Key support levels are marked in green and gray. The current price level is slightly above the major support area around 5.0%. The chart suggests a possible continuation downward, with the next significant support area near 4.0%.
The large downward arrow indicates a bearish outlook for USDT dominance, suggesting potential further declines toward the 4.0% range if current support levels fail to hold.
This chart indicates that if USDT dominance continues to decline, this could correlate with a potential uptrend in the broader crypto market, as money flows from stablecoins into other assets.
Disclaimer: This analysis is for informational purposes and is not financial advice. Always stay updated with market movements and adjust your trading strategies as needed.
You can DM us for information on any other coin.
@Peter_CSAdmin

Tether dominance 's LTF bounceA bullish divergence has been forming in #tether #usdt dominance chart in lower time frame. A bounce may be expected. LTF bounce in #usdtd = minor correction in #crypto
