100% Win Rate on BTC & Alts! Where’s the Next Breakout?USDT Dominance Update:
While the herd chases the latest hype, we called this before it even unfolded. BTC’s recent surge was lightning-fast.
These were the trades shared in the last 30 days. I'm just saying we could've had more wins!
Our setups didn’t just hit targets…
They exploded through them 🚀
These are spot gains, imagine trading wth leverage with these.
There's more to come in the next week.
✅ MIL:ENA +53%
✅ HOSE:VIC +50%
✅ $CHILLGUY +40%
✅ NASDAQ:HUMA +35%
✅ CRYPTOCAP:XRP +34%
✅ $VOXEL +32%
✅ OMXTSE:MAGIC +30%
✅ CRYPTOCAP:RENDER +25%
✅ CRYPTOCAP:AVAX +24%
✅ SEED_DONKEYDAN_MARKET_CAP:FLOKI +25%
✅ CRYPTOCAP:LINK +17.65%
✅ CRYPTOCAP:SUSHI +17.3%
✅ AMEX:MBOX +15%
✅ $MAVIA +14.7%
✅ TVC:MOVE +11.66%
✅ $EPT +11%
✅ BME:ETC +10.3%
✅ PSX:POL +20%
✅ CRYPTOCAP:SUI +20%
✅ LSE:ONDO +7.5%
✅ SET:PORT +6.17%
✅ CRYPTOCAP:TON +3%
📈 These aren’t just simple trades; they’re alpha-backed calls.
If you’re still watching from the sidelines…
You’re watching others print.
Be patient and precise with your entries and exits. Never FOMO.
The market will bait you into bad timing if you let it.
A 4.4% drop in USDT dominance marks the start of a new altcoin season, but remember, BTC will steer this cycle.
More setups on the way.
Stay tuned.
Do hit the like button and share your views in the comments.
Thank you
#PEACE
Usdtdominance

TradeCityPro | Bitcoin Daily Analysis #125👋 Welcome to TradeCity Pro!
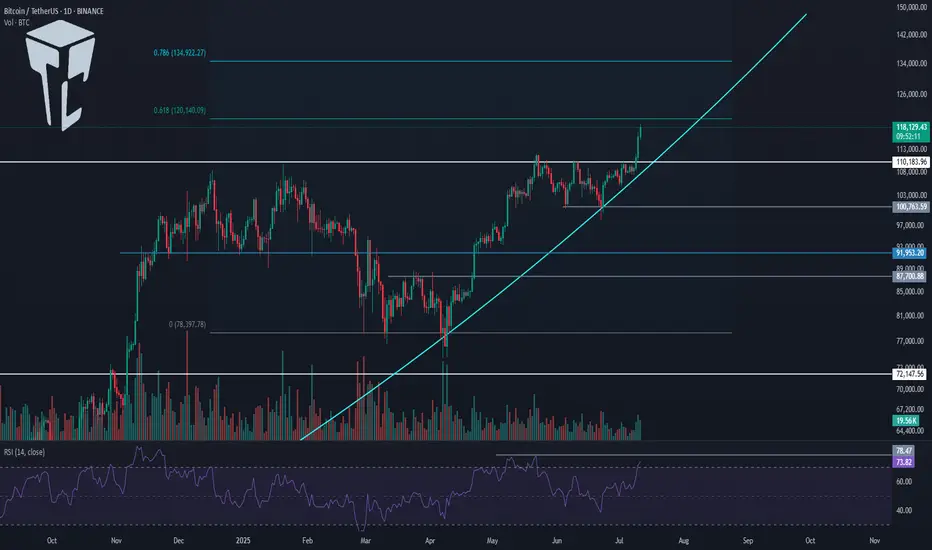
In this Bitcoin analysis, I want to switch to a higher timeframe and analyze the daily chart because a very significant resistance has been broken and it’s important to take a closer look.
📅 Daily Timeframe
On the daily chart, as you can see, a bullish trend started around the 80000 level and in the first leg moved up to 110183. After a prolonged correction, the price has now managed to break that previous high and begin a new bullish leg.
⚡️ As shown, volume was sharply decreasing during the correction phase, but in the past few candles, significant buying volume has entered the market, enabling the price to break above 110183.
💥 The RSI oscillator is entering the Overbuy zone in today’s candle, which could be a sign of continuation of this bullish move. The next RSI resistance is around 78.47.
🎲 Meanwhile, based on Fibonacci levels, 120140 and 134922 are key zones that could mark the end of this bullish leg. The price is currently very close to 120140, and we need to watch for the market's reaction to this level.
✅ If 120140 is broken, Bitcoin will likely head toward 134922. In that case, I believe this leg could be the final bullish leg of this bull run, since I’ve previously mentioned that my target range for Bitcoin in this cycle is between 130000 and 180000.
📊 The curved trendline I’ve drawn is very important in this leg. As long as the price remains above this trendline, the market momentum will stay bullish, and the likelihood of continued upward movement increases.
🔽 If this trendline is broken, we could see the first signal of a trend reversal. A close below 110183 would confirm that the breakout was fake, and a break below 100763 would open the door for a longer-term short position.
❌ Disclaimer ❌
Trading futures is highly risky and dangerous. If you're not an expert, these triggers may not be suitable for you. You should first learn risk and capital management. You can also use the educational content from this channel.
Finally, these triggers reflect my personal opinions on price action, and the market may move completely against this analysis. So, do your own research before opening any position.
TradeCityPro | Bitcoin Daily Analysis #126👋 Welcome to TradeCity Pro!
Let’s dive into the Bitcoin analysis and key crypto indices. As usual, in this analysis I’ll review the potential triggers for the New York futures session.
⏳ 1-Hour Timeframe
As you can see on the 1-Hour chart, Bitcoin started a bullish move after breaking the 111747 resistance, which continued up to 118494.
✨ Currently, the price is consolidating after reaching that resistance and has formed a range box between 116829 and 118494, fluctuating within this zone.
💥 The RSI oscillator has exited the Overbuy zone and is now near the 50 level. If it drops below 50, there is a possibility of a deeper correction.
⚡️ Confirmation of a deeper correction would come with a close below the 116829 level. The next support areas will be Fibonacci levels, which I have marked on the chart.
✔️ Since the SMA25 has reached the candles and there is no significant momentum yet, we’ll need to wait for the SMA99 to approach the price to see if momentum enters the market.
👑 BTC.D Analysis
Looking at Bitcoin Dominance, yesterday it reached the 64.18 support level and managed to bounce back, closing above 64.44.
🔔 Currently, it’s consolidating above 64.81, and if this holds, the trend could turn bullish for now.
📅 Total2 Analysis
Total2’s main resistance is at 1.33, but the price was rejected at 1.3 and is now correcting toward 1.26.
🔍 If the correction continues, the 0.382 and 0.618 Fibonacci levels would be reasonable areas to watch. If the upward move resumes, the next target will be 1.33.
📅 USDT.D Analysis
Tether Dominance has had a steep drop from 4.72 and has now reached 4.36. If support holds at this level, we could see a correction back toward Fibonacci zones.
🎲 A break below 4.36 would confirm continuation of the downtrend.

USDT Dominance Is Still Bearish (1D)This index is still bearish. It could either drop from here or turn bearish again after a pullback to a higher level.
The larger structure is bearish, and the price is breaking through structures in an attempt to reach the main demand zone. This bearish trend is expected to continue.
Let’s wait and see what happens.
For risk management, please don't forget stop loss and capital management
Comment if you have any questions
Thank You

CoinMarketCap chart and correlation with BTC
Hello, traders.
If you "Follow", you can always get new information quickly.
Have a nice day today.
-------------------------------------
(USDT.D 1D chart)
USDT dominance is showing a downward trend along the medium- to long-term downtrend line.
The decline in USDT dominance can be interpreted as an upward trend in the coin market.
Therefore, if it remains below 4.91 or continues to decline, the coin market is likely to enter a bull market.
The coin market is expected to show a major bull market until 2025.
At this time, the USDT dominance is expected to fall to around 3.42 and then rise, causing the coin market to enter a bear market.
Therefore, a major bear market is expected in 2026.
-----------------------------------------------
(BTCUSDT 1M chart)
You might think that it would be good if it continued to rise in a bull market, but in reality, that is not the case.
The reason is that if the price continues to rise, you have to buy more money.
Therefore, it will show a pattern of falling when appropriate and rising again when appropriate.
As I mentioned earlier, 2025 is a major bull market, so it will eventually show a rising pattern.
So, when should we buy and when should we sell?
It would be nice if we could know this a little bit faster, but we can never know.
Currently, BTC is renewing its ATH, so it is even more difficult to predict the movement.
Therefore, we can only predict it through predictable chart analysis techniques.
Among them, the method I use is to predict and respond to the high point using the HA-Low, HA-High indicators and the DOM (DMI + OBV + MOMENTUM) indicator using the Heikin-Ashi chart.
The DOM indicator indicates the end of the high and low points, and the HA-Low and HA-High indicators are used to establish a basic trading strategy.
The sky blue (#00bcd4) arrow is generated, indicating that the DOM (60) indicator is likely to be generated soon.
In other words, it means that the end of the high point is becoming more likely.
When the DOM(60) indicator is created, there is a high possibility of resistance, so the price is likely to fall.
Therefore, you should think about a countermeasure for the decline.
However, as I mentioned earlier, since 2025 is expected to show a major uptrend, it is recommended to sell in installments at an appropriate level to preserve profits.
The reason is that we cannot know how far it will fall.
The start of a full-scale decline is likely to begin when it falls below the HA-High indicator.
Therefore, if it falls after the DOM(60) indicator is created, we should observe whether a new HA-High indicator is created.
If a new HA-High indicator is created, the key point is whether there is support in the vicinity.
If a new HA-High indicator is not created, it is likely to fall to the current HA-High indicator location of 73499.86.
-
A trend line has been formed between highs, but a trend line between lows has not yet been formed.
Therefore, it is difficult to predict how far it will fall once the decline begins.
In the 2025 bull market, BTC is expected to rise to around the Fibonacci ratio of 2.618 (133889.92).
Therefore, we should also consider countermeasures for this.
------------------------------------------------
(BTC.D 1M chart)
When will the altcoin bull market start?
I think the timing is when BTC dominance falls below 55.01 and is maintained or continues to decline.
I think the rising BTC dominance means that the funds flowing into the coin market are concentrated toward BTC.
Therefore, we should consider that a market for trading BTC has been formed.
If BTC dominance fails to fall below the 55.01-62.47 range, BTC dominance is expected to rise to around 73.63-77.07.
At this time, it is highly likely that it will encounter strong resistance and begin to decline.
Since it has not fallen below the mid- to long-term trend line, it seems likely that it will continue to rise.
In order to eventually turn into a downtrend, BTC dominance must fall below 60.
If not, I think it will be difficult to expect an uptrend in altcoins.
----------------------------------------------------------------------
(BTCUSDT 1D chart)
This period of volatility is expected to continue until July 11.
Therefore, the key issue is whether there is support near 111696.21.
If there is support at the 111696.21 point, it is expected to rise to the right Fibonacci ratio 2.24 (116940.43).
If not, we need to check whether there is support near 108316.90.
As I mentioned in the previous idea, three conditions must be met to break through the 111696.21 point upward.
- The StochRSI indicator is showing an upward trend with K>D,
- The PVT-MACD oscillator is showing an upward trend (if possible, above the 0 point),
- The OBV indicator of the Low Line ~ High Line channel is maintained above the High Line,
If the above conditions are met, I said that there is a high possibility of a stepwise upward trend from the 111696.21 point.
-
The next volatility period is expected to occur around July 18 (July 17-19).
Therefore, we need to see if it can be maintained above 111696.21 until the next volatility period.
If it fails, we need to check if it is supported above the M-Signal indicator on the 1D chart, near 108316.90.
If not, it is likely to fall to the M-Signal indicator on the 1W chart or near 99705.62.
-
The basic trading strategy is to buy near the HA-Low indicator and sell near the HA-High indicator.
However, if the HA-High indicator rises, there is a possibility of a stepwise uptrend, and if the HA-Low indicator falls, there is a possibility of a stepwise downtrend.
The end of the stepwise uptrend is a downtrend, and the end of the stepwise downtrend is an uptrend.
That is, we can see that the support around the HA-High ~ DOM(60) section and the DOM(-60) ~ HA-Low section will be important turning points for the future trend.
----------------------------------------------------
On the USDT dominance chart, it seems likely that August 3rd will be the volatility period.
Looking at the BTC chart, it seems likely that August 2nd to 5th (August 1st to 6th) will be the pre-movement for the volatility period of August 1st to 6th.
-
Thank you for reading to the end.
I hope you have a successful trade.
--------------------------------------------------
- This is an explanation of the big picture.
(3-year bull market, 1-year bear market pattern)
I will explain more details when the bear market starts.
------------------------------------------------------

$USDT Dominance CRYPTOCAP:USDT dominance just broke down from a key pattern, and that’s a big signal.
It means people are likely moving money out of stablecoins and back into altcoins and Bitcoin.
If this drop continues, we could see a strong altcoin rally soon.
Keep an eye on it, altseason might be around the corner.
DYOR. NFA

TradeCityPro | Bitcoin Daily Analysis #124👋 Welcome to TradeCity Pro!
Let’s dive into the analysis of Bitcoin and key crypto indicators. As usual, I’ll review the futures triggers for the New York session.
⏳ 1-Hour Timeframe
On the 1-hour timeframe, as you can see, Bitcoin made a bullish move yesterday after stabilizing above the 109391 level and managed to register a new ATH around the 112000 level.
⭐ The resistance at 111747 has effectively held back further price increases, and the price has reacted to it and entered a corrective phase.
✔️ I believe the correction could continue down to 110256. The next lower support levels are 109391 and 107853.
📈 If you already have a long position open, I recommend holding it. If the 111747 resistance breaks, a strong bullish trend could begin, and having an open position from earlier could have a big positive impact on your account.
🔼 If 111747 is broken, we can consider opening new long positions. If this level breaks, I’ll post a higher timeframe analysis to identify the next major resistance levels.
💥 RSI entering the Overbuy zone and rising volume would provide strong confirmation for this position.
👑 BTC.D Analysis
Bitcoin Dominance is still dropping. Yesterday, after breaking 64.81, it continued its downward move and is now approaching the 64.49 level.
🔍 If this level breaks, the drop could continue further, but in my opinion, after the recent drop, it's time for BTC.D to enter a correction phase.
📅 Total2 Analysis
Total2 has also had a bullish move, breaking through the 1.18 and 1.2 levels, and continues to rise.
🎲 The next resistance is at 1.24, which the price may target. However, I think there’s a high chance of a correction or consolidation phase starting soon.
📅 USDT.D Analysis
Looking at Tether Dominance, after the recent drop and the break of 4.72, it reached the 4.63 level and has formed a base there.
✨ If 4.63 breaks, USDT.D could head toward 4.56. In case of a pullback, the first level to watch is 4.72.
❌ Disclaimer ❌
Trading futures is highly risky and dangerous. If you're not an expert, these triggers may not be suitable for you. You should first learn risk and capital management. You can also use the educational content from this channel.
Finally, these triggers reflect my personal opinions on price action, and the market may move completely against this analysis. So, do your own research before opening any position.

USDT DOMINANCE New Update (4H)By analyzing the chart, it becomes clear that the USDT dominance structure is bearish.
After the structural shift to a downtrend, with lower highs and lower lows forming, it is expected that the price will drop to the main support zone in order to collect major orders from lower levels.
The price could drop from the current level or from the upper supply zone, which would signal a bullish move in the overall market.
The target is the green box.
A daily candle closing above the supply zone would invalidate this analysis.
For risk management, please don't forget stop loss and capital management
Comment if you have any questions
Thank You
TradeCityPro | Bitcoin Daily Analysis #123👋 Welcome to TradeCity Pro!
Let’s dive into the analysis of Bitcoin and key crypto indices. As usual, in this analysis I’ll go over the trigger levels for the New York futures session.
⏳ 1-Hour Timeframe
On the 1-hour chart, as you can see, Bitcoin is currently below a resistance zone at 109135 and is approaching this level with strong bullish momentum.
⭐ If the price breaks and stabilizes above this level, we can open a long position. Both the volume and market momentum are confirming this setup well, but the main long trigger remains the breakout of 109135.
📈 If this bullish move turns out to be fake and the price starts heading downward, the first trigger we have for a short position is the 107853 level. A break below this level would give us an entry for a short.
👀 Overall, I think the market has been pretty straightforward lately, and we don’t need complex tools to analyze it. Just these support and resistance levels and simple triggers are sufficient.
👑 BTC.D Analysis
Moving on to Bitcoin Dominance, the 65.04 floor has finally broken, and dominance is now trending downward.
💫 The next support ahead is at 64.81, which the price is approaching. We’ll have to see how the market reacts to this level. For now, the trend of dominance in the 1-hour timeframe appears bearish.
📅 Total2 Analysis
Let’s look at Total2. With Bitcoin Dominance dropping and Bitcoin itself moving upward, Total2 has started a strong bullish leg and is heading toward the 1.18 level.
🔑 Many of the altcoins I’ve analyzed have triggered their entries, and as long as Total2 remains bullish, these moves can continue.
📅 USDT.D Analysis
Now to Tether Dominance. After breaking below the 4.76 level, it has now reached the 4.72 floor.
💥 A break below this floor could confirm continuation of the downtrend, but in my opinion, the price may pause here for some correction and consolidation.
❌ Disclaimer ❌
Trading futures is highly risky and dangerous. If you're not an expert, these triggers may not be suitable for you. You should first learn risk and capital management. You can also use the educational content from this channel.
Finally, these triggers reflect my personal opinions on price action, and the market may move completely against this analysis. So, do your own research before opening any position.

TradeCityPro | Bitcoin Daily Analysis #122👋 Welcome to TradeCity Pro!
Let’s dive into the latest analysis of Bitcoin and major crypto indicators. As usual, this update will focus on potential triggers for the New York futures session.
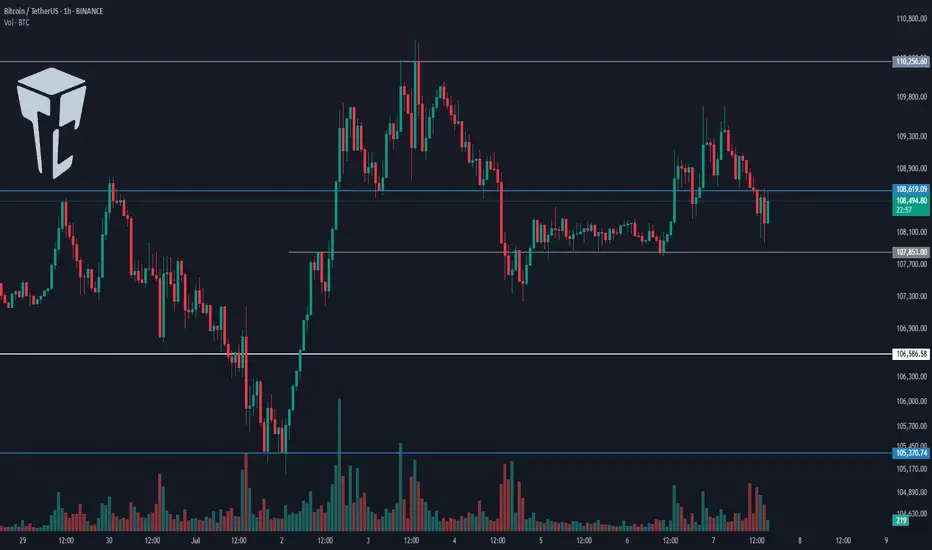
⌛️ 1-Hour Timeframe
On the 1-hour chart, Bitcoin is once again ranging between the 107,853 and 108,619 levels.
✔️ Last night, Bitcoin briefly faked out below the bottom of this range, so we now need to wait and see how the price reacts upon revisiting this area.
💫 I believe it’s best to hold off on entering a short position until we identify the precise location of the support line. As price retests this area, we can pinpoint the true support level.
✨ Once that level is confirmed, and if it breaks, a short position could be considered. The next support zones would be at 106,586 and 105,370.
📊 Make sure to watch the volume closely for this trade, and I strongly recommend waiting for a volume confirmation before entering.
📈 As for a long position, if 108,619 breaks to the upside, we could consider going long. The buying volume in the current upward leg is increasing, and if this trend continues, a breakout above 108,619 would make a long position reasonable.
👑 BTC.D Analysis
Moving on to Bitcoin dominance — it has once again reached its trendline and is currently being rejected from it. If this rejection continues, BTC.D could decline toward 65.04.
🔍 However, if the trendline breaks, the 65.31 level will be the bullish confirmation trigger.
📅 Total2 Analysis
Now on to the Total2 index (altcoin market cap excluding BTC), it has bounced from the 1.14 support and is moving toward 1.16.
🔑 A breakout above 1.16 would serve as a bullish confirmation for long positions, with 1.17 acting as the main breakout trigger.
📅 USDT.D Analysis
USDT dominance is also moving downward and has reached the 4.78 support zone.
💥 A breakdown below this level would confirm a bearish continuation toward the 4.72 level..
❌ Disclaimer ❌
Trading futures is highly risky and dangerous. If you're not an expert, these triggers may not be suitable for you. You should first learn risk and capital management. You can also use the educational content from this channel.
Finally, these triggers reflect my personal opinions on price action, and the market may move completely against this analysis. So, do your own research before opening any position.

TradeCityPro | Bitcoin Daily Analysis #121👋 Welcome to TradeCity Pro!
Let’s dive into the Bitcoin analysis and key crypto indicators. As usual, I’ll walk you through the triggers for the New York futures session.
⏳ 1-Hour Timeframe
As you can see on the 1-hour timeframe, the upward move Bitcoin made yesterday turned out to be a fakeout, and the price is now heading downward.
⚡️ I’m not moving the 108619 line for now. I’ll wait to see if the price reacts to it again in the future, then decide whether to adjust it.
✅ Currently, if the 107853 level breaks, we can enter a short position. We already have volume confirmation, and if this increase in volume continues, we could see a sharp downward move.
📈 Next support levels for Bitcoin in this timeframe are 106586 and 105370, which can be used as targets.
✨ If Bitcoin starts moving upward again, the long trigger remains the 110256 level. A breakout here would mark the beginning of a true uptrend.
👑 BTC.D Analysis
Bitcoin dominance continued its downward move today, dropping close to the 65.04 level.
🔼 We’re currently seeing a reaction at this level, suggesting some support. A break below 65.04 could trigger a strong downtrend.
📅 Total2 Analysis
This index is still in an uptrend but showing significant weakness. It’s currently sitting on key support at 1.15.
⚡️ A break below this level could give us a short position. Additional support levels are 1.14 and 1.13. For a long position, the only trigger we have right now is 1.17.
📅 USDT.D Analysis
Looking at Tether dominance, it’s still hovering around the 4.78 level. After a brief fakeout below, it has returned above that zone.
📊 If this level breaks again, Tether dominance could move down toward 4.72.
❌ Disclaimer ❌
Trading futures is highly risky and dangerous. If you're not an expert, these triggers may not be suitable for you. You should first learn risk and capital management. You can also use the educational content from this channel.
Finally, these triggers reflect my personal opinions on price action, and the market may move completely against this analysis. So, do your own research before opening any position.
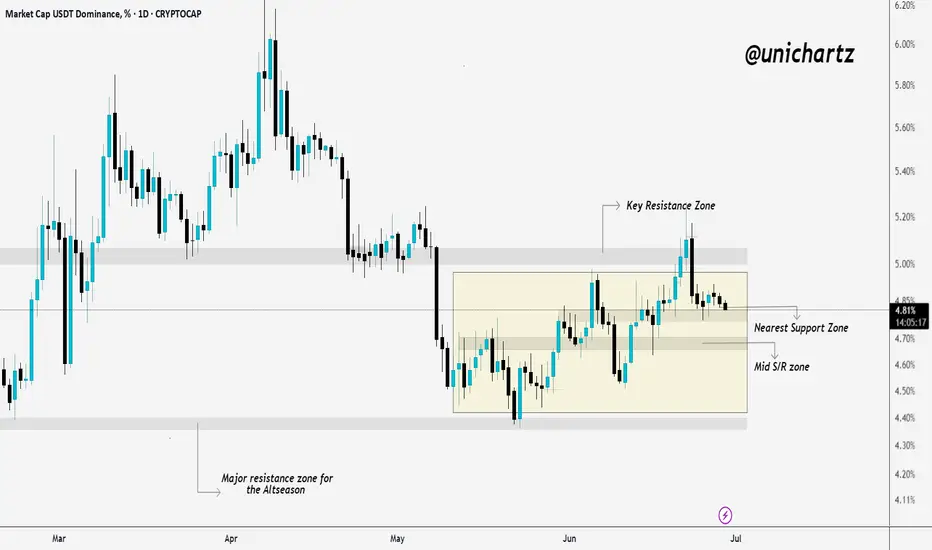
USDT Dominance Locked in Range – Altseason Not Ready Yet?USDT Dominance has been trading inside a wide sideways range for the last 567 days — bouncing between the 3.6% demand zone and the 6% supply zone.
The recent price action shows a rejection from the top of the range and now heading toward the mid or lower part of the channel. A minor trendline (in red) had shown some short-term support, but it looks weak now.
As long as this range holds, true altseason may remain on pause. The big move will come only when USDT.D breaks out or breaks down from this range.

Important Update on USDT Dominance.USDT.D Weekly Chart Update
Here’s an important update on USDT Dominance (USDT.D) on the weekly timeframe.
USDT.D has been showing signs of rejection lately, which is a positive signal for the market — although it’s definitely testing our patience. BTC is hovering around the $108K range, and it could accelerate at any moment, even without any major announcement.
According to the chart, we could see a potential 30% drop in USDT.D, which would give BTC enough room to push toward a new all-time high, likely followed by a strong bullish move across altcoins. If this scenario plays out, be prepared for some exciting weeks ahead.
However, if dominance turns green from the current level, it will still have to contend with the resistance trendline at around 5.66%. Therefore, for now, I will remain focused on the bullish side.
Trade safely.

TradeCityPro | Bitcoin Daily Analysis #120👋 Welcome to TradeCity Pro!
Let’s dive into the Bitcoin analysis and key crypto indices. As usual, in this analysis I want to review the futures triggers for the New York session.
⏳ 1-Hour Timeframe
In the 1-hour timeframe, as you can see, Bitcoin has finally broken out of the range it formed yesterday and is now moving upward.
✔️ If this upward move continues, we can open a long position in these zones by getting confirmation in the lower timeframes. The main long trigger is still activated after breaking 110256.
💥 The RSI oscillator entered the Overbuy zone in the previous candle. We need to see how the price reacts to this move and what impact this oscillator will have on the price.
⚡️ In my opinion, this RSI move won't have much impact. Although the price is moving upward, the main trend has not yet formed, so there's no real momentum in the market, and RSI is basically useless for now.
✨ If this upward move turns out to be fake, we can enter a short position with the 107853 trigger.
👑 BTC.D Analysis
Let’s look at Bitcoin Dominance. Yesterday, dominance had an upward move and broke its ascending trendline but failed to stabilize above 65.52, resulting in a fake breakout and a move downward.
☘️ The fake breakout trigger for the trendline was the 65.38 zone, which was activated, and now the price is heading downward. If this move continues, the next target will be 65.04.
📅 Total2 Analysis
Alongside Bitcoin’s upward move, this index also activated the 1.14 trigger and is moving up, now reaching 1.15.
💫 If the move continues, the next entry trigger is at 1.17, which is still quite far from the current price.
📅 USDT.D Analysis
Looking at Tether Dominance, the 4.82 trigger was activated, and dominance is now moving down, having reached 4.78.
📈 If it stabilizes below 4.78, we can confirm the continuation of the downtrend in dominance, which could push it down to 4.72.
❌ Disclaimer ❌
Trading futures is highly risky and dangerous. If you're not an expert, these triggers may not be suitable for you. You should first learn risk and capital management. You can also use the educational content from this channel.
Finally, these triggers reflect my personal opinions on price action, and the market may move completely against this analysis. So, do your own research before opening any position.

TradeCityPro | Bitcoin Daily Analysis #119👋 Welcome to TradeCity Pro!
Let’s go over the analysis of Bitcoin and the key crypto indexes. As usual, in this analysis I’m going to review the futures triggers for the New York session.
⏳ 1-Hour Timeframe
Yesterday, the price broke out of the range box between 108619 and 110256 that I had marked for you, and with the heavy selling volume that entered the market, this bearish move took place.
✔️ This move continued to the 107448 zone, and as you can see, we are now in a consolidation and rest phase, and once again the volume has dropped significantly.
✨ As I mentioned in yesterday’s analysis, I believe this low volume will persist through the weekend, and for a solid move to happen, we’ll need to wait for the new week to begin.
💥 For now, the price has room to move up to 108619 and perform a retracement. A break above the 50 zone on the RSI greatly increases the likelihood of this move.
📊 If selling volume re-enters the market and the price moves downward, the short trigger we have is the 107448 level, and breaking it could start the next bearish leg.
📈 For a long position, the price must first stabilize above 108619, and then, if we see that buying volume continues and increases, we can enter a long position. The main trigger will be 110256.
⭐ I myself won’t be opening any positions for now and will wait until the market shows some proper volume and trend before entering. If you plan to open a position based on these triggers, I suggest you take on very little risk so that in case your stop-loss is hit, you don’t lose much money.
👑 BTC.D Analysis
Let’s look at Bitcoin dominance. Yesterday, dominance touched the trendline I had marked and is still dealing with this dynamic resistance.
💫 A bottom has formed at 65.38. If this bottom is broken, we’ll get confirmation of rejection from the trendline, and dominance could have a bearish move down to 65.04.
⚡️ If the trendline is broken instead, we’ll have a new trigger at 65.52, and breaking it would confirm a bullish reversal in dominance. The main trigger will still be a break of 65.64.
📅 Total2 Analysis
Now let’s move on to Total2. This index dropped to the 1.13 zone and has now pulled back to 1.14. It seems like it’s getting ready for another downward move.
☘️ If Bitcoin dominance gets rejected from the trendline and moves down, and if Bitcoin moves upward, Total2 could make a very sharp move.
🔑 Even if Bitcoin drops, Total2 might range or even move up. For now, our short trigger is 1.13, and aside from 1.14, we don’t have any specific long trigger.
📅 USDT.D Analysis
Finally, let’s look at Tether dominance. This index made a bullish move to 4.85 after breaking 4.78 and is now in a corrective phase.
📊 If 4.85 is broken, the next bullish leg could continue up to 4.93. If a correction happens, dominance might pull back to 4.78.
❌ Disclaimer ❌
Trading futures is highly risky and dangerous. If you're not an expert, these triggers may not be suitable for you. You should first learn risk and capital management. You can also use the educational content from this channel.
Finally, these triggers reflect my personal opinions on price action, and the market may move completely against this analysis. So, do your own research before opening any position.

TradeCityPro | Bitcoin Daily Analysis #118👋 Welcome to TradeCity Pro!
Let’s dive into the Bitcoin analysis and key crypto indexes. As usual, in this analysis, I’ll review the futures triggers for the New York session.
⏳ 1-Hour Timeframe
On the 1-hour timeframe, the price remains within the same range box between 108619 and 110256, and it is currently sitting at the bottom of that box.
✔️ Since yesterday, market volume has significantly declined — as you can see, there's practically no real volume in the market.
⭐ On the other hand, it seems the 108619 trigger is about to be activated, and price may move downward. However, personally, as long as market volume stays this low, I prefer not to open any positions.
📊 If we see selling volume entering the market following a break below 108619, I’ll consider opening a short position. But in the current situation, as mentioned, I prefer to stay out of the market.
💥 The RSI oscillator is steadily and gradually declining like a waterfall. This is also due to the lack of volume in the market, which has led to very low price volatility.
⚡️ So for now, it's better not to rely on RSI data because without volume, RSI readings won't be useful.
📈 If the price gets supported at the 108619 level with a good buying volume and starts moving toward 110256, the chance of breaking that level will increase significantly.
👀 If that happens, I’ll personally try to open a long position once 110256 breaks. But I think today, Saturday, and Sunday will remain the same in terms of market conditions, and real volume will likely return starting next week.
👑 BTC.D Analysis
Moving on to Bitcoin Dominance, a descending trendline can be drawn here, which has been tested twice and is now being approached again.
☘️ If BTC dominance gets rejected from this trendline and moves downward, it will likely reach the 65.04 support level. If the trendline breaks, the next resistance will be 65.64.
📅 Total2 Analysis
Looking at Total2, you’ll notice it’s showing more bearishness than Bitcoin and has lost the support it formed at the 1.15 level.
💫 This happened because BTC dominance has been rising since yesterday, which means more money has been flowing into Bitcoin than into altcoins.
🔼 The next support level for Total2 is at 1.13, and a potential downside move may reach this zone. The suitable long trigger remains a break above 1.17.
📅 USDT.D Analysis
Finally, USDT Dominance has exited the range box it had formed and climbed back above the 4.78 level.
🎲 If this upward move continues, the next major resistance will be 4.90. However, if this move turns out to be fake, the short trigger for a bearish reversal will be a break below 4.72..
❌ Disclaimer ❌
Trading futures is highly risky and dangerous. If you're not an expert, these triggers may not be suitable for you. You should first learn risk and capital management. You can also use the educational content from this channel.
Finally, these triggers reflect my personal opinions on price action, and the market may move completely against this analysis. So, do your own research before opening any position.

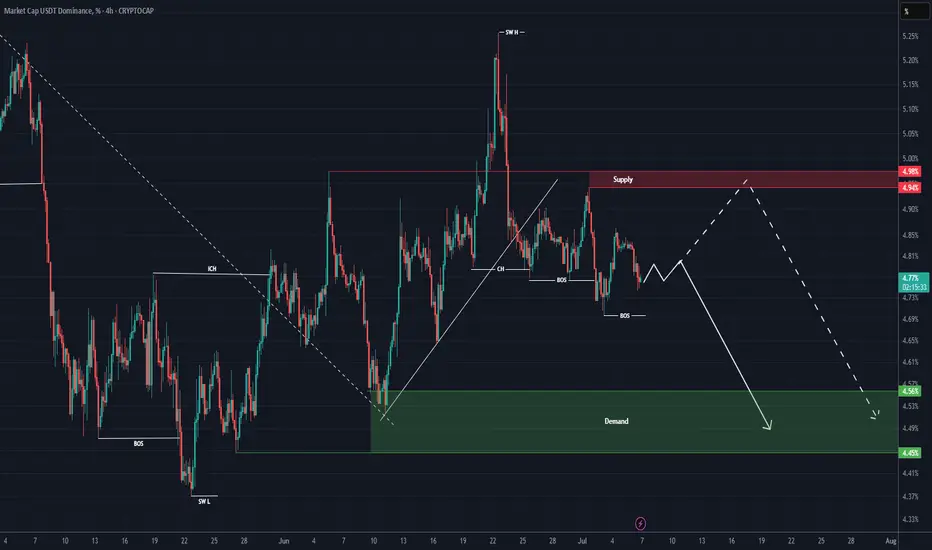
USDT DOMINANCE New Update (4H)This analysis is an update of the analysis you see in the "Related publications" section
The green box from the previous analysis was engulfed, and a new demand zone has been added to the chart.
Before the main drop, we still expect a pullback from this index
For risk management, please don't forget stop loss and capital management
Comment if you have any questions
Thank You

TradeCityPro | Bitcoin Daily Analysis #117👋 Welcome to TradeCity Pro!
After nearly 20 days of inactivity on this channel, we’re back with our regular analyses. As the first post in this new round, I’ll continue the Bitcoin series and present analysis number 117.
✅As usual, the analysis is done on the 1-hour timeframe to identify potential futures triggers for the New York session.
📰 Before diving into the charts, let’s briefly look at the market fundamentals. Over the past three weeks, we’ve had the news of the conflict between Iran and Israel. Aside from the initial couple of days, it didn’t have a significant impact on the market, and eventually, the market stopped reacting to it. Right now, the two countries have agreed to a ceasefire and seem to be negotiating.
🔍 In my opinion, the market is unlikely to care anymore whether this war continues or not. Whether they reach an agreement or not probably won’t make a big difference to the market.
🔑 The other major event was the Federal Reserve meeting. Everyone was expecting Jerome Powell to provide some clear outlook regarding US monetary policy, but once again, that didn’t happen. Powell didn’t provide any meaningful data.
📊 This uncertainty led to minimal market volatility and prevented any strong legs from forming, with no significant volume entering the market as everyone was waiting for Powell’s remarks. Since that didn’t yield much, the market remains indecisive for now.
💥 We’ll have to wait and see what kind of impactful news comes in the future. Until then, it’s best to remain patient.
⏳ 1-Hour Timeframe
On the 1-hour chart, you can see a bullish move that started from the 105370 zone, and with strong buying volume, price broke through 108619 and reached the top of 110256.
✨ Currently, price has only wicked into 110256 and hasn’t shown a decisive reaction to it yet. If it revisits this zone, we’ll be able to observe its real reaction to the supply level.
🔔 The current support zone is 108619, which has already received a bounce, forming a range box between 108619 and 110256.
📈 If the 110256 level breaks, the upward move could continue with another bullish leg.
🔽 For short positions, the first trigger would be a confirmation below 108619. But for a more reliable short, I would wait for the price to form a lower high and a lower low below that zone before entering.
👑 BTC.D Analysis
Bitcoin dominance is currently hovering around a key support at 65.04. A key resistance sits at 65.64, which would be the first trigger for bullish continuation.
⭐ The main breakout level for starting a new bullish trend in dominance would be 65.97. For bearish confirmation, a break below 65.04 would suffice.
📅 Total2 Analysis
Looking at Total2, a range box has formed between 1.15 and 1.17, with price oscillating in between.
🧩 Momentum is currently bullish, and there’s a high chance of breaking above 1.17. If this level is broken, we could see another bullish leg and a long position would be valid.
📉 For shorts, a break below 1.15 would be the first signal, but I personally prefer to wait for a clearer trend change before entering any short positions.
📅 USDT.D Analysis
USDT dominance is also ranging between 4.72 and 4.78, very similar to Total2.
📊 A break below 4.72 would confirm a bearish move, while a break above 4.78 would indicate bullish continuation for dominance.
❌ Disclaimer ❌
Trading futures is highly risky and dangerous. If you're not an expert, these triggers may not be suitable for you. You should first learn risk and capital management. You can also use the educational content from this channel.
Finally, these triggers reflect my personal opinions on price action, and the market may move completely against this analysis. So, do your own research before opening any position.

USDT.D Showing Signs of Bounce – Altseason at Risk?USDT Dominance is still moving within a rising parallel channel, holding just above the nearest support zone. After a brief dip, price is now showing signs of recovery from the lower boundary of the channel.
However, the key resistance zone near the top of the channel has proven tough to break — it rejected price on the last attempt.
Until we get a clear breakout or breakdown from this channel structure, the market may remain choppy. A breakout above 5.00% could signal risk-off sentiment (bad for alts), while a drop below the support zone may trigger altcoin momentum.
Stay cautious — the market is still undecided.

USDT Dominance Consolidating — Major Move Loading?USDT dominance is currently stuck in a sideways range between key resistance and strong support zones.
We’ve seen a rejection from the upper resistance, and now price is drifting toward the nearest support. If this zone holds, expect another bounce. If it breaks, altcoins could finally catch a strong bid — possibly the early signal for altseason.
No rush here. Just keep your eyes on that mid S/R level. It’s a key battleground.
$USDT.D: Bearish ChartCRYPTOCAP:USDT.D | 3D
Price action on USDT dominance has been significantly cleaner than CRYPTOCAP:BTC in recent weeks, providing much clearer pivot signals.
On the 3-day chart, we can see that the 5% level has turned into a strong supply zone and is currently being rejected. If the price fails to reclaim the 5% level, it will likely move back down toward the 4.30% level.
Outlook: Expecting CRYPTOCAP:BTC to sweep local highs while CRYPTOCAP:USDT.D remains bearish.
Potential downside levels: 4.5% and possibly even 3.90%


