UniversOfSignals | Bitcoin Daily Analysis #20Let's dive into the Bitcoin analysis and key crypto indices, where I will, as usual, review the futures triggers for today's New York session. The market had an upward and corrective movement yesterday, rising from the support at 78,940. Today, I aim to examine the market conditions for you.
⏳ 1-Hour Timeframe
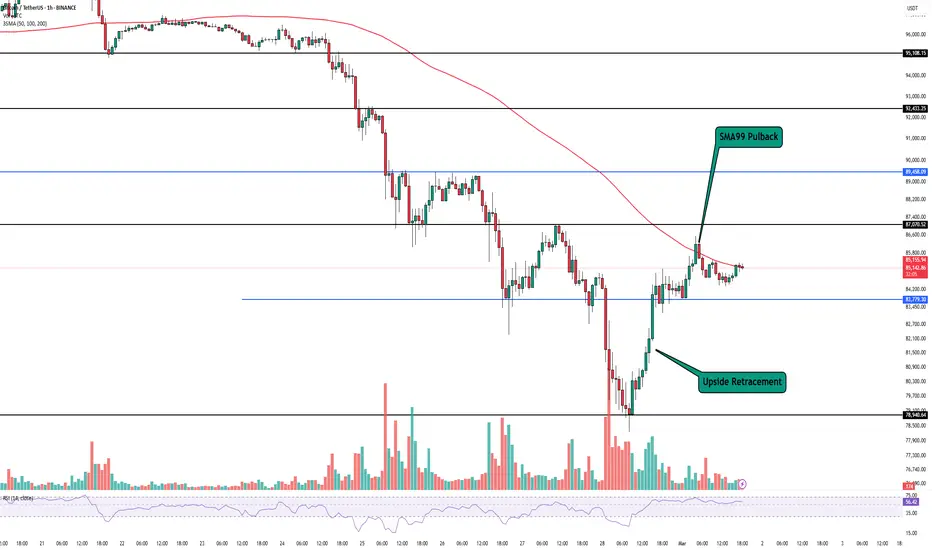
In the 1-hour timeframe, as you can see, the price has risen from the support at 78,940 and managed to exceed the area of 83,779. A V pattern has formed and has been activated, moving the price upward. It appears that the break of 83,779 so far was a fake break.
🔼 If 83,779 is broken again, you can enter a short position targeting 78,940, but keep in mind that since the price has already faked a break, there might be an upward momentum entering the market. If 82,770 breaks, you could consider taking the risk of opening a long position.
⚡️ Personally, I prefer to open a long position with the minimum risk allowed by my strategy, but if 83,779 breaks, I will open a short position with usual risk. As you can see, the price has also hit the SMA 99 and seems to be getting rejected from it.
📉 This could be another suitable confirmation for a short position, and if the price cannot stabilize above this SMA and gets rejected from this area, breaking 83,779, we could even expect the next bearish leg towards lower lows, although the first target for us would be 78,940.
✅ The RSI oscillator has also moved out of the oversell zone and above the 50 area. A break of the 50 zone could reintroduce bearish momentum into the market.
📊 Keep in mind that today is Saturday, considered a holiday, and the market volume is very low. I generally prefer the market to range on such days and then start moving afterward.
👑 BTC.D Analysis
Let's move on to analyzing Bitcoin dominance to see how Bitcoin's dominance over the market has changed compared to yesterday. As you can see, after being supported at 60.48 and breaking the 60.91 area, it's moving upwards again.
💫 As I mentioned, a range box has formed between 60.48 and 62.19, and I told you yesterday that if the dominance stabilizes above 60.91, it could start moving towards the box's ceiling.
🎲 As you can see, this movement has started, and so far, the dominance has reached 61.21. We need to see how the dominance reacts to this area. If this area breaks, the next resistance levels for dominance will be 61.49 and 62.19.
🧲 I have nothing more to say about Bitcoin dominance. It seems to be forming an upward structure, and if this upward structure coincides with the next bearish leg of Bitcoin, altcoins could provide very good short positions and experience sharp declines.
📅 Total2 Analysis
Let's move on to analyze Total2 to see what the triggers for altcoins will be. As you can see, Total2 was supported from 1.01 and has moved upward to 1.09, where it is currently being rejected.
🔍 As you observe, the SMA 99 in Total2 has reached the price and the price has reacted to it. We have a very risky trigger for a short position on Total2, which is the break of 1.06; this position is very risky and can be opened as a scalp in lower timeframes.
🚀 The highest target I can consider for this position will be the area of 1.01.
📅 USDT.D Analysis
Let's move on to the analysis of Tether dominance. As you see, Tether's dominance was rejected from 5.50 and has moved downward, reaching back to 5.21. This index, like Bitcoin and Total2, has reached the SMA 99 and been supported from this area, and could perform its next bullish leg after breaking 5.21.
💥 In this case, you could confirm the bullish turn of Tether's dominance and validate this dominance for the next bearish leg of the price.
❌ Disclaimer ❌
Trading futures is highly risky and dangerous. If you're not an expert, these triggers may not be suitable for you. You should first learn risk and capital management. You can also use the educational content from this channel.
Finally, these triggers reflect my personal opinions on price action, and the market may move completely against this analysis. So, do your own research before opening any position.
Usdtdominance
USDT the big rebound - The Rise from the Ashesin my newest finding i will tell you about USDT rise from the Ashes
as you can see we build a very volume heavy low
corresponding to a low in March and a really good rebound is about to happen
be prepared for heavy downturns in the crypto market
as always, just my opinion and looking for ppl who share thougths on it
no trading advice

TradeCityPro | Bitcoin Daily Analysis #20👋 Welcome to TradeCity Pro!
Let's dive into the Bitcoin analysis and key crypto indices, where I will, as usual, review the futures triggers for today's New York session. The market had an upward and corrective movement yesterday, rising from the support at 78,940. Today, I aim to examine the market conditions for you.
⏳ 1-Hour Timeframe
In the 1-hour timeframe, as you can see, the price has risen from the support at 78,940 and managed to exceed the area of 83,779. A V pattern has formed and has been activated, moving the price upward. It appears that the break of 83,779 so far was a fake break.
🔼 If 83,779 is broken again, you can enter a short position targeting 78,940, but keep in mind that since the price has already faked a break, there might be an upward momentum entering the market. If 82,770 breaks, you could consider taking the risk of opening a long position.
⚡️ Personally, I prefer to open a long position with the minimum risk allowed by my strategy, but if 83,779 breaks, I will open a short position with usual risk. As you can see, the price has also hit the SMA 99 and seems to be getting rejected from it.
📉 This could be another suitable confirmation for a short position, and if the price cannot stabilize above this SMA and gets rejected from this area, breaking 83,779, we could even expect the next bearish leg towards lower lows, although the first target for us would be 78,940.
✅ The RSI oscillator has also moved out of the oversell zone and above the 50 area. A break of the 50 zone could reintroduce bearish momentum into the market.
📊 Keep in mind that today is Saturday, considered a holiday, and the market volume is very low. I generally prefer the market to range on such days and then start moving afterward.
👑 BTC.D Analysis
Let's move on to analyzing Bitcoin dominance to see how Bitcoin's dominance over the market has changed compared to yesterday. As you can see, after being supported at 60.48 and breaking the 60.91 area, it's moving upwards again.
💫 As I mentioned, a range box has formed between 60.48 and 62.19, and I told you yesterday that if the dominance stabilizes above 60.91, it could start moving towards the box's ceiling.
🎲 As you can see, this movement has started, and so far, the dominance has reached 61.21. We need to see how the dominance reacts to this area. If this area breaks, the next resistance levels for dominance will be 61.49 and 62.19.
🧲 I have nothing more to say about Bitcoin dominance. It seems to be forming an upward structure, and if this upward structure coincides with the next bearish leg of Bitcoin, altcoins could provide very good short positions and experience sharp declines.
📅 Total2 Analysis
Let's move on to analyze Total2 to see what the triggers for altcoins will be. As you can see, Total2 was supported from 1.01 and has moved upward to 1.09, where it is currently being rejected.
🔍 As you observe, the SMA 99 in Total2 has reached the price and the price has reacted to it. We have a very risky trigger for a short position on Total2, which is the break of 1.06; this position is very risky and can be opened as a scalp in lower timeframes.
🚀 The highest target I can consider for this position will be the area of 1.01.
📅 USDT.D Analysis
Let's move on to the analysis of Tether dominance. As you see, Tether's dominance was rejected from 5.50 and has moved downward, reaching back to 5.21. This index, like Bitcoin and Total2, has reached the SMA 99 and been supported from this area, and could perform its next bullish leg after breaking 5.21.
💥 In this case, you could confirm the bullish turn of Tether's dominance and validate this dominance for the next bearish leg of the price.
❌ Disclaimer ❌
Trading futures is highly risky and dangerous. If you're not an expert, these triggers may not be suitable for you. You should first learn risk and capital management. You can also use the educational content from this channel.
Finally, these triggers reflect my personal opinions on price action, and the market may move completely against this analysis. So, do your own research before opening any position.

$USDT DOMINANCE ANALYSIS USDT.D is approaching a major downtrend resistance.
A rejection from this level could trigger a pullback, forming a lower high structure before targeting the key support zone at 3.80%.
Bearish Outlook:
Rejection at resistance 5.30% zone, Lower highs formation
Potential drop to strong support
What This Means for Crypto?
A decline in USDT dominance usually signals bullish momentum for #Altcoins & #BTC!
Keep an eye on the reaction at resistance.

USDT.D at 5.76% Key Level to Watch for Crypto Market “BOTTOM”Hey everyone! 👋 Let’s talk about a critical level on the USDT.D chart (Tether Dominance) that could signal a major opportunity for crypto traders. If you’re looking to long Bitcoin, altcoins, or other crypto assets, this is the area you need to watch closely: 5.76%.
Why is 5.76% So Important? 🤔
USDT.D measures the dominance of Tether (USDT) in the crypto market. When USDT dominance drops, it typically means money is flowing out of stablecoins (like USDT) and into riskier assets like Bitcoin, Ethereum, and altcoins. In simpler terms: a drop in USDT.D often signals a pump in the crypto market!
Right now, the 5.76% level on the USDT.D chart (as shown in the image) is a key support zone. You can see it’s been tested before, and it aligns with historical bottoms in the crypto market. When USDT.D hits this level, it often marks a turning point—a bottom for the crypto market—where prices of BTC, alts, and other assets start to rally.
What Does This Mean for Traders? 📈
If USDT.D reaches 5.76% and shows signs of reversing (like a bounce or consolidation), it’s a strong signal that the crypto market is ready to pump. Here’s why:
• Money Flow: A drop to 5.76% suggests investors are moving funds from USDT back into crypto assets, driving up prices.
• Market Bottom: This level has historically acted as a floor for USDT.D, meaning the crypto market could be at its lowest point before a big rally.
• Opportunity to Long: When USDT.D hits this zone, it’s a great area to consider longing Bitcoin, altcoins, or other crypto assets, as they’re likely to start pumping.
How to Play This? ⚡
1. Watch the 5.76% Level: Keep an eye on USDT.D as it approaches this key support. Look for signs of a bounce or reversal (like a strong candlestick pattern or increased volume).
2. Confirm with Other Indicators: Check Bitcoin’s chart, altcoin price action, or other indicators (like RSI or MACD) to confirm the market is turning bullish.
3. Take Action: If USDT.D hits 5.76% and starts to reverse, consider longing your favorite crypto assets. This could be the start of a big pump for BTC, alts, and the entire market!
Why This Matters for the Whole Market 🌍
The 5.76% level isn’t just about USDT.D—it’s a signal for the entire crypto market. When Tether dominance drops to this area, it often means the market has found a bottom, and we’re about to see a wave of bullish momentum. Whether you’re trading BTC, ETH, or smaller altcoins, this could be the best area to jump in for a long position.
Final Thoughts 💡
The 5.76% level on USDT.D is the area to watch right now. It’s historically been a bottom for the crypto market, and if we hit it again, we could see a massive pump across all crypto assets. Stay patient, wait for confirmation, and get ready to take advantage of this opportunity! 🚀
What do you think? Are you watching this level too? Let’s discuss in the comments! 👇
Why This Explanation Works:
1. Simple Language: It avoids jargon and explains USDT.D in a way anyone can understand.
2. Actionable Advice: It tells people exactly what to watch (5.76%) and what to do (long crypto assets).
3. Visual Reference: It ties into the chart you shared, pointing out the 5.76% level.
4. Engagement: It invites discussion, encouraging others to share their thoughts.
5. Big Picture: It connects the USDT.D level to the broader crypto market, making it relevant to all traders.

Possible Bearish CypherStronger RSI shows us that USDT.D is stronger than the previous bottom.
Therefore, a rise towards point D would not be surprising.
For those expecting a bull market in altcoins, point D may be the real altcoin buying point.
First target to the D point %7.49
Bearish cypher target %1.59
* What i share here is not an investment advice. Please do your own research before investing in any asset.
* Never take my personal opinions as investment advice, you may lose all your money.

UNIVERSOFSIGNALS| Bitcoin Daily Analysis #19👋 Welcome to UNIVERSOFSIGNALS !
Let's dive into the analysis of Bitcoin and important crypto indices. As usual, I will review today's future triggers for the New York session. Today's analysis will be conducted in the 4-hour timeframe, as the 1-hour timeframe does not provide the clarity of price information we need, and the 4-hour timeframe is better suited for today's analysis.
⏳ 4-Hour Timeframe
As you can see, after the price broke through the $95,108 area, we witnessed a significant drop on the chart, with the first bearish leg reaching down to $87,070 and subsequent legs moving to lower areas. Currently, the price has reached the support at $78,940 and has been supported there.
🔍 As you can observe, the volume of the price candles is very high compared to the green candles, which clearly indicates that the market's control is heavily skewed towards sellers.
✨ The RSI oscillator, after forming a Double Bottom in the oversell area and returning to the normal zone, re-entered the oversell zone yesterday, which led to another bearish leg after breaking the $83,779 trigger, which I had previously identified for you, and the price then proceeded to perform its next bearish leg.
💥 Currently, we have positions open from the $95,108 and $92,433 areas, and if you have been following and looking to open more positions, you would have also opened positions upon the breaks of $87,070 and $83,779. Given the sharp market downturn, you would have made a considerable profit by now.
✅ I suggest that if you have open short positions from any of the levels that were breached, to take profits and even close the position because it seems the market has completed its downturn and might start correcting or ranging.
🧩 The range I anticipate the price might oscillate within is between $72,940 to $82,700, but keep in mind that these analyses are my personal opinion, and the price could break the $78,940 area and perform its next bearish leg at any moment. In that case, I would personally open a short position and ensure to have a short position open in case of a break below $78,940.
🔽 Today, apart from this short trigger, I cannot give you another trigger. This short trigger is very risky, and you should open this position with the minimum risk your strategy allows.
👑 BTC.D Analysis
As observed in the 4-hour timeframe, BTC.D is currently forming a smaller box between the areas of 60.48 to 60.91 and continues to fluctuate within this box, so no specific trend can be predicted.
🔑 However, if the area of 60.48 breaks, we can be more hopeful for an altcoin rally, expecting that altcoins might recover some of the ground they have lost because, along with Bitcoin's ranging, Bitcoin dominance has been increasing, and altcoins have been bearish for several months.
📅 Total2 Analysis
Moving on to Total2, as you can see, Total2 was rejected from the crucial area of 1.13, which I mentioned before, and broke the 1.07 area, currently registering a floor at 1.01. This area was not historically significant, and the price has reacted alongside Bitcoin, so we need to see how Total2 moves.
⚡️ If the 1.01 breaks, you can open a short position, which I will also be doing. However, I will open this position only if Bitcoin dominance turns bullish, expecting further declines in altcoins if that happens.
🔼 For a long position, you need to wait until the price forms a new upward structure, and if it moves sharply upwards, you can enter on a break of 1.13.
📅 USDT.D Analysis
As I mentioned yesterday, there was a significant resistance area at 5.45 in USDT.D, where Tether's dominance was rejected from slightly higher at 5.50, and we are seeing a red candle which might indicate the start of a correction and the end of this bullish leg in dominance.
⭐️ The only trigger for a bullish scenario in USDT.D dominance and a market downturn is 5.50, and for a long position and a decline in Tether's dominance, there is no trigger at this moment.
❌ Disclaimer ❌
Trading futures is highly risky and dangerous. If you're not an expert, these triggers may not be suitable for you. You should first learn risk and capital management. You can also use the educational content from this channel.
Finally, these triggers reflect my personal opinions on price action, and the market may move completely against this analysis. So, do your own research before opening any position.

UniversOfSignals | LTCUSDT Let's go for spot buying?👋 Welcome to UniversOfSignals Channel!
Let's go together to analyze and review Litecoin analysis, one of the oldest coins in the market, and let's go to update the triggers of the previous analysis!
🌐 Overview Bitcoin
Before starting today's altcoin analysis, let's look at Bitcoin on the 1-hour timeframe. Since yesterday, Bitcoin experienced a correction, which was necessary for the market, and it pulled back to the 102135 range. The next trigger for a long position will be a breakout above 104714.
Yesterday's correction, coupled with an increase in Bitcoin dominance, caused noticeable declines in some altcoins. This highlights the importance of monitoring BTC pairs in your checklist these days.
📊 Weekly Timeframe
On the weekly time frame, it is one of the coins that is in a good position compared to the coins and has had the least correction in recent declines and is in this position due to the possibility of ETF approval
There is no need to complicate things in this time frame and after the break of 136.45, we will buy and be above 98.44. This trigger is valid and we do not have much of an exit trigger for the conditions of these days on this chart and for now it is better to continue holding
📈 Daily Timeframe
On the daily time frame, we are also in a good position and we had a good return after the recent market decline due to the Bybit hack and Trump's tariffs and this is a good thing!
After breaking the 75.01 level and exiting the daily box and breaking its ceiling, we moved up to the resistance of 136.45 and are now fluctuating between the 98.44 to 136.45 boxes.
We also had a curve line in this time frame that was a good support for this event and every time we hit it, we made a good move upwards, but after its failure, it can be said that the upward trend moved into the range and went to form a new structure.
To buy spot after the 136.45 trigger is broken, we can buy for spot with a stop loss of 98.44 and as long as we are above 114.38, the 136.45 trigger is very important for us and it shows us more the strength of buyers and in case of a 98.44 break, we will go for 89 and 80 and we will have a price correction.
📝 Final Thoughts
Stay calm, trade wisely, and let's capture the market's best opportunities!
This analysis reflects our opinions and is not financial advice.
Share your thoughts in the comments, and don’t forget to share this analysis with your friends!

TradeCityPro | Bitcoin Daily Analysis #19👋 Welcome to TradeCity Pro!
Let's dive into the analysis of Bitcoin and important crypto indices. As usual, I will review today's future triggers for the New York session. Today's analysis will be conducted in the 4-hour timeframe, as the 1-hour timeframe does not provide the clarity of price information we need, and the 4-hour timeframe is better suited for today's analysis.
⏳ 4-Hour Timeframe
As you can see, after the price broke through the $95,108 area, we witnessed a significant drop on the chart, with the first bearish leg reaching down to $87,070 and subsequent legs moving to lower areas. Currently, the price has reached the support at $78,940 and has been supported there.
🔍 As you can observe, the volume of the price candles is very high compared to the green candles, which clearly indicates that the market's control is heavily skewed towards sellers.
✨ The RSI oscillator, after forming a Double Bottom in the oversell area and returning to the normal zone, re-entered the oversell zone yesterday, which led to another bearish leg after breaking the $83,779 trigger, which I had previously identified for you, and the price then proceeded to perform its next bearish leg.
💥 Currently, we have positions open from the $95,108 and $92,433 areas, and if you have been following and looking to open more positions, you would have also opened positions upon the breaks of $87,070 and $83,779. Given the sharp market downturn, you would have made a considerable profit by now.
✅ I suggest that if you have open short positions from any of the levels that were breached, to take profits and even close the position because it seems the market has completed its downturn and might start correcting or ranging.
🧩 The range I anticipate the price might oscillate within is between $72,940 to $82,700, but keep in mind that these analyses are my personal opinion, and the price could break the $78,940 area and perform its next bearish leg at any moment. In that case, I would personally open a short position and ensure to have a short position open in case of a break below $78,940.
🔽 Today, apart from this short trigger, I cannot give you another trigger. This short trigger is very risky, and you should open this position with the minimum risk your strategy allows.
👑 BTC.D Analysis
As observed in the 4-hour timeframe, BTC.D is currently forming a smaller box between the areas of 60.48 to 60.91 and continues to fluctuate within this box, so no specific trend can be predicted.
🔑 However, if the area of 60.48 breaks, we can be more hopeful for an altcoin rally, expecting that altcoins might recover some of the ground they have lost because, along with Bitcoin's ranging, Bitcoin dominance has been increasing, and altcoins have been bearish for several months.
📅 Total2 Analysis
Moving on to Total2, as you can see, Total2 was rejected from the crucial area of 1.13, which I mentioned before, and broke the 1.07 area, currently registering a floor at 1.01. This area was not historically significant, and the price has reacted alongside Bitcoin, so we need to see how Total2 moves.
⚡️ If the 1.01 breaks, you can open a short position, which I will also be doing. However, I will open this position only if Bitcoin dominance turns bullish, expecting further declines in altcoins if that happens.
🔼 For a long position, you need to wait until the price forms a new upward structure, and if it moves sharply upwards, you can enter on a break of 1.13.
📅 USDT.D Analysis
As I mentioned yesterday, there was a significant resistance area at 5.45 in USDT.D, where Tether's dominance was rejected from slightly higher at 5.50, and we are seeing a red candle which might indicate the start of a correction and the end of this bullish leg in dominance.
⭐️ The only trigger for a bullish scenario in USDT.D dominance and a market downturn is 5.50, and for a long position and a decline in Tether's dominance, there is no trigger at this moment.
❌ Disclaimer ❌
Trading futures is highly risky and dangerous. If you're not an expert, these triggers may not be suitable for you. You should first learn risk and capital management. You can also use the educational content from this channel.
Finally, these triggers reflect my personal opinions on price action, and the market may move completely against this analysis. So, do your own research before opening any position.

USDT Dominance Drop Incoming? Short-Term Relief for Crypto!📉 USDT Dominance Update 📉
USDT.D is showing bearish divergence – price rising while RSI declines. A drop from 5.42 to 4.38 is likely, giving BTC and alts a temporary relief. However, higher timeframes still look weak, so this move may not last long. Stay cautious! ⚠️

UNIVERSOFSIGNALS| Bitcoin Daily Analysis #18👋 Welcome to UNIVERS OF SIGNALS !
Let's dive into the analysis of Bitcoin and key crypto indicators. Yesterday, the price broke the critical support level at $87,700 and proceeded to the next bearish leg. Today, we'll explore what might happen to Bitcoin in the future and identify appropriate triggers for opening positions in the New York session.
⏳ 1-Hour Timeframe
As you can see, yesterday the price was rejected from $89,458 and moved downwards, breaking the support at $87,070 and dropping to the area of $83,779.
⚡️ As you notice, I have adjusted the Fibonacci that I had drawn. This is because the price did not even correct to the 0.382 Fibonacci level. In fact, the correction and rest that occurred up to $89,458 was not a true correction, but rather a part of the bearish leg.
✅ As you can see in this new form that I have drawn Fibonacci, the 0.5 and 0.382 levels have become very important areas and can be considered significant resistance zones for the price.
♟ Currently, after reaching $83,779, the price has found support at this level, and as observed, the RSI has shown significant divergence with the previous bottom, and after the divergence trigger in the RSI hit 50, we see that the price has managed to form a green candle.
🔍 If the price can rise above this level again and return to the box between $87,070 and $89,458, we can say that the bearish trend has temporarily ended, and the market wants to create a new structure for opening positions.
🧪 As we did before, we supported from $87,070 and took a day of rest in this area. We opened a position when it broke $87,070, and I hope you were with us and opened your position.
🔄 From the positions we previously held from higher areas like $95,108 and $93,433, I suggest using Dow Theory to close your positions if the price establishes a higher floor and ceiling. You can also place your active stop loss above the resistance area of $89,458, which corresponds to the 0.5 Fibonacci level.
📈 However, for opening positions today, if the price moves sharply upward and forms a V pattern, you could consider opening a long position if it breaks $89,458. But this position is very risky, and I personally won't open it because the market trend and momentum are completely bearish, and I see no sign of an upward trend.
🔽 For short positions, if the price is rejected from $87,070, you could open a short position in the lower timeframes if this trigger breaks. However, if you want to behave more securely, you can open a short position if $83,779 breaks.
🎲 I will not be joining this position because I have positions open from higher up, and I don't want to disrupt the average of my position and have it move lower. I think the price has fallen enough and now needs rest, although my view might be wrong, and the price could from here again commence the next bearish leg.
👑 BTC.D Analysis
Let's move on to analyzing Bitcoin dominance to determine which coins might be more appropriate to trade today. As we see, there was another drop in Bitcoin dominance, this time breaking the area of 90.61, and dominance has returned to the previous low of 60.48, where it found support.
🧩 As Bitcoin corrected, Bitcoin dominance also increased, causing Bitcoin to perform deeper corrections compared to altcoins.
🧲 When we get to Total2, we'll see that Bitcoin has corrected more than altcoins, but determining the trend in Bitcoin dominance is a bit difficult as it's nearly forming a large range box between 60.48 and 62.19. As long as it's in this box, it's hard to determine a clear trend, and it might move towards the bottom or top of the box.
💥 However, since we are currently at the bottom of this box, if dominance again stabilizes above 60.21, we can take this as confirmation of becoming bullish. If the bottom of the box, which is 60.48, breaks, dominance could move to its next bearish leg targeting 59.84.
📅 Total2 Analysis
As you observed, alongside the drop in Bitcoin dominance, the market also fell, which caused Total2 to not lose its important area of 1.07 and to bounce back from there, moving upwards.
✨ But as I mentioned, the increase in Bitcoin dominance caused Bitcoin to correct more than altcoins, but overall, Total2 is in a better situation than Bitcoin because Bitcoin was supported at a lower level and lower support, but Total2 bounced back from the same support at 1.07 and is moving upwards.
💫 I expect a box to form between 1.07 and 1.13, which overlaps with the 0.382 Fibonacci, and Total2 could create a structure in this box. Today, if any of these structures break according to Bitcoin dominance, you can open positions, but given that Bitcoin dominance is falling, I prefer to open a position on Bitcoin if the bottom of the box breaks and if I want to open a long position, do it on altcoins unless Bitcoin dominance rises from the bottom of its box and starts moving upward again, becoming bullish.
📅 USDT.D Analysis
Let's go to the analysis of Tether dominance. As you see, dominance broke the resistance at 5.04 and made another upward move to the resistance at 5.21.
⭐️ Currently, dominance is moving downwards again and has entered a corrective phase. There is a very important floor at 4.92, and as long as it is above this area, I see the trend of Tether dominance as bullish.
❌ Disclaimer ❌
Trading futures is highly risky and dangerous. If you're not an expert, these triggers may not be suitable for you. You should first learn risk and capital management. You can also use the educational content from this channel.
Finally, these triggers reflect my personal opinions on price action, and the market may move completely against this analysis. So, do your own research before opening any position.

TradeCityPro | Bitcoin Daily Analysis #18👋 Welcome to TradeCity Pro!
Let's dive into the analysis of Bitcoin and key crypto indicators. Yesterday, the price broke the critical support level at $87,700 and proceeded to the next bearish leg. Today, we'll explore what might happen to Bitcoin in the future and identify appropriate triggers for opening positions in the New York session.
⏳ 1-Hour Timeframe
As you can see, yesterday the price was rejected from $89,458 and moved downwards, breaking the support at $87,070 and dropping to the area of $83,779.
⚡️ As you notice, I have adjusted the Fibonacci that I had drawn. This is because the price did not even correct to the 0.382 Fibonacci level. In fact, the correction and rest that occurred up to $89,458 was not a true correction, but rather a part of the bearish leg.
✅ As you can see in this new form that I have drawn Fibonacci, the 0.5 and 0.382 levels have become very important areas and can be considered significant resistance zones for the price.
♟ Currently, after reaching $83,779, the price has found support at this level, and as observed, the RSI has shown significant divergence with the previous bottom, and after the divergence trigger in the RSI hit 50, we see that the price has managed to form a green candle.
🔍 If the price can rise above this level again and return to the box between $87,070 and $89,458, we can say that the bearish trend has temporarily ended, and the market wants to create a new structure for opening positions.
🧪 As we did before, we supported from $87,070 and took a day of rest in this area. We opened a position when it broke $87,070, and I hope you were with us and opened your position.
🔄 From the positions we previously held from higher areas like $95,108 and $93,433, I suggest using Dow Theory to close your positions if the price establishes a higher floor and ceiling. You can also place your active stop loss above the resistance area of $89,458, which corresponds to the 0.5 Fibonacci level.
📈 However, for opening positions today, if the price moves sharply upward and forms a V pattern, you could consider opening a long position if it breaks $89,458. But this position is very risky, and I personally won't open it because the market trend and momentum are completely bearish, and I see no sign of an upward trend.
🔽 For short positions, if the price is rejected from $87,070, you could open a short position in the lower timeframes if this trigger breaks. However, if you want to behave more securely, you can open a short position if $83,779 breaks.
🎲 I will not be joining this position because I have positions open from higher up, and I don't want to disrupt the average of my position and have it move lower. I think the price has fallen enough and now needs rest, although my view might be wrong, and the price could from here again commence the next bearish leg.
👑 BTC.D Analysis
Let's move on to analyzing Bitcoin dominance to determine which coins might be more appropriate to trade today. As we see, there was another drop in Bitcoin dominance, this time breaking the area of 90.61, and dominance has returned to the previous low of 60.48, where it found support.
🧩 As Bitcoin corrected, Bitcoin dominance also increased, causing Bitcoin to perform deeper corrections compared to altcoins.
🧲 When we get to Total2, we'll see that Bitcoin has corrected more than altcoins, but determining the trend in Bitcoin dominance is a bit difficult as it's nearly forming a large range box between 60.48 and 62.19. As long as it's in this box, it's hard to determine a clear trend, and it might move towards the bottom or top of the box.
💥 However, since we are currently at the bottom of this box, if dominance again stabilizes above 60.21, we can take this as confirmation of becoming bullish. If the bottom of the box, which is 60.48, breaks, dominance could move to its next bearish leg targeting 59.84.
📅 Total2 Analysis
As you observed, alongside the drop in Bitcoin dominance, the market also fell, which caused Total2 to not lose its important area of 1.07 and to bounce back from there, moving upwards.
✨ But as I mentioned, the increase in Bitcoin dominance caused Bitcoin to correct more than altcoins, but overall, Total2 is in a better situation than Bitcoin because Bitcoin was supported at a lower level and lower support, but Total2 bounced back from the same support at 1.07 and is moving upwards.
💫 I expect a box to form between 1.07 and 1.13, which overlaps with the 0.382 Fibonacci, and Total2 could create a structure in this box. Today, if any of these structures break according to Bitcoin dominance, you can open positions, but given that Bitcoin dominance is falling, I prefer to open a position on Bitcoin if the bottom of the box breaks and if I want to open a long position, do it on altcoins unless Bitcoin dominance rises from the bottom of its box and starts moving upward again, becoming bullish.
📅 USDT.D Analysis
Let's go to the analysis of Tether dominance. As you see, dominance broke the resistance at 5.04 and made another upward move to the resistance at 5.21.
⭐️ Currently, dominance is moving downwards again and has entered a corrective phase. There is a very important floor at 4.92, and as long as it is above this area, I see the trend of Tether dominance as bullish.
❌ Disclaimer ❌
Trading futures is highly risky and dangerous. If you're not an expert, these triggers may not be suitable for you. You should first learn risk and capital management. You can also use the educational content from this channel.
Finally, these triggers reflect my personal opinions on price action, and the market may move completely against this analysis. So, do your own research before opening any position.

USDT Dominance Update (4H)The large bullish pattern appears to be a symmetrical one, and we are currently in wave I of this structure.
Wave I seems to need a bit more time to complete. The candles are expected to reject from the red zone down to the SS (Static Support) line.
If the candles attack the red zone once again, it could be a good opportunity to buy Bitcoin and altcoins.
Let’s follow the market step by step instead of making predictions. Let’s see what happens.
For risk management, please don't forget stop loss and capital management
Comment if you have any questions
Thank You

Bitcoin Daily Analysis #17 | Univers Of SignalsLet’s move on to the analysis of Bitcoin and key crypto indices. As I mentioned yesterday, there was a possibility that the market would undergo a correction and start ranging, and that’s exactly what happened.
✨ The price hasn’t changed much compared to yesterday, and the short positions we opened remain open for now. There’s no need to take profits yet. Let’s analyze the market to identify today’s triggers or the ones that might signal when to take profits on previous positions.
⏳ 1-Hour Timeframe
As you can see in the 1-hour timeframe, after the price formed a base at 87,700, it entered a ranging phase. The RSI, after being rejected multiple times from the 30 level, has finally exited the oversold zone and has now reached 50, indicating that the bearish momentum has slightly weakened.
⚡️ The current minor resistance is at 89,458, and if the price closes above this level, we can take partial profits on our short positions, securing the desired profit from this market move.
👀 However, as you can see, I have placed a Fibonacci retracement on the chart since the price completed a bearish leg and, after reaching the 82,770 low, this bearish leg can be considered complete. Now, we are in a correction phase. As you can see, the price has not even retraced to the 0.382 Fibonacci level yet, forming a lower high below this zone.
🔼 This indicates that buyers are weak in the market, and sellers remain in control. If the price closes above 89,458, the likelihood of deeper corrections increases, which could extend to the 0.5, 0.618, or even 0.786 Fibonacci levels.
🧲 A crucial point about this Fibonacci retracement is the zone between 0.5 and 0.618, where the price has already reacted in the previous bearish leg. More importantly, the 92,433 support that was broken aligns with the 0.618 Fibonacci level, making this zone a critical PRZ (Potential Reversal Zone).
🔑 If the price breaks below 87,070, you can enter a short position, but for longs, I suggest waiting until the price forms more structure and buyers step into the market, leading to bullish momentum.
👑 BTC.D Analysis
Let’s move on to Bitcoin dominance analysis. As I mentioned yesterday, BTC dominance got rejected from 62.19, and I had said that a bearish trend was likely. That’s exactly what happened, and after BTC dominance broke below 61.49, it moved downward in a bearish leg to 60.91. Now, it is in a corrective phase.
💫 The confirmation of further downside for BTC dominance will come if it breaks below 60.91, which could trigger the next bearish leg. Currently, I do not have any bullish triggers for BTC dominance except for a reclaim of 61.49. However, since the structure is still forming, we need to wait before considering any bullish trigger.
📅 Total2 Analysis
Now, let’s move on to Total2. As I mentioned yesterday, the 1.16 level was broken, and a new support formed at 1.07. As you can see, Total2 has retraced more significantly than Bitcoin, correcting almost to the 0.382 Fibonacci level.
🎲 The reason for this deeper retracement is that Bitcoin dominance has been declining—more money has exited Bitcoin than altcoins, allowing altcoins to recover more than Bitcoin.
🔫 In Total2, we also have a major resistance zone between the 0.5 and 0.618 Fibonacci levels, similar to Bitcoin. In general, both Bitcoin and Total2 have a critical resistance zone between their respective 0.5 and 0.618 Fibonacci retracements.
💥 Currently, the key resistance is at 1.13, and if the price breaks this level, it could move towards the resistance zone. However, for short positions, if 1.07 is broken, you can enter a short trade.
✅ Be mindful of BTC dominance, as it is currently in a downtrend. If BTC.D continues to decline, shorting Bitcoin may be a better choice than shorting altcoins.
📅 USDT.D Analysis
Now, let’s analyze USDT dominance (USDT.D). Yesterday, it made a fake breakout above 5.04 and then reversed sharply downward, failing to hold the resistance. However, it has not yet formed a clear structure, so it’s too early to make any strong conclusions.
⭐️ I recommend avoiding opening new positions in the market for now and refraining from high-risk trades. The main trade opportunity was already provided when Bitcoin’s range broke down, so if you missed it, do not let FOMO push you into a trade. Avoid making rushed decisions that could put your capital at risk.
❌ Disclaimer ❌
Trading futures is highly risky and dangerous. If you're not an expert, these triggers may not be suitable for you. You should first learn risk and capital management. You can also use the educational content from this channel.
Finally, these triggers reflect my personal opinions on price action, and the market may move completely against this analysis. So, do your own research before opening any position.

TradeCityPro | Bitcoin Daily Analysis #17👋 Welcome to TradeCity Pro!
Let’s move on to the analysis of Bitcoin and key crypto indices. As I mentioned yesterday, there was a possibility that the market would undergo a correction and start ranging, and that’s exactly what happened.
✨ The price hasn’t changed much compared to yesterday, and the short positions we opened remain open for now. There’s no need to take profits yet. Let’s analyze the market to identify today’s triggers or the ones that might signal when to take profits on previous positions.
⏳ 1-Hour Timeframe
As you can see in the 1-hour timeframe, after the price formed a base at 87,700, it entered a ranging phase. The RSI, after being rejected multiple times from the 30 level, has finally exited the oversold zone and has now reached 50, indicating that the bearish momentum has slightly weakened.
⚡️ The current minor resistance is at 89,458, and if the price closes above this level, we can take partial profits on our short positions, securing the desired profit from this market move.
👀 However, as you can see, I have placed a Fibonacci retracement on the chart since the price completed a bearish leg and, after reaching the 82,770 low, this bearish leg can be considered complete. Now, we are in a correction phase. As you can see, the price has not even retraced to the 0.382 Fibonacci level yet, forming a lower high below this zone.
🔼 This indicates that buyers are weak in the market, and sellers remain in control. If the price closes above 89,458, the likelihood of deeper corrections increases, which could extend to the 0.5, 0.618, or even 0.786 Fibonacci levels.
🧲 A crucial point about this Fibonacci retracement is the zone between 0.5 and 0.618, where the price has already reacted in the previous bearish leg. More importantly, the 92,433 support that was broken aligns with the 0.618 Fibonacci level, making this zone a critical PRZ (Potential Reversal Zone).
🔑 If the price breaks below 87,070, you can enter a short position, but for longs, I suggest waiting until the price forms more structure and buyers step into the market, leading to bullish momentum.
👑 BTC.D Analysis
Let’s move on to Bitcoin dominance analysis. As I mentioned yesterday, BTC dominance got rejected from 62.19, and I had said that a bearish trend was likely. That’s exactly what happened, and after BTC dominance broke below 61.49, it moved downward in a bearish leg to 60.91. Now, it is in a corrective phase.
💫 The confirmation of further downside for BTC dominance will come if it breaks below 60.91, which could trigger the next bearish leg. Currently, I do not have any bullish triggers for BTC dominance except for a reclaim of 61.49. However, since the structure is still forming, we need to wait before considering any bullish trigger.
📅 Total2 Analysis
Now, let’s move on to Total2. As I mentioned yesterday, the 1.16 level was broken, and a new support formed at 1.07. As you can see, Total2 has retraced more significantly than Bitcoin, correcting almost to the 0.382 Fibonacci level.
🎲 The reason for this deeper retracement is that Bitcoin dominance has been declining—more money has exited Bitcoin than altcoins, allowing altcoins to recover more than Bitcoin.
🔫 In Total2, we also have a major resistance zone between the 0.5 and 0.618 Fibonacci levels, similar to Bitcoin. In general, both Bitcoin and Total2 have a critical resistance zone between their respective 0.5 and 0.618 Fibonacci retracements.
💥 Currently, the key resistance is at 1.13, and if the price breaks this level, it could move towards the resistance zone. However, for short positions, if 1.07 is broken, you can enter a short trade.
✅ Be mindful of BTC dominance, as it is currently in a downtrend. If BTC.D continues to decline, shorting Bitcoin may be a better choice than shorting altcoins.
📅 USDT.D Analysis
Now, let’s analyze USDT dominance (USDT.D). Yesterday, it made a fake breakout above 5.04 and then reversed sharply downward, failing to hold the resistance. However, it has not yet formed a clear structure, so it’s too early to make any strong conclusions.
⭐️ I recommend avoiding opening new positions in the market for now and refraining from high-risk trades. The main trade opportunity was already provided when Bitcoin’s range broke down, so if you missed it, do not let FOMO push you into a trade. Avoid making rushed decisions that could put your capital at risk.
❌ Disclaimer ❌
Trading futures is highly risky and dangerous. If you're not an expert, these triggers may not be suitable for you. You should first learn risk and capital management. You can also use the educational content from this channel.
Finally, these triggers reflect my personal opinions on price action, and the market may move completely against this analysis. So, do your own research before opening any position.

USDT.D H8 : Important Chart for Crypto market Hi Guys,
Hello friends
Perhaps it can be said that the most important chart in the crypto market these days is the Tether chart. It can help you a lot in your trading.
SecondChanceCrypto
⏰ 26/FEB/25
⛔️DYOR
Always do your research.
If you have any questions, you can write them in the comments below and I will answer them.
And please don't forget to support this idea with your likes and comments.

TradeCityPro | Bitcoin Daily Analysis #16👋 Welcome to TradeCity Pro!
Let’s move on to the analysis of Bitcoin and key crypto indices. Yesterday, Bitcoin experienced a very sharp and intense bearish move. If you have been following the analysis, you probably already had a short position. I’d be happy if you share the positions you opened in the comments.
⏳ 1-Hour Timeframe
Well, in this one-hour timeframe, as you can see, the price finally broke the 95,108 level, and as I have mentioned in several past analyses, this level is much more important than 92,702 for us. The reason is that the reactions that the price has had to this level have been far more significant than 92,702, making it a very important support.
📉As you can see, with a candle closing below this level, this trigger was activated, and the price made a downward move. The next trigger at 93,899 was broken, and eventually, after breaking 92,702, the price started its next bearish leg. At present, the price has found support at 88,229, and we are witnessing a green 1-hour candle.
🔄 The positions that we could have opened earlier were with the break of 96,205, which we opened a position for, and the next key levels yesterday where we could have opened positions were 95,108 and 93,899. I hope you opened these positions and made a profit.
💥 At present, the RSI indicator, as you can see, is deep in oversold territory and has formed a double bottom in the oversold area. If it finally exits the oversold zone and moves above 30, this double bottom will be activated, and we can say that the market momentum is shifting out of its bearish phase and may enter a ranging phase.
⚡️ Today, I cannot provide any trade triggers. Yesterday was the key day to enter positions. However, the current support level is 88,229, and the recent high is at 92,444.
🧩 I have nothing more to say about Bitcoin. We have a bearish leg with good momentum, and we need to wait for the price to create a structure before we can analyze Bitcoin again.
👑 BTC.D Analysis
Let’s move on to Bitcoin dominance. As you can see, yesterday, BTC dominance closed above the 61.49 level, and after a pullback to this zone, it made a sharp move up to 62.19. It even surpassed our 62% target, forming a top during Bitcoin’s first bearish leg.
✅ However, during the second bearish leg that the market experienced, BTC dominance declined, which caused Bitcoin to drop more than altcoins in this move, whereas in the first leg, altcoins had dropped more than Bitcoin. So, in a way, we can say that both had almost the same proportion of decline.
💫 BTC dominance seems to have formed its top at 62.19 and could now range between 61.49 and 62.19.
📅 Total2 Analysis
Now, let’s move on to Total2. Yesterday, the 1.19 trigger was activated, and another key level that was broken was 1.16, and with the break of either of these levels, you could have opened a position. At present, the price has reached 1.07.
⭐️ There is not much else to say about Total2. We need to see at what level it will form its bottom and what kind of structure will be created for either a correction or the continuation of the bearish trend. Currently, the most important support level is 1.07, which the price has reacted to multiple times in the past.
📅 USDT.D Analysis
USDT dominance, after closing above 4.62, successfully held above 4.75, which was the main resistance for USDT.D, and then made a sharp upward move. Currently, it has reached 5.04, which is a very important historical level, and has shown a reaction to it.
🔫 There isn’t much to discuss about this index, and overall, there isn’t much to analyze in the market today. Most of today’s discussion is about the positions that could have been opened and the profits that could have been made, which I already covered in Bitcoin’s analysis.
🧲 For now, we need to wait until the market forms a new structure, and once that happens, we can look for the next trade setup for the next major leg.
❌ Disclaimer ❌
Trading futures is highly risky and dangerous. If you're not an expert, these triggers may not be suitable for you. You should first learn risk and capital management. You can also use the educational content from this channel.
Finally, these triggers reflect my personal opinions on price action, and the market may move completely against this analysis. So, do your own research before opening any position.

Univers Of Signals| ENSUSDT Better Status Than AltcoinsLet's go together with one of the popular layer two coins that works in domain and address naming services for wallets and recently announced that it will launch layer two soon
🌐 Overview Bitcoin
Before starting the analysis, I want to remind you again that we moved the Bitcoin analysis section from the analysis section to a separate analysis at your request, so that we can discuss the status of Bitcoin in more detail every day and analyze its charts and dominances together.
This is the general analysis of Bitcoin dominance, which we promised you in the analysis to analyze separately and analyze it for you in longer time frames.
📊 Weekly Timeframe
On the weekly time frame, ENS is one of the bullish coins in the market that has a good situation ahead and has started its main upward movement before the start of 2025 and in late 2023
After the start of the main movement after the 9.99 break, we started our main upward trend and we can say that we broke our ceiling in terms of market cap and made a new ATH market cap
We are also on a curve line that is bullish and supportive in nature and if this line is broken, it shows us that the main upward trend has weakened and if we go below 15.90, we will see a trend change in MWC
For re-entry, the 47.68 break is an interesting trigger and you can buy again and if the exit trigger is below 15.90, you can exit and for now, I recommend You can't buy in this time frame
📈 Daily Timeframe
In the daily time frame, however, it has held its own more than the rest of the altcoins and is suffering in its daily box between 24.78 and 27.55, which happened after the rejection at 47.68.
Also, in this time frame, we have a trend line that if the price reaches it, we will have the possibility of reacting and we will use it as a tool to save profit in the lower time frame if we react to it.
Also, the rejection candle that closes from this resistance at 27.55 in the same way, we will have the possibility of continuing the downtrend, and if 24.78 is broken, we can move towards 20.81 and 15.90. And for buying, if this support is faked or the 35.98 trigger is activated, I will buy, and in this box, I will only I trade in futures
⏱ 4-Hour Timeframe
In the four-hour time frame, what happened is that we faked the resistance above the box, which increases the probability of breaking the support floor
📉 Short Position Trigger
you can open a position with this four-hour candle as a guide, but on the other hand, it is better to wait for the support to reach 24.79 and the reaction from it and then follow its breakdown
📈 Long Position Trigger
we need to return to the ceiling again for now, and if we return above the support level sooner, we can think more about breaking 27.91 and open a more confident long position .
📝 Final Thoughts
Stay calm, trade wisely, and let's capture the market's best opportunities!
This analysis reflects our opinions and is not financial advice.
Share your thoughts in the comments, and don’t forget to share this analysis with your friends

USDT DOMINANCE UPDATE (4H)First of all you should know that "USDT Dominance" is always moving inverse of BTCUSDT .
To be honest with you, the market is in terrible condition. Buying pressure on Tether dominance is high. The recent pumps in altcoins were mainly to liquidate short positions; otherwise, the overall trend for altcoins remains bearish.
Tether dominance seems to be aiming to hunt higher supply zones. In high-volume altcoins like Ethereum, key levels have been lost, so we can rely on this Tether dominance analysis.
We will either move up from this area or from the green lines.
This move may take several months.
For risk management, please don't forget stop loss and capital management
Comment if you have any questions
Thank You

USDT.D is getting strength what next..?USDT dominance CRYPTOCAP:USDT.D is showing signs of breaking above the resistance zone after successfully retesting the 100 EMA. If this breakout sustains, it signals a shift toward stablecoins, indicating lower risk appetite among traders.
This is generally a bearish sign for altcoins, as rising USDT.D suggests capital is flowing out of riskier assets. If confirmed, we could see increased selling pressure across the altcoin market.

Univers Of Signals| Bitcoin Daily Analysis #15Let's dive into the analysis of Bitcoin and key crypto indicators. In this analysis, as per the routine on Mondays, I’ll also review the chart in higher timeframes for you to see what price scenarios might be likely for the coming week.
📅 Daily Timeframe
In the daily timeframe, as you can see, the price is still in a very small trading range, oscillating from the 95108 area to the 98482 area, forming a very small range within a larger range box that extends from 92702 to 105928.
📊 As you can observe, the market volume within this box has significantly decreased and is continuing to diminish, indicating that traders and market participants are gradually decreasing. If this box breaks, the price can determine its next direction and movement leg.
🔽 If the 95108 area breaks, the next area will be 92702, which is the bottom of the range box. If this support breaks, the next support area will be at 87000.
✅ Conversely, if the price breaks the range box upward, breaking 98482 could lead the price towards the upper resistance areas of 101234 and 105928. The main confirmation for the next upward trend will be with the breaking of 105928, and if this area, which is also Bitcoin’s ATH, is broken, we can say that the price can move towards higher targets and new ATHs.
💥 In the RSI oscillator, as you see, this indicator is oscillating between two very important areas from 40.73 to 51.34, and breaking either could give us a confirmation of the RSI momentum.
⚡️ Let's go to the four-hour timeframe to observe the price movement with more details.
⏳ 4-Hour Timeframe
As you see, we are in a range box that was visible in the daily timeframe as well, ranging from 95108 to 98482. This box has been faked once from the bottom and once due to the news of the hack at the Bybit exchange, causing the price to fake the top of this range box and move downward.
🧩 Currently, as you see, the number of hits to the bottom of the box has significantly increased, which increases the likelihood of this box’s floor breaking. Therefore, if 95108 breaks, I will try to enter a position and will show you later in the analysis how we can decide to open a short position on altcoins or on Bitcoin.
🔼 For long positions, the trigger at 96847 is suitable, but it is better to go to the one-hour timeframe to find better and more appropriate futures triggers.
⏳ 2-Hour Timeframe
Let's go to the one-hour timeframe, a timeframe I analyze for you every day. Yesterday, the trigger I gave at 96205 was activated and gave very good profits, and the price almost reached the bottom of the box. After that, with a strong candle and a lot of buying volume that you saw, the price pulled back to this area again, so this area could become an important area in the future and I will keep this line on the chart for now.
📈 If the price breaks this area upward this time, and if the candle is of good volume and shape, I will definitely open a long position, and our next trigger for long will be at 96847.
🔑 But as you see, the price also reacted yesterday to the top of the Expanding Triangle area, and as you see, it both got rejected from this top and reacted with a shadow to it and pulled back to it.
📊 The market volume is also increasing. This drop that the price has started and the same causes the likelihood of breaking 95108 to increase. So I suggest if the price reaches near this area and gives you a good stop loss placement, definitely have a stop sell below this area so that if the price moves sharply downward, your position is activated and you don’t miss the price movement.
📉 The next price support will be at 93899, and we also have dynamic support at the bottom of the Expanding Triangle that can act as a good target and support from the price. I don’t see any other important points, so let’s move on to dominance analysis.
👑 BTC.D Analysis
Let's go to the analysis of Bitcoin dominance. As you see, yesterday, after recording a new low in the area of 60.72, it gained a very good upward momentum and moved upwards, and after breaking 61.04, it re-entered the range box and this morning also broke the top of the box, which was area 61.49, and this increase in Bitcoin dominance caused altcoins to drop much more than Bitcoin.
🔍 If this trend of Bitcoin dominance continues, if the floor 95108 in Bitcoin breaks, opening a short position on altcoins would be more logical than Bitcoin because more money is leaving altcoins than Bitcoin.
🤝 Let's go to the analysis of Total2 and review the appropriate triggers for altcoins for you.
📅 Total2 Analysis
As you see in Total2, yesterday's trigger at 1.22 was activated, and as we saw in Bitcoin dominance, altcoins dropped much more than Bitcoin, definitely giving you very good profits. I would be happy if you opened a position with this trigger, definitely tell in the comments so I am aware that you are using the triggers I provide in the analysis.
💫 As you see, the area 1.19 overlaps with the 95108 area in Bitcoin, but Total2 has broken this area. The reason is that Bitcoin dominance is rising, which causes that even though Bitcoin is still on support and has not broken its support, Total2 has broken its support and can now move towards the area 1.16.
🔑 If you have altcoins in mind that give a trigger for entering a short position now, you can open a position on them. For long positions, in my opinion, today the market will not give a long trigger. But if this downward movement is faked and the price moves upwards with the confirmation of theory and setting higher lows and highs, you can open a long position.
📅 USDT.D Analysis
As you see, USDT.D has activated its short trigger in the area of 4.62 and yesterday rose from the support of 4.52 and moved upwards. If dominance can stabilize above 4.62, we can expect it to move towards 4.75, and this could be a very suitable confirmation for opening a short position on altcoins.
✅ But everything depends on Bitcoin dominance, and with the movement of Bitcoin dominance, you can decide whether to open this position on altcoins or on Bitcoin itself. For long positions and confirmation of a bearish trend in Tether dominance, you must wait until the price forms a new structure again, and in my opinion, if this break is faked, area 4.52 will become a very important area.
❌ Disclaimer ❌
Trading futures is highly risky and dangerous. If you're not an expert, these triggers may not be suitable for you. You should first learn risk and capital management. You can also use the educational content from this channel.
Finally, these triggers reflect my personal opinions on price action, and the market may move completely against this analysis. So, do your own research before opening any position.

TradeCityPro | Bitcoin Daily Analysis #15👋 Welcome to TradeCityPro!
Let's dive into the analysis of Bitcoin and key crypto indicators. In this analysis, as per the routine on Mondays, I’ll also review the chart in higher timeframes for you to see what price scenarios might be likely for the coming week.
📅 Daily Timeframe
In the daily timeframe, as you can see, the price is still in a very small trading range, oscillating from the 95108 area to the 98482 area, forming a very small range within a larger range box that extends from 92702 to 105928.
📊 As you can observe, the market volume within this box has significantly decreased and is continuing to diminish, indicating that traders and market participants are gradually decreasing. If this box breaks, the price can determine its next direction and movement leg.
🔽 If the 95108 area breaks, the next area will be 92702, which is the bottom of the range box. If this support breaks, the next support area will be at 87000.
✅ Conversely, if the price breaks the range box upward, breaking 98482 could lead the price towards the upper resistance areas of 101234 and 105928. The main confirmation for the next upward trend will be with the breaking of 105928, and if this area, which is also Bitcoin’s ATH, is broken, we can say that the price can move towards higher targets and new ATHs.
💥 In the RSI oscillator, as you see, this indicator is oscillating between two very important areas from 40.73 to 51.34, and breaking either could give us a confirmation of the RSI momentum.
⚡️ Let's go to the four-hour timeframe to observe the price movement with more details.
⏳ 4-Hour Timeframe
As you see, we are in a range box that was visible in the daily timeframe as well, ranging from 95108 to 98482. This box has been faked once from the bottom and once due to the news of the hack at the Bybit exchange, causing the price to fake the top of this range box and move downward.
🧩 Currently, as you see, the number of hits to the bottom of the box has significantly increased, which increases the likelihood of this box’s floor breaking. Therefore, if 95108 breaks, I will try to enter a position and will show you later in the analysis how we can decide to open a short position on altcoins or on Bitcoin.
🔼 For long positions, the trigger at 96847 is suitable, but it is better to go to the one-hour timeframe to find better and more appropriate futures triggers.
⏳ 1-Hour Timeframe
Let's go to the one-hour timeframe, a timeframe I analyze for you every day. Yesterday, the trigger I gave at 96205 was activated and gave very good profits, and the price almost reached the bottom of the box. After that, with a strong candle and a lot of buying volume that you saw, the price pulled back to this area again, so this area could become an important area in the future and I will keep this line on the chart for now.
📈 If the price breaks this area upward this time, and if the candle is of good volume and shape, I will definitely open a long position, and our next trigger for long will be at 96847.
🔑 But as you see, the price also reacted yesterday to the top of the Expanding Triangle area, and as you see, it both got rejected from this top and reacted with a shadow to it and pulled back to it.
📊 The market volume is also increasing. This drop that the price has started and the same causes the likelihood of breaking 95108 to increase. So I suggest if the price reaches near this area and gives you a good stop loss placement, definitely have a stop sell below this area so that if the price moves sharply downward, your position is activated and you don’t miss the price movement.
📉 The next price support will be at 93899, and we also have dynamic support at the bottom of the Expanding Triangle that can act as a good target and support from the price. I don’t see any other important points, so let’s move on to dominance analysis.
👑 BTC.D Analysis
Let's go to the analysis of Bitcoin dominance. As you see, yesterday, after recording a new low in the area of 60.72, it gained a very good upward momentum and moved upwards, and after breaking 61.04, it re-entered the range box and this morning also broke the top of the box, which was area 61.49, and this increase in Bitcoin dominance caused altcoins to drop much more than Bitcoin.
🔍 If this trend of Bitcoin dominance continues, if the floor 95108 in Bitcoin breaks, opening a short position on altcoins would be more logical than Bitcoin because more money is leaving altcoins than Bitcoin.
🤝 Let's go to the analysis of Total2 and review the appropriate triggers for altcoins for you.
📅 Total2 Analysis
As you see in Total2, yesterday's trigger at 1.22 was activated, and as we saw in Bitcoin dominance, altcoins dropped much more than Bitcoin, definitely giving you very good profits. I would be happy if you opened a position with this trigger, definitely tell in the comments so I am aware that you are using the triggers I provide in the analysis.
💫 As you see, the area 1.19 overlaps with the 95108 area in Bitcoin, but Total2 has broken this area. The reason is that Bitcoin dominance is rising, which causes that even though Bitcoin is still on support and has not broken its support, Total2 has broken its support and can now move towards the area 1.16.
🔑 If you have altcoins in mind that give a trigger for entering a short position now, you can open a position on them. For long positions, in my opinion, today the market will not give a long trigger. But if this downward movement is faked and the price moves upwards with the confirmation of theory and setting higher lows and highs, you can open a long position.
📅 USDT.D Analysis
As you see, USDT.D has activated its short trigger in the area of 4.62 and yesterday rose from the support of 4.52 and moved upwards. If dominance can stabilize above 4.62, we can expect it to move towards 4.75, and this could be a very suitable confirmation for opening a short position on altcoins.
✅ But everything depends on Bitcoin dominance, and with the movement of Bitcoin dominance, you can decide whether to open this position on altcoins or on Bitcoin itself. For long positions and confirmation of a bearish trend in Tether dominance, you must wait until the price forms a new structure again, and in my opinion, if this break is faked, area 4.52 will become a very important area.
❌ Disclaimer ❌
Trading futures is highly risky and dangerous. If you're not an expert, these triggers may not be suitable for you. You should first learn risk and capital management. You can also use the educational content from this channel.
Finally, these triggers reflect my personal opinions on price action, and the market may move completely against this analysis. So, do your own research before opening any position.

TradeCityPro | Bitcoin Daily Analysis #14👋 Welcome to TradeCityPro!
In this analysis, as usual, I aim to review the critical futures triggers for the New York session.
📰 Yesterday, news of the Bybit exchange hack emerged, and I will examine its impact on the charts and what it may mean for Bitcoin's future.
⏳ 1-Hour Timeframe
As observed, before the Bybit hack news, Bitcoin was trending upward and had breached the 98482 area. However, when the news broke, Bitcoin took a sharp downward turn, moving straight down to the box floor at 95108.
🔍 Bybit was reportedly hacked for $1.5 billion. Official statements assure that the exchange can fully reimburse its users, suggesting no substantial long-term financial impacts. The Bitcoin movement appears to be a reactionary drop due to the severe nature of the news and is not likely to have a lasting effect.
✨ However, it has shown that the 95108 area is extremely reliable and significant, potentially becoming a key level in the future. As you can see, I have retained the triangle that the price had been reacting to in recent weeks. If there is no reaction today, I will remove this triangle from tomorrow's chart as it appears that the price is more consistently within the box between 95108 and 98482, and the expanding triangle no longer seems relevant.
🔼 Currently, I cannot provide a firm long trigger for futures, and I have removed the 97816 trigger used previously. Such triggers are ineffective after being activated once, and we must wait for the price to establish a new structure.
⚡️ A risky long position could be taken on the breakout of 96516, which has been activated. If you observe a suitable candle with strong momentum during a pullback to this area, you may consider entering.
📉 For a short position, the very reliable trigger remains at 95108. If this area breaks, I will personally attempt to open a short position, as the strong reaction to yesterday's news demonstrated this support's significance.
📅 BTC.D Analysis
The situation hasn't changed much, and Bitcoin dominance continues to range as it has in previous days.
✅ Still, if the 61.04 level breaks, it confirms a bearish dominance, and a breakout of 61.49 would confirm bullish dominance.
📅 Total2 Analysis
For Total2, the trigger activated yesterday was a fake-out, but it caused the trigger to shift. Currently, there is a very promising long trigger for Total2 at 1.26, which the price has reacted to very well, suggesting it is a reliable area. For short positions, entering upon breaking 1.19 could be considered.
🧩 These positions are risky, and the main triggers are for breaking out of the box that lies between 1.16 and 1.28.
📅 USDT.D Analysis
USDT dominance reached the bottom of the box yesterday at 4.40 and showed a very strong reaction. Along with the Bybit hack news, it moved sharply upward to 4.62.
💫 Currently, dominance has been rejected from this area and returned to the middle of the box, indicating that the 4.40 and 4.62 levels are important for confirming positions. If either of these levels breaks, we can secure a long-term confirmation for the bullish or bearish direction of Bitcoin dominance.
❌ Disclaimer ❌
Trading futures is highly risky and dangerous. If you're not an expert, these triggers may not be suitable for you. You should first learn risk and capital management. You can also use the educational content from this channel.
Finally, these triggers reflect my personal opinions on price action, and the market may move completely against this analysis. So, do your own research before opening any position.
