USDTDOMINANCE CHART UPDATE !The chart highlights USDT dominance (USDT.D), which is used to measure market sentiment and money flow into or out of stablecoins such as USDT
The chart shows a completed “head and shoulders” pattern, which is often considered bearish in technical analysis.
The neckline has been broken, indicating the possibility of further declines.
The price appears to be testing a descending triangle, which could indicate a continuation of the decline.
The green area below (possibly around 2.5%-3%) could act as a crucial support if dominance continues to decline.
The 50-day (red) and 200-day (green) moving averages are plotted.
Dominance is trading below both moving averages, which reinforces bearish momentum.
A breakdown of the current triangle could lead to further declines towards the marked support area.
If you found this analysis helpful, hit the Like button and share your thoughts or questions in the comments below. Your feedback matters!
Thanks for your support!
DYOR. NFA
Usdtdominance

Tether Dominance Update (8H)This analysis is an update of the analysis you see in the "Related publications" section
First of all you should know that "USDT Dominance" is always moving inverse of BTCUSDT .
According to the previous analysis, wave G has formed, and the price is now dropping.
For the next move, there is a possibility of a pullback toward the red box, followed by a deeper correction.
Overall, the price could drop further.
For risk management, please don't forget stop loss and capital management
Comment if you have any questions
Thank You

USDT dominance on verge of breaking down!!Join our community and start your crypto journey today for:
In-depth market analysis
Accurate trade setups
Early access to trending altcoins
Life-changing profit potential
Let's analyze USDT dominance :
USDT dominance (USDT.D) recently failed to break below its support level of 3.83%. This failure led to a surge in USDT.D, pushing it up to the 4.28% level. However, it encountered resistance at 4.28% and was subsequently rejected, returning to the 3.83% support level.
A sustained break below this 3.83% support level, confirmed by a daily close below it, could potentially trigger a significant upward movement for Bitcoin (BTC), possibly leading to a price target of $120,000.
Support Levels:
3.82%
Resistance Level:
4.28%
If you find this analysis helpful, please hit the like button to support my content! Share your thoughts in the comments and feel free to request any specific chart analysis you’d like to see.
Happy Trading!!

USDT Dominance Breakdown = Crypto Rally?USDT dominance has broken a long-term trendline and is now testing a critical support zone around 4.0%. If it drops below 3.8%, we could see a strong shift towards a risk-on environment, fueling a major rally in Bitcoin and altcoins.
However, if this level holds, we might see temporary consolidation before the next move. Historically, a decline in USDT dominance signals capital rotation into crypto, increasing the chances of an altseason breakout.
The coming days are crucial—watch this level closely!
Thank You!

USDT.D at Key Support: Will Altseason Ignite?USDT.D Weekly Analysis:
Key Zone: USDT.D is trading at a critical support zone, with a successful retest of the broken trendline confirming bearish momentum.
Bearish Potential: A breakdown could lead to a 48% drop in dominance, paving the way for an altseason as funds rotate out of stablecoins.
Bullish Risk: If the support holds, bearish momentum could stall, delaying the altcoin rally.

Bitcoin breakout as USDT.D breaks down, is it happening now?Refer to previous analysis in links below.
As you can see USDT.D is now trying to break below the trendline that caused 3 flash crashes in a row. Will it be confirmed by the end of the day's candle or will this be a bull trap and the candle wicks back above the trendline and then a flash crash? We watch and see. Easy trade for both short and long here with stop loss that cuts off the loser and the winner runs.
Don't forget to smash that rocket like button or give me your take in the comments below.

USDT Dominance (USDT.D)USDT Dominance (USDT.D)
The USDT Dominance chart reflects the percentage of the cryptocurrency market capitalization held in Tether (USDT), providing insights into market sentiment and risk appetite. Here's an analysis based on the chart structure:
Key Levels and Observations:
Supply Zone at 6.50%:
The 6.50% level acts as a critical resistance where the "Bull vs Bear Flip" is observed. This zone marks the upper limit of a supply area, where sellers are dominant.
A rejection here could signal an increase in market risk appetite as funds flow out of USDT and back into crypto assets.
Demand Zone at 3.63%:
The 3.63% level serves as a strong demand zone, historically supporting USDT.D during bearish periods in the broader market.
This is marked as the lower boundary of the "Bull vs Bear Flip," indicating increased caution if revisited.
Median Level at 4.48%:
The chart highlights the 4.48% level as the median point, balancing bullish and bearish sentiment. Current price action is hovering around this zone, signaling indecision and a potential breakout or breakdown.
Harmonic Pattern Formation:
A harmonic pattern is evident, with key retracement levels at 0.449 and 0.734 marking the price's journey from points X, A, B, C, and D.
Point D, near 3.63%, aligns with the demand zone, completing the pattern and triggering a potential bounce.
Rounded Bottom Formation:
A rounded bottom is visible on the left side of the chart, indicating a previous reversal from bearish to bullish sentiment. This reinforces the importance of the 3.63% level as a long-term support.
Bear Zone at 2.83%:
Below the demand zone lies the 2.83% "Bear Zone," signaling extreme bearish sentiment for USDT dominance and likely strong risk appetite in the crypto market.
Scenarios to Watch:
Bullish Scenario:
A breakout above the 4.48% median and sustained movement toward the supply zone at 6.50% would signal increased market caution as investors move to USDT.
If the 6.50% level is breached with volume, USDT.D could trend higher, indicating market-wide fear or profit-taking in crypto.
Bearish Scenario:
A breakdown below the 4.48% median would confirm bearish momentum, with the next target being the demand zone at 3.63%.
A fall below 3.63% could lead to a retest of the 2.83% "Bear Zone," indicating renewed bullish sentiment for crypto assets.
Volume Analysis:
Recent volume spikes during the recovery indicate significant interest at current levels.
However, diminishing volume near resistance suggests hesitation among market participants, requiring confirmation of the next directional move.
Conclusion:
The USDT Dominance chart is currently in a state of equilibrium around the median level (4.48%), reflecting market indecision. The next significant move will likely depend on whether the supply zone (6.50%) or demand zone (3.63%) is tested first. Traders should watch for volume confirmation and macroeconomic catalysts for the next trend in risk sentiment.

USDT.D : Roadmap For crypto market with USDT Hi Friends,
As you can see in the Tether chart, we did not reach the previous low, but Bitcoin managed to experience its highest price. This is also a type of negative divergence. Please be very careful with Bitcoin. The market is very emotional.
SecondChanceCrypto
⏰ 20/Jan/25
⛔️DYOR
Always do your research.
If you have any questions, you can write them in the comments below and I will answer them.
And please don't forget to support this idea with your likes and comments.

Crypto is going highUSDT.D is quite weak lately.
If a red candle closes below the pink box, you can buy more crypto.
This is just for entertainment to hit "Play" in the future and see how right or wrong I was :)

What is the current structure of USDT.D (8H)?This analysis is an update of the analysis you see in the "Related publications" section
It seems the structure is a diametric, and wave F is nearing completion. Wave F was a bearish wave.. A bullish G wave remains in this structure. Let's see which direction the market will take.
For risk management, please don't forget stop loss and capital management
Comment if you have any questions
Thank You

USDT.D Retests Breakdown: Is a Strong Altcoin Rally Ahead?USDT Dominance (USDT.D) has broken below its rising trendline and is trading at a key support zone after a successful retest of the breakdown. A break below this support could trigger a sharp decline, signaling capital rotation into altcoins.
This setup aligns with the potential for a strong altcoin season and an active trading period ahead.
The broader outlook of Tether dominance (8H)First of all you should know that "USDT Dominance" is always moving inverse of BTCUSDT
Many are asking about a broader perspective on Tether dominance. Our outlook from a zoomed-out perspective is as follows.
The green zone is very strong and unbreakable!
For risk management, please don't forget stop loss and capital management
Comment if you have any questions
Thank You

USDT.D Time To say byeit was a hard week and the price of the market got crazy
but that's fine bcz all was shared over here
the handle and cup pattern has been drew long time ago , and now it's confirming
just a little bit and the order block gonna break.
Good luck happy trade

USDT.D UPDATE (12H)This analysis is an update of the analysis you see in the "Related publications" section
No need to open sell/short positions or close buy/long positions
Based on previous analyses, we anticipated that there wouldn't be a significant upward move for Tether dominance. We are not truly bullish on Tether dominance. If the price returns to the yellow circle, we can look to rebuy or add volume on altcoins and Bitcoin.
For risk management, please don't forget stop loss and capital management
Comment if you have any questions
Thank You

USDT.D New Update (8H)Read the text carefully
It seems that Tether dominance is completing a Diametric pattern instead of an Expanding Triangle. This is because if it were an Expanding Triangle, the movement following wave E should not have occurred with such speed and strength
Currently, we can expect an upward movement from the green zone
Let's see if wave G is normal or truncated. If it is normal, it can move upward to the yellow zone but
If wave G becomes truncated, it may not create a significant high
Overall, the structure of Tether dominance appears bearish in larger timeframes
For risk management, please don't forget stop loss and capital management
Comment if you have any questions
Thank You

BTC could dump again if USDT.D chart does same thing againThe last time I posted this was when USDT Dominance chart touched the green trendline on the chart and bounced off the red trendline on the RSI.
Will this happen again causing another flash dump or will the bullish scenario I posted in last analysis (see below chart link) come to fruition?
As you can see the blue trendline on chart at 91790usd is major support.
The RSI pink trendline on left chart shows it is at resistance right now.
What just happened was a failed attempt to close a possible head and shoulders pattern, trapping shorts under the support causing this short squeeze in play right now. The question is whether the pump will continue or will it go back down. The USDT.D chart will tell us.
Hit the like idea rocket button if you like the idea and analysis.

USDT.D at Key Support: Altcoin Bull Rally Ahead?USDT.D has repeatedly bounced off the marked red support zone, a strong Fibonacci level at 0.5. This support has been tested multiple times, and based on my experience, I anticipate USDT.D may break below this zone. If it does, it could trigger a bullish rally in altcoins.
I believe this is the final shakeout phase, so stay strong and focus on accumulating fundamentally solid coins. Remember to maintain discipline and practice strong money management.
USDT.DIntroduction
The analysis of Tether Dominance (USDT Dominance) is one of the most essential tools for predicting overall trends in the cryptocurrency market. This metric plays a crucial role in understanding investor behavior, particularly during periods when the market leans towards liquidity or transitions into a bullish phase. This report delves into the technical aspects of Tether Dominance, offering a detailed review of its current state and outlining potential future scenarios. It serves as a valuable resource for millions of investors seeking informed decision-making.
USDT Dominance Analysis
Definition and Importance of USDT Dominance
USDT Dominance reflects the percentage of the stablecoin USDT's market share relative to the total cryptocurrency market.
🔹 Increase in Dominance: Indicates investor preference for holding cash, often signaling market downturns.
🔹 Decrease in Dominance: Suggests capital is flowing into cryptocurrencies, signaling potential price growth.
Technical Overview
1. Breakout of the Ascending Channel
✅ Current Status:
USDT Dominance has broken below its ascending channel and entered a consolidation range.
✅ Range Box Details:
Upper Limit: Green Zone (6.17 - 6.53)
Lower Limit: Red Zone (3.73 - 3.99)
2. Price Target Based on Broken Channel
🔸 Bearish Target Estimate:
The projection based on the broken ascending channel suggests that USDT Dominance might drop to the gray support zone (2.99 - 3.16).
Possible Scenarios
Bearish Scenario
📉 Condition: Breaking below the red support zone (3.73 - 3.99).
📉 Target: A decline towards the gray support zone (2.99 - 3.16).
📉 Market Impact: Bitcoin and altcoin prices may rise as capital exits USDT and flows into digital assets.
Bullish Scenario
📈 Condition: Holding the red support zone and moving back toward the green resistance zone (6.17 - 6.53).
📈 Market Impact: Crypto prices may decline as demand for USDT increases.
Daily Timeframe Triangle Pattern
🔺 Observation: A triangle pattern has formed on the daily timeframe.
🔺 Prediction: A downward breakout is more likely, aligning with the bearish scenario.
Conclusion and Key Takeaways
1️⃣ Overall Trend: The trend remains bearish unless key resistance levels are broken.
2️⃣ Critical Levels:
Red Support Zone: 3.73 - 3.99
Gray Support Zone: 2.99 - 3.16
3️⃣ Trading Decisions: Focus on higher timeframes and confirmation of breakouts before making decisions.
4️⃣ Market Impact: The breakout or defense of critical USDT Dominance levels will have a significant influence on Bitcoin and altcoin movements.
🎯 Recommendation: Considering the bearish trend, approach bullish scenarios cautiously and prioritize confirmation of breakouts for accurate decision-making.

USDC Leads Stablecoin Market Cap Growth in 2024, Surpassing USDT
The year 2024 witnessed a significant shift in the stablecoin landscape, with Circle's USD Coin (USDC) demonstrating a remarkable resurgence and outperforming its main competitor, Tether's USDT, in terms of market capitalization growth. This surge marks a significant milestone for USDC, which had faced a considerable setback in 2023 following the collapse of Silicon Valley Bank (SVB). This article delves into the factors contributing to USDC's impressive recovery and its implications for the broader stablecoin market.
USDC's Rocky Road to Recovery
USDC's journey in recent years has been a rollercoaster ride. In 2023, the stablecoin experienced a substantial downturn, with its market cap plummeting by 45%. This decline was largely attributed to the collapse of SVB, where Circle had a portion of its reserves held. The bank's failure triggered a crisis of confidence in USDC, leading to significant withdrawals and a temporary de-pegging from the US dollar. This event cast a shadow over USDC's future and raised concerns about the stability of stablecoins in general.
However, USDC's performance in 2024 tells a different story. The stablecoin not only recovered from the SVB-induced slump but also surpassed USDT in market cap growth. This remarkable turnaround underscores USDC's resilience and the growing trust in its underlying mechanisms.
Factors Driving USDC's Growth
Several factors have contributed to USDC's impressive growth in 2024:
1. Increased Regulatory Clarity: The evolving regulatory landscape surrounding stablecoins has been crucial in USDC's resurgence. As governments worldwide are increasingly focusing on establishing clear frameworks for stablecoin operations, USDC's commitment to transparency and compliance has resonated with investors and users. This regulatory clarity has fostered a more favorable environment for USDC, attracting both institutional and retail adoption.
2. Focus on Trust and Transparency: Circle has prioritized building trust and transparency in its operations. The company regularly publishes attestations of its reserves, providing assurance to users that USDC is fully backed by traditional assets. This commitment to transparency has been instrumental in restoring confidence in USDC following the SVB crisis.
3. Expansion of Blockchain Infrastructure: The continuous development and expansion of blockchain infrastructure have also contributed to USDC's growth. As more blockchain networks integrate USDC, its utility and accessibility increase, driving adoption and market capitalization.
4. Growing Institutional Adoption: USDC has witnessed increasing adoption among institutional investors. These investors are drawn to USDC's stability, transparency, and regulatory compliance, making it a preferred choice for various use cases, including trading, lending, and payments.
5. Market Demand for Diversification: The stablecoin market has been increasingly seeking diversification beyond USDT. Concerns about the composition of Tether's reserves and its lack of transparency have led investors to explore alternative stablecoins. USDC, with its focus on transparency and regulatory compliance, has emerged as a leading beneficiary of this trend.
USDC vs. USDT: A Closer Look
USDC and USDT are the two dominant stablecoins in the market, but they differ significantly in their approach and underlying mechanisms.
• Transparency and Audits: USDC has been lauded for its transparency, with regular audits and attestations of its reserves. In contrast, Tether has faced criticism for its lack of transparency and the composition of its reserves.
• Regulatory Compliance: Circle has actively engaged with regulators and prioritized compliance, while Tether has faced regulatory scrutiny in various jurisdictions.
• Market Capitalization: While USDT still holds the largest market share, USDC has been steadily closing the gap, driven by its strong growth in 2024.
Implications for the Stablecoin Market
USDC's surge has significant implications for the broader stablecoin market:
• Increased Competition: USDC's growth has intensified competition in the stablecoin market, challenging USDT's dominance. This competition is healthy for the market, driving innovation and improving standards.
• Focus on Transparency and Compliance: USDC's success has reinforced the importance of transparency and regulatory compliance in the stablecoin industry. This trend is likely to continue, with stablecoin issuers prioritizing these aspects to gain trust and adoption.
• Growing Institutional Interest: The increasing institutional adoption of USDC signals a growing acceptance of stablecoins as a legitimate asset class. This trend is likely to attract more institutional investors to the stablecoin market, further driving its growth.
Conclusion
Circle's USDC has demonstrated a remarkable recovery and growth in 2024, outperforming Tether's USDT in market cap surge. This resurgence can be attributed to several factors, including increased regulatory clarity, a focus on trust and transparency, expansion of blockchain infrastructure, growing institutional adoption, and market demand for diversification. USDC's success has significant implications for the stablecoin market, intensifying competition, emphasizing transparency and compliance, and attracting growing institutional interest. As the stablecoin market continues to evolve, USDC is poised to play a leading role, shaping its future and driving its adoption in the broader financial ecosystem.

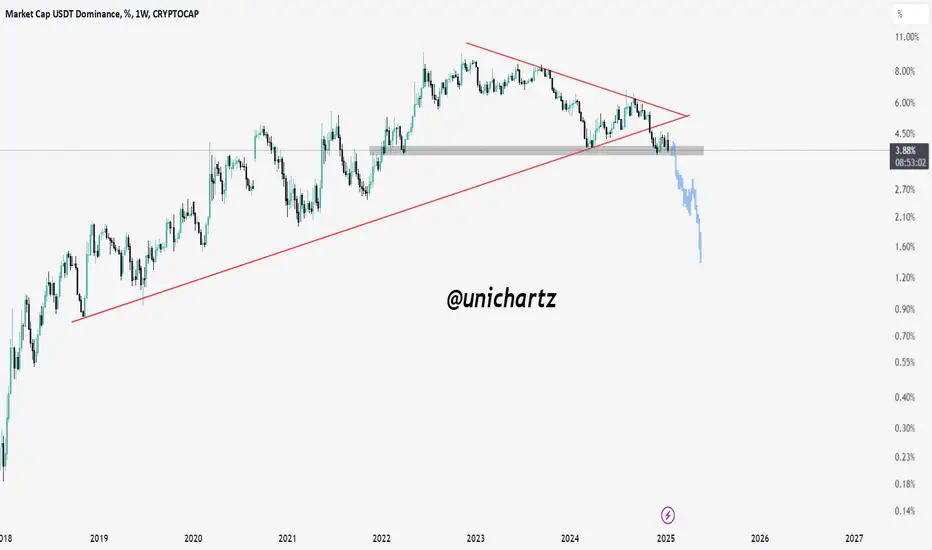
USDT.DOMINANCE CHART UPDATE !!This chart provides USDT dominance, highlighting key patterns and potential market implications:
Head & Shoulders Pattern:
The chart shows a completed Head & Shoulders pattern, indicating potential bearish momentum for USDT dominance. This often signals a rotation of capital away from stablecoins and into riskier crypto assets.
USDT dominance has broken the neckline support of the Head & Shoulders pattern and is moving toward the green horizontal demand area. This area represents a crucial support area near 2.0%-2.5%.
Resistance: The neckline and the descending trendline around 4.25% now act as resistance.
Support: The green demand area near 2.0%- 2.5% is crucial. A sustained move into this area could coincide with a strong crypto market rally.
A continued decline in USDT dominance indicates growing confidence in the crypto market, with investors pouring funds into altcoins and Bitcoin.
Conversely, any improvement in USDT dominance could indicate an increase in risk aversion.
Let me know if you’d like further assistance or adjustments!
DYOR. NFA

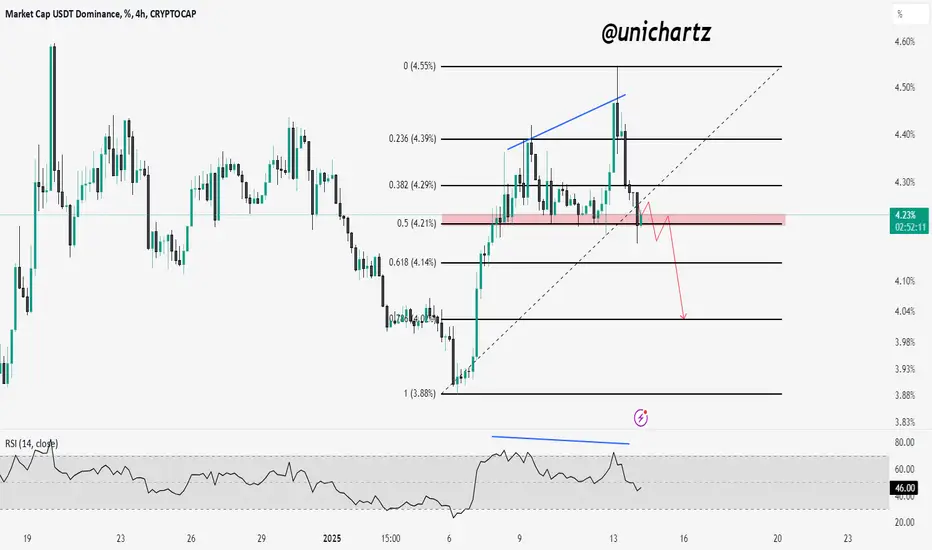
USDT DOMINANCE new update (4H)This analysis is an update of the analysis you see in the "Related publications" section
First of all you should know that "USDT Dominance" is always moving inverse of BTCUSDT .
We have reached the red-marked area from the previous analysis, but the bullish momentum of the candles is strong.
In previous analyses, we considered the triangle as a contracting triangle, but it is possible that Tether dominance is forming an expanding triangle or even a diametric pattern.
We have two zones for the completion of wave e.
If the price breaks through supply zone 1, it will be rejected from supply zone 2.
For risk management, please don't forget stop loss and capital management
Comment if you have any questions
Thank You

BTC.D Death Cross Formation:
The “death cross” occurs when the short-term moving average (50-day MA) crosses below the long-term moving average (200-day MA).
This is considered a bearish signal, often indicating a potential decline in the market.
In your chart, the highlighted circle represents this potential crossover or the situation after it.
The narrow trendline indicates a symmetrical triangle or wedge formation, where the price consolidates before the breakout.
The breakout direction appears to be initially upward, breaking above resistance but eventually moving downward.
The blue horizontal line at around 59.21% dominance is a key resistance area.
Bitcoin dominance has broken above the triangle for some time but may struggle to remain above resistance.
After initial upward movement, the chart suggests a downward trajectory, possibly retesting lower dominance levels (towards the 55.50% and 54% areas).
This implies a potential altcoin resurgence or broader market uncertainty if BTC.D declines.
The red and green moving averages are important in defining the current trend.
A bearish cross between these moving averages aligns with the death cross narrative and signals caution.
Let me know if you’d like further assistance or adjustments!
DYOR. NFA

USDT Dominance Falls, BTC Rises: What It Means for TradersThe chart highlights the inverse relationship between BTC/USDT and USDT.D (Tether Dominance). When USDT.D drops, capital flows out of stablecoins into Bitcoin, driving BTC’s price higher.
Conversely, a rise in USDT.D signals increased caution, often leading to BTC price declines. This correlation helps traders gauge market sentiment and identify potential trend shifts.
