Watching whether it can rise above 98821.58
Hello, traders.
If you "Follow", you can always get new information quickly.
Please click "Boost" as well.
Have a nice day today.
-------------------------------------
It's the same idea as the previous one.
The key is whether it can maintain the M-Signal and MS-Signal indicators on the 1D chart until around December 27.
In order for the uptrend to start, it is expected to start by rising above 97821.58 and showing support.
If it fails to rise above 97821.58, it will eventually fall below the M-Signal indicator on the 1D chart.
Therefore, the 95904.28-98892.0 section is an important support and resistance section.
-------------------------------------------
USDT, USDC are still showing an upward trend.
(BTC.D 1D chart)
The point of interest is whether it can fall below 55.01 by falling near the MS-Signal indicator.
(USDT.D 1D chart)
The point of interest is whether it can meet resistance near the 3.92-4.31 range and maintain a downward trend.
-
I think the gap increase of USDT, USDC is a trace of funds flowing into the coin market.
On the other hand, I think the gap decrease is a trace of funds flowing out of the coin market.
If BTC dominance falls below 55.01 and is maintained or continues to decline, an altcoin bull market is expected to begin.
USDT dominance is expected to fall to around 2.84 and maintain an upward trend in the coin market.
Accordingly, if it touches around 2.84 and rises, the coin market is likely to face a sharp decline.
Also, if it rises above 4.97, I think the coin market is likely to turn into a bear market.
----------------------------------------
(BTCUSDT 1D chart)
The point to watch is whether it can receive support and rise around the important support and resistance area of 95904.28-98892.0.
The next period of volatility is expected to be around December 27, so we need to check whether it can continue sideways until then.
This movement can be seen as a task to reduce the gap of the M-Signal indicators on the 1D, 1W, and 1M charts or to reset the StochRSI indicator.
If it falls below the M-Signal and MS-Signal indicators on the 1D chart, it is expected to touch the M-Signal indicator on the 1W chart.
At this time, if the HA-Low and BW(0) indicators are generated, the key is whether there is support around that area.
-
When the StochRSI indicator falls below the 50 point range, if it shows resistance below the M-Signal indicator on the 1D chart, it is necessary to first check whether there is support around 87.8K-89K.
In order to continue the upward trend, it must rise above 97821.58 and show support.
Therefore, if it fails to rise above 97821.58, it will eventually fall below the M-Signal indicator on the 1D chart.
-
Have a good time.
Thank you.
--------------------------------------------------
- Big picture
I used TradingView's INDEX chart to check the entire range of BTC.
(BTCUSD 12M chart)
Looking at the big picture, it seems to have been maintaining an upward trend following a pattern since 2015.
In other words, it is a pattern that maintains a 3-year upward trend and faces a 1-year downward trend.
Accordingly, the upward trend is expected to continue until 2025.
-
(LOG chart)
Looking at the LOG chart, we can see that the upward trend is decreasing.
Accordingly, the 46K-48K range is expected to be a very important support and resistance range from a long-term perspective.
Therefore, it is expected that prices below 44K-48K will not be seen in the future.
-
The Fibonacci ratio on the left is the Fibonacci ratio of the uptrend that started in 2015.
In other words, it is the Fibonacci ratio of the first wave of the uptrend.
The Fibonacci ratio on the right is the Fibonacci ratio of the uptrend that started in 2019.
Therefore, it is expected that this Fibonacci ratio will be used until 2026.
-
No matter what anyone says, the chart has already been created and is already moving.
It is up to you how to view and respond to this.
If the ATH is renewed, there are no support and resistance points, so the Fibonacci ratio can be appropriately utilized.
However, although the Fibonacci ratio is useful for chart analysis, it is ambiguous to use it as support and resistance.
The reason is that the user must directly select the important selection points required to generate Fibonacci.
Therefore, since it is expressed differently depending on how the user specifies the selection points, it can be useful for chart analysis, but it can be seen as ambiguous to use it for trading strategies.
1st: 44234.54
2nd: 61383.23
3rd: 89126.41
101875.70-106275.10 (when overshooting)
4th: 134018.28
151166.97-157451.83 (when overshooting)
5th: 178910.15
-----------------
Usdtdominance

USDT UPDATE (4H)First of all you should know that "USDT Dominance" is always moving inverse of BTCUSDT .
It seems that Tether Dominance has entered a large C wave.
There are numerous requests to determine the market direction in this situation.
Based on our analyses, it seems that Tether dominance will move as follows.
For risk management, please don't forget stop loss and capital management
Comment if you have any questions
Thank You

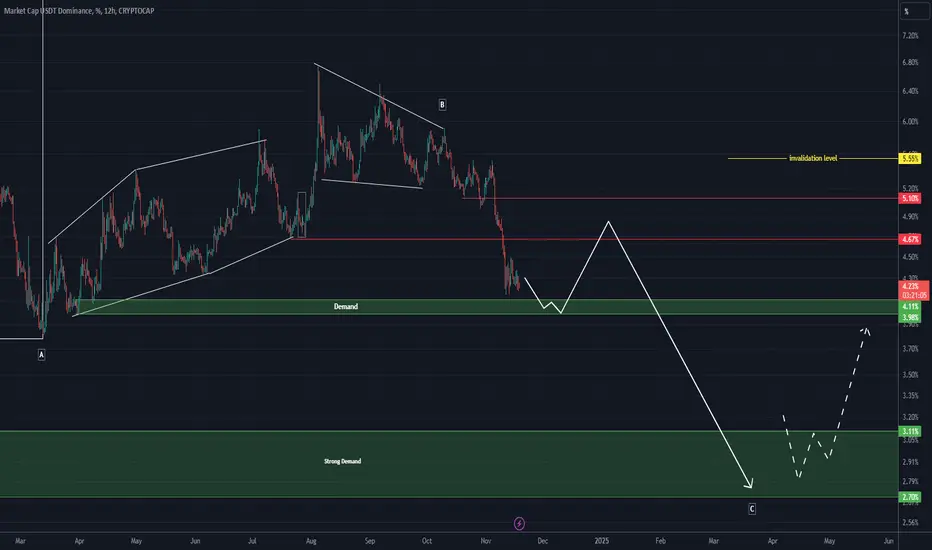
USDT Dominance Breakdown Ahead?USDT Dominance (USDT.D) has formed a bearish inverted cup and handle pattern, pointing to a big move soon!
The weekly chart of USDT dominance shows a clear bearish inverted cup and handle pattern, with a significant breakdown below the neckline. The projected target suggests a potential 60% decline, which could take the dominance to the 1.6-2% range.
This might indicate a shift in market dynamics, with capital rotating from stablecoins into altcoins or Bitcoin. A key moment to watch for crypto traders.
What’s your take on this? Could this spark an altcoin rally?

Possibility of sideways until the next volatility period
(Title) The key is whether sideways can occur until the next volatility period
------------------------------
Hello, traders.
If you "Follow", you can always get new information quickly.
Please also click "Boost".
Have a nice day today.
-------------------------------------
(USDT 1D chart)
(USDC 1D chart)
(BTC.D 1D chart)
(USDT.D 1D chart)
The point to watch for USDT and USDC is whether they can maintain their upward trend.
BTC dominance failed to fall below 55.01 and is showing signs of touching the MS-Signal indicator.
The key is whether it can meet resistance near the MS-Signal indicator and fall.
The key is whether USDT dominance can meet resistance near the 3.92-4.31 range and fall.
I think that for the altcoin bull market to start, BTC dominance needs to fall below 55.01 and remain there or continue to fall.
For the coin market itself to maintain an upward trend, I think that USDT dominance needs to remain below 4.97 or continue to fall.
Therefore, we need to check whether the content I mentioned above is maintained or whether it satisfies the content for BTC.
----------------------------------------
(BTCUSDT 1D chart)
As I mentioned yesterday, there has been a movement in BTC dominance and USDT dominance.
However, I think that for the trend to change, it depends on how BTC moves around 95904.28-98892.0.
That is, if the price is maintained around 95904.28-98892.0 until around December 27, I think it is highly likely that the StochRSI indicator will be reset and the upward trend will continue.
Otherwise, if it falls below the M-Signal indicator on the 1D chart, that is, below the MS-Signal indicator, and shows resistance, it is likely to touch the M-Signal indicator on the 1W chart.
This movement can be seen as a pull back due to profit taking to relieve fatigue from the upward trend that has continued so far.
I think this can be seen as profit taking for the upward trend that started in 2023.
-
Due to this decline, the BW(100) indicator is showing signs of being created at the 101109.59 point and the HA-High indicator at the 97821.58 point.
Accordingly, we can see that the high point section has risen.
Therefore, if the HA-High indicator is generated at the 97821.58 point, the key is whether it can be supported and rise around this area.
In any case, what we need to look at importantly is whether it can be supported and rise around the M-Signal and MS-Signal indicators on the 1D chart.
The key is whether it can be maintained until the next volatility period, around December 27th.
To do so, I think funds should flow out of altcoins and the price of BTC should be defended.
I think it is currently showing that pattern, but I will have to wait and see a little longer.
-
Have a good time.
Thank you.
--------------------------------------------------
- Big picture
I used TradingView's INDEX chart to check the entire section of BTC.
(BTCUSD 12M chart)
Looking at the big picture, it seems to have been following a pattern since 2015.
In other words, it is a pattern that maintains a 3-year bull market and faces a 1-year bear market.
Accordingly, the bull market is expected to continue until 2025.
-
(LOG chart)
Looking at the LOG chart, we can see that the increase is decreasing.
Accordingly, the 46K-48K range is expected to be a very important support and resistance range from a long-term perspective.
Therefore, we do not expect to see prices below 44K-48K in the future.
-
The Fibonacci ratio on the left is the Fibonacci ratio of the uptrend that started in 2015.
That is, the Fibonacci ratio of the first wave of the uptrend.
The Fibonacci ratio on the right is the Fibonacci ratio of the uptrend that started in 2019.
Therefore, this Fibonacci ratio is expected to be used until 2026.
-
No matter what anyone says, the chart has already been created and is already moving.
It is up to you how to view and respond to it.
Since there is no support or resistance point when the ATH is updated, the Fibonacci ratio can be appropriately utilized.
However, although the Fibonacci ratio is useful for chart analysis, it is ambiguous to use it as a support and resistance role.
The reason is that the user must directly select the important selection points required to create the Fibonacci.
Therefore, it can be useful for chart analysis because it is expressed differently depending on how the user specifies the selection point, but it can be seen as ambiguous for use in trading strategies.
1st: 44234.54
2nd: 61383.23
3rd: 89126.41
101875.70-106275.10 (when overshooting)
4th: 134018.28
151166.97-157451.83 (when overshooting)
5th: 178910.15
-----------------

USDT.D retest 5.5%?USDT.D been falling for 90days with no real retests, this might be it.
Also fully completed previous projection of a Dump.
Fibb Golden zone around 5.5%
Also BTC looks like it's in Diamond Top pattern. If that plays out we might see CRYPTOCAP:BTC at $85k.
But this is Bullrun so probably some Elon musk post will randomly revive market out of nowhere and the dump will stop mid way.
Keep eyes on twitter.

USDT DOMINANCE is close to a strong support levelThis analysis is an update of the analysis you see in the "Related publications" section
First of all you should know that "USDT Dominance" is always moving inverse of BTCUSDT .
It seems that Tether Dominance has entered a large C wave.
If we reduce the time frame and want to analyze the movements of Tether (USDT) dominance more precisely, It seems that the asset is forming either a diametric or a triangle pattern.
In this scenario, we are focusing on the diametric pattern. From the green zone, the price could create an upward correction.
For risk management, please don't forget stop loss and capital management
Comment if you have any questions
Thank You

USDT Dominance Weekly UpdateUSDT dominance continues to trend downward within a clearly defined descending channel. Recent price action shows a rejection from the upper boundary near the 100-MA, reinforcing the potential for further downside.
Current Market Dynamics
Descending Channel:
USDT's dominance remains in a declining channel, characterized by consistent lower highs and lower lows. This signals a weakening trend as market participants shift toward riskier assets.
100-Moving Average (Purple Line):
A breakout attempt above the 100-MA was met with rejection, underscoring strong resistance at this level.
Bearish Momentum:
A sharp downward projection (illustrated by the brown arrow) indicates the potential for further decline in dominance over the coming sessions.
Key Levels to Watch
Support Levels:
Immediate Support: 3.65%–3.70% (lower channel boundary).
Critical Support: 3.50% (long-term key level).
Resistance Levels:
First Resistance: 4.00%–4.05% (200-MA).
Key Resistance: 4.20% (upper channel boundary).
Outlook
Bearish Scenario:
A break below the 3.65% support could trigger a deeper drop toward the 3.50% level.
Bullish Scenario:
A breakout above 4.05% and the 100-MA would invalidate the bearish outlook, potentially leading to a retest of the 4.20% resistance zone.
Conclusion
The technical setup highlights strong bearish momentum in USDT dominance. However, key levels will determine the next direction. Traders should remain vigilant for a decisive breakout or breakdown in the coming sessions.
Disclaimer: This analysis is for informational purposes only and does not constitute financial advice. Always conduct your research and consult a financial advisor before making investment decisions.
For updates on other coins or personalized insights, feel free to reach out via DM.
@Peter_CSAdmin

USDT.D UpdateAs I told you in my previous analysis, it seemed CryptoMarket was ready for a correction and here we are
The overview on this index has not changed much and it seems we can get a recovery on this index to the highlighted target areas
Qude suggest you not to be greedy in your trades this week and wait for deeper corrections and pullbacks in different coins in the market

Usdt.d tether dominance Please give me your idea:))
White or red?:))
This dominance can make sense and show us a little more about total Market
But this chart shows me a real good 2 deeps on good support area:)
We can see the Btc starting to correction if this scenario of dominance happen:)
But the red scenario shows the bullish Btc and raising green market:)
Please give me your idea by comment:)
Thx

USDT dominance is in a downtrend and it is expected to continuThe CRYPTOCAP:USDT.D dominance chart is currently in a downtrend and, based on technical analysis, is expected to continue declining until it reaches approximately 2.25%. At that point, a rebound is anticipated, potentially leading to a renewed upward trend.
Market sentiment has been buoyed by optimism surrounding the Trump election, with investors displaying a willingness to take on more risk in hopes of an improving economic environment. However, this positive outlook is unlikely to persist indefinitely. By Q1 2025, fears and uncertainties are expected to resurface, driven by factors such as ongoing geopolitical conflicts, persistent inflation, a housing crisis, and other adverse economic developments.
While the Trump administration's tariff strategies may provide short-term headlines, they are unlikely to deliver significant improvements to the U.S. position on the global stage. Meanwhile, the BRICS nations, along with China, India, and other East Asian economies, are expected to maintain stronger growth trajectories and better overall prospects.
As the election-driven optimism settles, the markets are likely to shift focus, triggering a period of de-risking. Crypto assets, in particular, may experience increased selling pressure during this phase.
Looking ahead, I expect USDT dominance to begin rising in February or March 2025, potentially peaking around May or June as market conditions shift back toward risk aversion.

USDT Dominance Raises Caution: Time to Stay Patient in Crypto?USDT dominance is looking quite concerning right now!
It might be wiser to stay patient and wait for clearer signals before moving.
#Crypto

USDT dominance chart grows stronger#usdt #tether dominance has bounced after bullish divergence and a W bounce emerged in LTF. #usdtd is now looking stronger. Upside movements will damage #altcoins and #btc #eth . Losing the double bottom zone at %3.90 is the invalidation. Not financial advice.

Total Market Cap 2 and Total 3 + USDT.D Market WarningsIn this video, I briefly review the USDT.T bear market signals I covered in a recent video below.
But also noticing that Total 2, Total 3 and also the OTHERS are either hitting or very close to hitting their all time highs from the prior market cycle in 2021, which was the start of the Bear.
I do think we see more profit taking Monday afternoon into Tuesday through Thursday which is projected Dec 5th market cycle low from a cycles perspective.
Notice how the alts have been flying the last few days, and this weekend -- setting us up for major profit taking tomorrow and to fool all the new crypt tourists into buying the highs.
Protection capital here IMO and wait to buy back lower.
Let me know your thoughts, and please like the video if you found value.
- Brett
PS> My other Bear Market indicator fired today when I went out for Italian at my favorite local restuarant (sneaking in right at closing time as usual b/c I work 14 hour days)... and the bus-boy saw my Bitcoin hat -- and starting giving me crypto tips!
This is like the 'Taxi Cab' indicator of 1999, when the cabbie started giving me stock recommendations ... I had a feeling the top was in!

Will the Support Zone of USDT.D Cause a Cryto Correction ?We are close to the bottom of the bullish channel and on a static level that has supported Tether's dominance. If we see Tether's dominance rise again from this zone, it is likely that the cryptocurrency market will undergo a correction.

Analyzing Liquidity Dominance: Key Data Insights
The chart provided offers a comprehensive view of Liquidity Dominance within the cryptocurrency market, showcasing pivotal relationships between market activity, trading volume, and liquidity flow. This analysis dissects the chart and explores key patterns, trends, and their implications for traders and investors.
Understanding Liquidity Dominance
Liquidity dominance represents the proportion of trading volume, capital flow, or liquidity concentrated in specific assets or market sectors. It serves as a barometer for understanding market behavior, as it highlights where capital is being deployed or withdrawn. On my chart, liquidity dominance provides a lens into the dynamics between:
Stablecoins (e.g., USDT): Representing safety and risk aversion.
Altcoins: Capturing speculative capital.
Bitcoin Dominance (BTC.D): Indicating market confidence in Bitcoin versus other assets.
Key Observations from the Chart
1. Stablecoin Liquidity Dominance (USDT.D)
Current Trend:
A noticeable decline in USDT.D suggests that capital is moving out of stablecoins, signaling increased risk appetite among traders. This typically aligns with bullish sentiment in the broader market, as investors allocate funds to Bitcoin or altcoins.
Market Implications:
If USDT.D continues its downward trajectory, we could expect a rally in cryptocurrencies, particularly in altcoins, as traders seek higher returns.
A sudden reversal in USDT.D (spiking higher) could signal market uncertainty or panic, as investors flee to stable assets.
2. Bitcoin Liquidity Dominance (BTC.D)
Current Trend:
The relatively stable BTC.D indicates that Bitcoin retains its share of liquidity without significant outflows to altcoins. This suggests that while altcoins may rally, Bitcoin remains a primary safe haven for large capital.
Market Implications:
A breakout to the upside in BTC.D could signal a Bitcoin-led market cycle, often observed during early bull markets.
A breakdown in BTC.D could indicate the onset of an "altseason," where altcoins outperform Bitcoin.
3. Altcoin Liquidity (TOTAL2 - Altcoin Market Cap)
Current Trend:
The chart indicates increasing TOTAL2 dominance, showing growing interest in altcoins. This suggests speculative capital is rotating from Bitcoin or stablecoins into altcoins, likely driven by expectations of higher returns.
Market Implications:
A continuation of this trend supports the idea of an emerging altcoin season, especially if TOTAL2 outpaces BTC.D consistently.
If TOTAL2 stagnates or declines, it may signal profit-taking or reduced confidence in altcoin performance.
Key Data Insights
1. Divergences Between USDT.D and BTC.D
A strong divergence between USDT.D and BTC.D often highlights market turning points:
Bullish Divergence:
If USDT.D declines while BTC.D rises, it suggests strong confidence in Bitcoin leading the market, often a precursor to a bull run.
Bearish Divergence:
If USDT.D increases while BTC.D falls, it indicates risk aversion and capital flight to safety, hinting at potential market downturns.
2. Correlation Between TOTAL2 and USDT.D
The inverse correlation between TOTAL2 and USDT.D is a critical marker:
As TOTAL2 rises and USDT.D declines, it signals risk-on behavior with a focus on altcoins.
If TOTAL2 falls alongside a rise in USDT.D, it could indicate market-wide selling pressure.
3. Price Action Confirmation
The interaction of liquidity dominance with price action across key support and resistance zones provides confirmation of market sentiment. Key observations include:
Strong resistance in BTC.D coinciding with declines in TOTAL2 could signal a Bitcoin-led consolidation phase.
Support in TOTAL2 while BTC.D declines suggests capital rotation into altcoins, supporting a rally.
Predictions Based on Current Trends
Short-Term Outlook:
With USDT.D trending downward, the market appears to be in a risk-on phase.
If BTC.D remains stable while TOTAL2 gains dominance, altcoins are likely to experience significant upside.
Medium-Term Outlook:
A breakout in TOTAL2 above key levels would confirm altseason momentum, particularly if USDT.D continues to decline.
However, if USDT.D rebounds sharply, expect market-wide corrections, with Bitcoin potentially absorbing most of the liquidity.
Long-Term Outlook:
Sustained declines in BTC.D combined with TOTAL2 growth could indicate prolonged altcoin outperformance.
Conversely, a reversal in BTC.D dominance with stable USDT.D suggests a return to Bitcoin-led cycles.
Strategies for Traders
1. Monitor Liquidity Flows
Use the interaction between USDT.D, BTC.D, and TOTAL2 as a guide for market sentiment.
Look for divergences between these metrics and price action to spot potential reversals.
2. Align with Dominance Trends
If BTC.D is rising, focus on Bitcoin as the primary trade.
If TOTAL2 gains dominance and USDT.D declines, shift focus to altcoins for higher returns.
3. Risk Management
During periods of rising USDT.D, reduce exposure to altcoins and focus on stablecoins or Bitcoin.
Use liquidity dominance trends to time entries and exits at major support and resistance levels.
Conclusion
My Liquidity Dominance chart provides a powerful framework for understanding capital flow dynamics across cryptocurrencies. The current trends suggest a risk-on environment favoring altcoins, but the stability of BTC.D implies Bitcoin remains a key player. Monitoring these metrics closely will help you navigate market cycles effectively, identifying both opportunities and risks as they arise.

USDT DOMINANCE UPDATE (1D)🔷 First of all you should know that "USDT Dominance" is always moving inverse of BTCUSDT .
It seems that Tether Dominance has entered a large C wave.
The Tether dominance is near a support level, which could lead to a correction in its downtrend.
Such a move can be anticipated for Tether dominance.
Let’s wait and see what happens.
For risk management, please don't forget stop loss and capital management
Comment if you have any questions
Thank You
USDT.D Flashing BEARISH Signal For Bitcoin and Total Market CapIn this video, I've re-created a study I saw online about USDT.D (USDT Tether Dominance) and how whenever it's dropped to this trendline since 2018/2019.
It's also marked the top of the market in terms of Bitcoin and Total Market Cap.
It obviously makes sense that with money flowing into crypto and Bitcoin, that money would flow out of Tether and stablecoins... But still, this is a very interesting inverse relationship.
This is either one of those charts we'll look back at in hindsight, and think 'Well that was obvious' -- Or we'll see a break of this trendline, because...
Maybe this cycle IS different.
I'll be watching this to see if USDT.D starts rising, and BTC.D starts dropping.
This could spark a mini-alt season in the mean time, which would be great.
But I would be taking profits into resistance levels, if this USDT.D chart looks to be turning up.
What are your thoughts?
Please Like, Leave a Comment, and feel free to Share!
- Brett

USDT Dominance: an indicator to forecast Bitcoin’s directionUSD Tether, or USDT, came into existence as a digital version of the U.S. dollar, and it succeeded. USDT is pegged to the U.S. dollar and is the top and most used stable coin in the crypto market. USDT is also being used for transferring money or other means of payment, although mostly in the crypto market. Many others tried to capture a piece of this huge market: USDC, BUSD, DAI, TUSD, and UST. We all know what happened to the last one, UST (Terra USD) depegged from the U.S. dollar and crashed.
Anyway, since USDT is the most used stable coin in the crypto market, its dominance can reveal important info about the crypto market, and mostly about the Bitcoin.
So, let's start with the plain USDT Dominance chart; it shows the percentage of the total crypto markets in the form of USD Tether. As can be seen, the USDT Dominance chart shows two ascending channels. The first is steeper than the second, and the reason for that is Tether's totalitarian nature, as back then there were no other worthy competitors, and most notably its quick acceptance by the crypto community—the traders.
Now, the second ascending channel is closer to the norm and, as such, can be used as a revealing indicator. It's easy, 1) when USDT Dominance goes down, that means most people are buying Tether, so there is a shortage of Tether in the market. 2) When USDT Dominance goes up, that means most people are selling Tether, so there is a surplus of Tether in the market. So what do these mean?
When people are buying more Tether than before, USDT Dominance decreases, and that means they are converting their fiat money, such as U.S. dollars, Euro, British Pound, Franc, etc., to Tether in order to buy crypto assets such as Bitcoin. Now, here is the important part: If more people are converting their fiat money into Tether to buy crypto coins, the demand for crypto assets will go up, and when demand goes up, so does the price.
When people are selling their crypto assets more than before, they are converting their crypto assets, such as Bitcoin, into Tether, so there is a surplus of Tether in the market, and as a result, the USDT Dominance increases. This happens when traders/people want to save profits or think the market could go into a downtrend/correction, so they sell their crypto assets and prefer to hold a stable coin like Tether.
Here, the USDT Dominance chart is compared with the Bitcoin price chart. As can be seen, when USDT Dominance went down, the Bitcoin price went up, and vice versa. So, when the Bitcoin price was decreasing, more people were selling Bitcoin and converting their crypto assets into Tether; thus, more Tether became available in the market, and as a result, the USDT Dominance went up.
The USDT Dominance chart can be used as a simple indicator to forecast Bitcoin's possible future movements.

USDT Dominance Analysis. USDT dominance consolidates below the 50 SMA (red line) and the descending resistance trendline. This structure highlights the continued bearish outlook while emphasizing key technical levels.
The 50-period Simple Moving Average is rejecting the price, further validating the downtrend.
This rejection aligns with the descending resistance trendline.
The horizontal support area near 4.19% remains crucial. A breakdown below this level will likely lead to a sharp decline, indicating a shift in market liquidity.
Dominance continues to form lower highs, indicating bearish momentum and less buying pressure.
The green arrow indicates a potential move to the downside. It could confirm further bearish pressure if dominance fails to sustain above the trendline and breaks below 4.19%.
A breakdown below 4.19% would trigger bearish momentum, potentially reflecting growing confidence in risk assets like BTC and altcoins. However, any break above the 50 SMA and the descending trendline would invalidate the bearish bias and could signal a reversal. Keep a close eye on these levels for the next move.
Disclaimer: This analysis is for informational purposes and is not financial advice. Always stay updated with market movements and adjust your trading strategies as needed.
You can DM us for information on any other coin.
@Peter_CSAdmin

Altcoin Alert: Dominance Rising or Relief Ahead?#Dominance trending inside a rising channel!
A breakdown of below the channel support could signal relief for altcoins. However, if support holds, we may see further pressure on altcoins as dominance rises.
Keep an eye on the breakdown👀

The Impact of Emerging Markets on the Dollar amidst Looming TradThe recent shift in US political landscape has ignited a wave of uncertainty across global markets. A potential escalation of trade tensions with China and other key economies could have far-reaching consequences, particularly for the US dollar and emerging market currencies.
The Dollar's Uncertain Future
The US dollar, long considered a safe-haven asset, faces a crossroads. While a more protectionist stance could initially bolster the dollar's appeal, it could also trigger a chain reaction of economic consequences. Increased tariffs and trade barriers could lead to higher inflation, which could erode the dollar's purchasing power. Moreover, if the US economy weakens as a result of trade disputes, the dollar's demand as a safe-haven currency could diminish.
Emerging Markets in the Crossfire
Emerging market economies, which have often relied on exports to fuel their growth, are particularly vulnerable to escalating trade tensions. A trade war could disrupt global supply chains, increase the cost of imported goods, and reduce demand for emerging market exports. This could lead to currency devaluation, higher inflation, and slower economic growth.
Currency Pegs Under Pressure
Countries that peg their currencies to the US dollar, such as Hong Kong and some Middle Eastern nations, could face significant challenges. If the dollar weakens or strengthens significantly, it could put pressure on these currency pegs, forcing central banks to intervene to maintain the exchange rate. This could deplete foreign exchange reserves and limit monetary policy flexibility.
The Renminbi's Rising Influence
China's renminbi could emerge as a potential beneficiary of a weakened US dollar. As China continues to expand its economic influence and promote the internationalization of its currency, it could become a more attractive alternative to the dollar for global trade and investment. However, a trade war with the US could also negatively impact the renminbi, as it could lead to reduced demand for Chinese exports and capital flight.
Navigating the Uncharted Waters
To mitigate the risks associated with a potential trade war, emerging market economies may need to adopt a combination of strategies. These could include diversifying export markets, promoting domestic consumption, and strengthening financial institutions. Additionally, central banks may need to adjust monetary policy to stabilize currencies and manage inflation.
In conclusion, the potential for increased trade tensions between the US and China could have significant implications for the global economy, the US dollar, and emerging market currencies. While the full impact of these developments remains uncertain, it is clear that businesses, investors, and policymakers around the world will need to closely monitor the situation and adapt their strategies accordingly.

$USDT.D Has Fallen Off A CliffTrump's LANDSLIDE victory and Republican's controlling Congress has signaled full RISK-ON across the board in markets.
This has caused everyone to sell their stables for CRYPTOCAP:BTC and Alts.
Expect another 10% worth of CRYPTOCAP:USDT to be dumped into the market before we see a real correction.
This will put CRYPTOCAP:USDT.D ~3.8% which was the local top in March.
The correction should be short-lived as we make our way back down to 2-2.5%

USDT dominance chart update details: “death cross” has formed, where a short-term moving average (possibly the 50-day, shown in red) has crossed below a long-term moving average (possibly the 200-day, in green). This pattern typically suggests a bearish signal, indicating the potential for further declines in USDT dominance.
The overall direction appears downward, with USDT dominance testing lower support areas within a descending channel.
Key support levels are marked in green and gray. The current price level is slightly above the major support area around 5.0%. The chart suggests a possible continuation downward, with the next significant support area near 4.0%.
The large downward arrow indicates a bearish outlook for USDT dominance, suggesting potential further declines toward the 4.0% range if current support levels fail to hold.
This chart indicates that if USDT dominance continues to decline, this could correlate with a potential uptrend in the broader crypto market, as money flows from stablecoins into other assets.
Disclaimer: This analysis is for informational purposes and is not financial advice. Always stay updated with market movements and adjust your trading strategies as needed.
You can DM us for information on any other coin.
@Peter_CSAdmin
