USD vs CRYPTO : macro look, usdt.d in the mix, alt comparisonUSD vs CRYPTO : macro look, usdt.d in the mix, alt comparison
wow lot here but some clear ish macro trends.
seems either 1 of 2 spots, once again. see the flags.
1. dxy aint done. usd pumps to astronomical levels while btc does a big fake pump into huge dump as dxy blows off.
2. dxy is done, loses this key support and rolls over giving risk on assets like btc a huge pump. in this case a % comparison for ADA (i think a good example of 'ave top alt performance') against btc is shown from that bottom. choose your alt wisely, hodl, and ye shall be rewarded.
looking like 2. to me tbh but iam obviously biased.
would love to also see what macro patterns you see here? seeing something different?
gl
Usdtdominance

Keep an eye on $APT/USDTAPT/USDT update:
Did you find this crypto market analysis helpful? Stay updated about the latest crypto market update.
Please continue to follow my analysis and feel free to ask any queries, you may have. I am here to assist you.
TradingView: @FarmanBangashh

Mid- to long-term trading strategy with Market Cap chartHello?
Traders, welcome.
If you "Follow", you can always get new information quickly.
Please also click "Boost".
Have a good day.
-------------------------------------
(USDT chart)
As USDT fell below the HA-High indicator on the 1D chart, the likelihood of further declines is increasing.
Therefore, the key is whether the gap can rise above the HA-High indicator on the 1D chart.
However, since the HA-High indicator on the 1W chart is formed at point 82959B, if USDT is maintained around 82.467B-82959B, the coin market is expected to maintain an upward trend.
USDT is a stablecoin that has a huge impact on the coin market.
Therefore, we believe that funds transferred through USDT play an important role in the volatility of the coin market.
---------------------------------------------
(USDC chart)
Looking at the 1M chart, it is down more than -50%.
Where did so much money go?
USDC is considered an active stable coin by making coins in the coin market into investment products in the stock market.
Therefore, funds using USDC can be understood as funds required to invest in or maintain investment products in the stock market.
Therefore, it is believed that funds are being moved to invest more in the stock market than the current coin market.
Therefore, it is believed that important funds are flowing out of the coin market in starting or maintaining the upward trend of the coin market.
As a result, I believe that the funds flowing into USDT are limiting or reducing the upward trend of the coin market.
No matter how it is, the coin market is expected to maintain an upward trend as long as the funds inflow through USDT are not withdrawn.
Therefore, you should focus on when to proceed with the purchase.
-------------------------------------------------- ---
(BTC.D chart)
BTC dominance is expected to rise around 56.78-61.73.
Accordingly, caution is required when trading altcoins.
An increase in BTC dominance means that funds are concentrated towards BTC.
Therefore, altcoins are more likely to move sideways or decline.
A drop below 50.49 is required to lead to an uptrend for the altcoin, and a drop to or below the 47.64-48.80 range will feel like an altcoin bull market.
In any case, BTC dominance will rise around 56.78-61.73, so it is better to trade the uptrend of these altcoins in the short term.
-------------------------------------------------- -------------
(USDT.D chart)
We entered the important section, the 6.85-7.27 section.
Accordingly, it is necessary to see if it can fall below 6.85 by the start of the volatility period around July 5th.
A drop in USDT dominance means an uptrend in the coin market.
This uptrend represents an overall uptrend in the coin market, so it is usually expected that BTC or ETH will show an uptrend.
The most important thing to look at on the USDT dominance chart is whether it falls below 6.21 or rises above 8.25.
If it does not break out of the 6.21-8.25 zone, the coin market is expected to continue sideways.
These sideways are what you'll see when you look at the big picture.
-------------------------------------------------- --------------------
Since the amount of money (USDT, USDC) supporting the coin market is moving in the opposite direction, in this situation, I think it is better to consider the trading period larger than mid- to long-term rather than short-term trading.
Looking at the coin market from a mid- to long-term perspective, it can be divided based on BTC 29K.
When BTC is below 29K, you should focus on buying BTC or ETH from a mid- to long-term perspective.
And, proceed with the 1st purchase of altcoins to be held in the mid- to long-term.
If it rises above BTC 29K, you should focus on finding time to split and sell BTC or ETH by buying below BTC 29K.
Therefore, you can split the sale when the rate of return per purchase unit price is 30% or more, or split the sale when the rate of return is 100%.
The timing of such split selling can be set according to your investment style, and you may not sell splits.
However, if it rises above 32K, the range of fluctuation is expected to be large, so it is recommended to proceed with split selling because no matter how profitable you are, if your psychological state becomes excited, you may proceed with a wrong transaction.
When an altcoin rises above BTC 32K, you should start looking for the timing of the second purchase of the altcoin you bought the first time.
If you have not made the first purchase, you need to find the time to buy the altcoin to buy in the 29K-32K section.
Since the second buying period of Altcoins is around BTC 43K, you can proceed slowly with split buying.
When BTC rises above 43K or shows support by touching the HA-High indicator on the 1M chart, we proceed to buy all the coins we have in earnest.
This full-fledged purchase refers to the purchase with the remaining funds minus the reserve surplus funds.
A reserve fund should be set aside between 10% and 20% of the total investment.
This is because the psychological pressure caused by price fluctuations after purchase can be relieved to some extent.
Coins (tokens) bought in this way can be sold when BTC rises to around 81K.
-------------------------------------------------- -----------------------
- big picture
A full-fledged uptrend is expected to start when it rises above 29K.
81K-95K is the range we expect to touch in the next bull market.
-------------------------------------------------- -------------------------------------------
** All descriptions are for reference only and do not guarantee profit or loss in investment.
** Even if you know other people's know-how, it takes a considerable period of time to make it your own.
** This is a chart created with my know-how.
---------------------------------

usdt dominanceCRYPTOCAP:USDT.D about usdt dominance i think we will see this pattern in futere. this is not a signal but just i shared my mind, whats your mind about it?

USDT Dominance analysis for today.Hello Everyone! I want share my idea about USDT Dominance.
When Bitcoin price stuck middle of consolidation USD Dominance is at support LVL. Here we need to be careful because we don't know what will be next move.
In my opinion This support is not strong enough for rise dominance from here. I think USDT.D will brake that support and if it will brake support we will see Bitcoin price another bullish scene.
BUT MY I WILL FIND ONLY POINT FOR ENTER SHORT POSITION BECAUSE TREND IS BEARISH!!!
Here is my 2 scene what we will see.
1 Bullish scene - price brake 7.42% level retest it and going again up with brake another resistances.
2 Bearish scene - Price brake support at 7.10% which in my opinion is weak, then coming back for retest it and going strong down.
Be Patient!!!
We will see soon what can Bitcoin!!!

#USDT DOMINANCE breakdown this bearish flag pattern!USDT DOMINANCE UPDATE
USDT dominance breaks down this bearish flag pattern in a 2hr timeframe.
we are expecting a good drop according to the pattern and if it's goes as expected then we see some good bounce on BTC and then ALTS.
stay tuned
This chart is likely to help you make better trade decisions if it does consider upvoting it.
I would also love to know your charts and views in the comment section.
Thank you

Alt Dominance with Stablecoins Dom RemovedHere's a look at CRYPTOCAP:OTHERS.D or Altcoin Dominance vs. itself, but without CRYPTOCAP:USDT.D and CRYPTOCAP:USDC.D
When removing the calculation of stablecoins dominance from the picture, the pattern looks less like a downtrend and more like a potential bottom that may soon reverse.
Most are not expecting this with the present rise of CRYPTOCAP:BTC.D , but this could occur should a metric ton of cash move out of stables and into Bitcoin and Alts.
Just a thought, please let me know what you think or how you might see things differently, and thank you for taking a moment to read through my own!
Note - the picture may look even more accurate if there was a way to track BUSD Dominance in relation to OTHERS.D
Just another,
-dudebruh

The Bull Market Hasn’t Started, yet.
In this chart, I compared the Bitcoin price to USDT Dominance.
There is an inverse correlation between the Bitcoin price and USDT.D. Meaning that as the Bitcoin price goes up, USDT.D goes down.
During the 2022 bear market, the bitcoin price was in a downtrend while USDT.D was rising in an Ascending Broadening Wedge.
An Ascending Broadening Wedge is a bearish reversal pattern. The breakdown target of this pattern is 4%, minimum.
The implications for the Bitcoin price are a bit speculative but, considering the inverse correlation, I expect Bitcoin to make it to 45K in 2023.
We are in the pre-bull phase. The best is yet to come.
Please read my analysis of the TOTAL 3 chart and of the BTC.D charts for more context.
NFA.
What do you think? Please share in the comments.
Best Wishes

Wandering Coin Market FundsHello?
Traders, welcome.
If you "Follow", you can always get new information quickly.
Please also click "Boost".
Have a good day.
-------------------------------------
(USDT chart)
A long lower tail was created and then gapped up.
I think the fact that the formation of candlesticks like this occurs is evidence that many transactions have been conducted.
Therefore, we believe that the possibility of a change in trend has increased as we have passed this period of volatility.
If the gap falls below 82.467B-82.959B, the coin market is expected to be in a sharp decline.
The coin market is expected to remain bullish as it is currently showing a gap increase.
-------------------------------------------
(USDC chart)
The decline of USDC is interpreted as a continued outflow of funds from US investment institutions.
Therefore, the coin market is expected to show a different flow from that of the stock market.
Since there are few trading pairs that are directly traded with USDC, I think the direct influence on the coin market is weak.
However, it is necessary to be cautious in trading as it increases the possibility of limiting the rise of the coin market or showing a temporary plunge.
In contrast, USDT is a stablecoin that has a direct impact on the coin market.
Therefore, if USDT continues to gap up, the coin market is expected to maintain its uptrend.
Currently, USDT has renewed its previous high (ATH), indicating that there is a lot of money flowing into the coin market.
Therefore, when a start signal occurs, I think it is highly likely to show a sharp uptrend.
--------------------------------------------------
(BTC.D chart)
The support and resistance points shown on the 1D chart and the support and resistance points shown on the 1W and 1M charts are slightly different.
The reason is that when viewed on the 1D chart, the support and resistance points on the 1M, 1W and 1D charts have been reset according to their importance.
The next period of volatility is around July 25th.
As mentioned before, BTC dominance is expected to rise to the 56.78-61.73 range.
If so, it is expected that the direction of departure from the 56.78-61.73 section will determine whether it will form a small bull market or a strange market where only BTC rises.
Accordingly, it is necessary to be cautious when trading altcoins.
If a strange market is formed where only BTC rises, it is time for the second buying of altcoins, so you should pay attention to the coins (tokens) that are expanding the coin ecosystem.
-------------------------------------------------- -
(USDT.D chart)
Since the flow of funds in the coin market is divided into USDT, USDC, and BTC.D charts, it may be difficult to understand the overall flow.
So, to sum up,
The coin market is overflowing with funds. (Rising trend of USDT)
However, the problem is that the forces leading the upward trend by burning this overflowing funds are leaking funds from the coin market. (USDC downtrend)
Therefore, it can be seen that significant funds contained in USDT are likely to be funds from individual investors.
Funds that account for the largest portion of USDT are expected to be Chinese funds.
Since I think that the current leadership of the coin market has shifted to US funds, I think the rise of USDC will soon lead to the rise of the coin market.
The volatility of USDT dominance plays a good role in confirming changes in the coin market.
The reason is that all coins (tokens) can be directly traded using USDT.
The volatility period for USDT dominance is around July 5th-August 2nd.
So, the question is whether it can break out of the 6.21-8.25 zone during the volatility period starting around July 5th.
Among them, volatility is expected to occur based on the 6.85-7.27 interval.
USDT dominance must fall for the coin market to show an upward trend.
-------------------------------------------------- -------------------------------------------
** All descriptions are for reference only and do not guarantee profit or loss in investment.
** Even if you know other people's know-how, it takes a considerable period of time to make it your own.
** This is a chart created with my know-how.
---------------------------------

Decreasing USDT inflow (to see if USDT.D falls below 7.14)Hello?
Traders, welcome.
If you "Follow", you can always get new information quickly.
Please also click "Boost".
Have a good day.
-------------------------------------
(USDT chart)
It shows an uptrend due to trading after a gap down.
An uptrend with a candlestick movement without gapping indicates that USDT is increasing due to selling.
I think the rise of the candlestick appears because the USDT that has increased in this way remains held.
As long as it does not fall below the 82.467B-82.959B range, the coin market is expected to maintain its uptrend.
-------------------------------------------------- -----------
(USDC chart)
USDC is showing a gap decline.
At the same time, it is falling below the HA-Low indicator on the 1D chart.
In order for USDC to turn into an uptrend, it must maintain a rise above at least the HA-Low indicator on the 1D chart and the MS-Signal indicator on the 1D chart.
The upward trend in the coin market due to the inflow of USDC is expected to begin only when it rises above 33.907B.
-------------------------------------------------- -------------------------
(BTC.D chart)
The HA-High indicator on the 1D chart appeared to be created, but disappeared as the volatility period passed.
We believe that the rise in BTC dominance is a fundamental phenomenon that will eventually lead to a major uptrend in the coin market.
Therefore, it can be said that when BTC dominance continues to rise, it is a buying time.
However, you have to think about which coin (token) to buy, but if possible, it is better to buy coins (tokens) that are expanding the coin ecosystem.
The fact that the coin ecosystem is expanding is because it is a coin (token) that many people are paying attention to, so it is highly likely to continue to rise.
-------------------------------------------------- -------------------
(USDT chart)
We touched the important branch points 78.25 and 7.14.
So, if it falls below 6.85-7.27 and stays there, the coin market is expected to be out of sideways.
If it rises above 8.25, the coin market is expected to plummet.
It is expected that the coin market will need to fall below 6.21 to break out of the critical support and resistance zone.
This move is expected to boost the BTC price by over 35K.
-------------------------------------------------- -------------------------------------------
** All descriptions are for reference only and do not guarantee profit or loss in investment.
** Even if you know other people's know-how, it takes a considerable period of time to make it your own.
** This is a chart created with my know-how.
---------------------------------

USDT.D SCENARIO Hello TradingView Family / Fellow Traders. This is Tony, also known as Cryptony
usdt.d targeting 7.0% and 6.55%
That means that usdt is entering the market

USDT.D DAILY : MARKET ROADMAPHi guys Hope you well.
UMM , As I said before this chart can show us the roadmap of crypto market . now I expect to go the demand box and then pullback , we have same area in bitcoin and total market cap chart .
use this chart for your trade.
SecondChanceCrypto
⏰25/JUNE/23
⛔️DYOR
Always do your research .
If you have any questions, you can write them in the comments below.and I will answer them.
And please don't forget to support this idea with your likes and comments.

BULL IS STARTINGIf trend is gonna be broken it should be like that. But dont forget that Bitcoin will max come to 44K something. Then again it should be bearish up to 20k. After 1 year we should have ATH. Check my Bitcoin analysis on my profile that I shared yesterday.

USDT.D, whats going on to altcoins?Hello friends, as we can see USDT Dominance is still bearish, but maybe a little retest is required to EQUILIBRIUM zone,
and then we'll see a very green market hopefully after testing the area I have selected on the chart....

USDTAccording to this wedge, it will be broken up and the target is drawn so we have to be ready to take short position for others.

USDT Dominance Downward from supply zones 👀 USDT.D Hello my friends, Consider USDT market cap to help identify crypto market movement, Everything is marked on the chart. Weakness in trend and supply zones ahead.
Good luck.
If its useful please like it as a support and follow me for next analysis :)
.
Salam doostan aziz, USDT.D ro baraye komak dar tashkhis jahat harkat market crypto dar nazar begirid. hame chiz rooye chart baraye shoma moshakhas shode. za'f dar ravand darim va 2 nahiye arze dar pishe ro.
moafagh bashid.
like va follow faramoosh nashe :)

Possibility of trying new challengeshello?
Traders, welcome.
If you "Follow", you can always get new information quickly.
Please also click "Boost".
Have a good day.
-------------------------------------
(USDT chart)
After June 3rd, it is showing a decline as it creates a gap for the second time.
If this decline continues, there is a possibility that the coin market will plunge.
(USDC chart)
The reason is that USDC's continued decline is believed to limit the current uptrend of the coin market.
Therefore, if even USDT shows a downward trend by creating a gap, it is expected that the rate of outflow of funds from the coin market will accelerate and the possibility of a sharp drop will increase.
However, USDT is currently in a state where it has renewed its previous high price (ATH), so it is not at risk yet.
If USDT falls below the previous high of 82.467B, i.e., below 81.839B-82.467B, a red flag is likely to be generated, so you should think about how to respond.
It is possible that these outflows were caused by the uptrend in the stock market.
If so, this phenomenon is likely temporary.
Since a lot of money is currently flowing into the investment market, I think that if an issue is created in any investment market, great volatility can occur.
The size and flow of funds in the investment market alone cannot determine the price fluctuations of individual stocks, coins, or tokens.
However, I think it will be a great reference for creating a trading strategy that can respond according to the importance of the current point or section by chart analysis of individual stocks, coins, and tokens.
-------------------------------------------------- ----
(BTC.D chart)
No matter what anyone says, BTC dominance is expected to remain on the rise.
The uptrend is expected to continue around 56.78-61.73.
Therefore, it is expected to confirm direction again around 56.78-61.73.
I think this phenomenon confirms that the current BTC price is located at the bottom.
Therefore, it is considered that the second wave of the rising wave is in progress for the BTC wave from a long-term perspective.
(USDT.D chart)
If USDT dominance is maintained in the 7.14-8.25 section, it is expected to continue its upward trend.
When that happens, it is expected to renew the declared price (ATH).
Therefore, for the next period of volatility, the move from around July 5 is expected to be significant.
If it falls below the 6.85-7.27 range, it is expected to escape the risk of a sharp decline in the coin market to some extent.
A full-fledged uptrend in the coin market is expected to begin with a decline around 4.97-5.53, so it is important to check for a drop below 6.21.
-------------------------------------------------- -------------------------------------------
** All descriptions are for reference only and do not guarantee profit or loss in investment.
** Even if you know other people's know-how, it takes a considerable period of time to make it your own.
** This is a chart created with my know-how.
---------------------------------

USDT.D(based on NEo wave)updatedso if 8.12 breaks we have that confirmation for G wave and I will buy more step by step.
so confirmation for the down trend is after G wave the down trend breaks. after that you can risk it free!

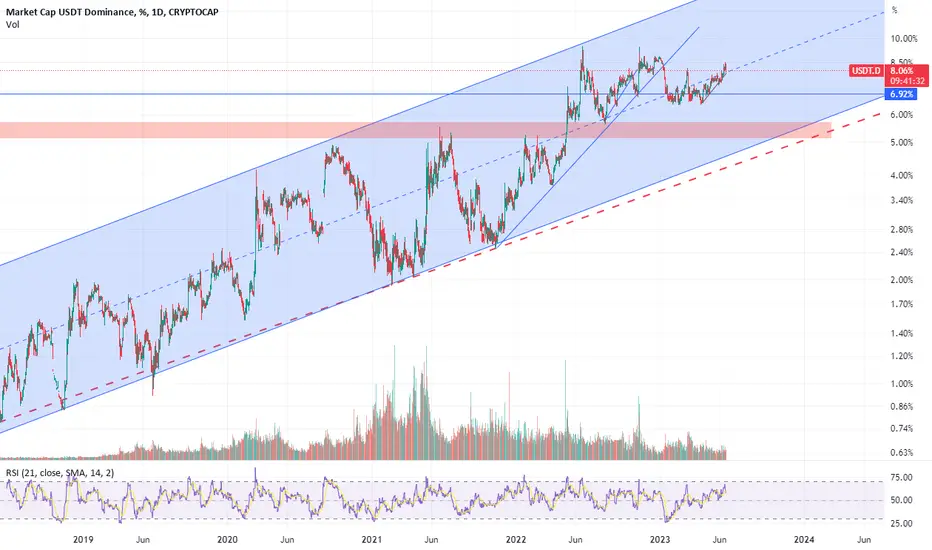
USDT DOMINANCEThis is CRYPTOCAP:USDT.D from 2019 as you can see we are in a big upgoing trend channel. USDT.D had broke midline and took a pullback. the futre of market will be specify this days.
USDT.D Analyst Hello everyone. Until I will share my idea about bitcoin I want talk little bit about USDT Dominance. What we saw yesterday its not looking retest support or new LH.
on USDT Dominance we have pretty bullish trend but yesterday we saw big rejection from Weekly resistance which was on 8.50%. after touch we got big impulsive bearish candles and stopped on support.
We don't have yet structure brake but I am waiting, we are at good LVL, if we brake that support and USDT Dominance come down and Bitcoin we will start strong uptrend.
I will link my last ideas about USDT.D where I had other opinion.

Usdt.d(based on NEo wave)updatesSo I think this diamond diametric is the last corrective wave and it will spend enough time for triangle pattern on weekly cash data. After this corrective wave crypto market should start a good wave to grow , so make yourself ready!

USDT/USD Hidden Bearish Divergence Deathcross SetupUSDT, the so-called stable coin, is now below the Bullish Control Zone on the RSI and is showing MACD Hidden Bearish Divergence on multiple Intraday Timeframes at this level after failing to take back the 55 and 89 EMAs. If this goes as any other chart normally would, I would expect it to go back down to the lows of the range, which in this case would take us down to around 94 cents, but I wouldn't be surprised if it went lower.

USDT Tether 82.45% of the reserves held in U.S. Treasury bonds !SIVB SVB Financial Group suffered the most severe bank run since Lehman Brothers for selling bonds at a $1.8Bil loss just to raise cash!
They had one of the worst possible yields as well: 1.79.
USDT Tether said on Dec 2nd, 2022, that its equity is expanding swiftly, with "82.45% of the reserves held in U.S. Treasury bonds and other cash equivalents."
What yield do you think Tether has?
I think we are about to witness USDT Tether`s collapse.
