USDT/USD Hidden Bearish Divergence Deathcross SetupUSDT, the so-called stable coin, is now below the Bullish Control Zone on the RSI and is showing MACD Hidden Bearish Divergence on multiple Intraday Timeframes at this level after failing to take back the 55 and 89 EMAs. If this goes as any other chart normally would, I would expect it to go back down to the lows of the range, which in this case would take us down to around 94 cents, but I wouldn't be surprised if it went lower.
Usdtdominance

USDT Tether 82.45% of the reserves held in U.S. Treasury bonds !SIVB SVB Financial Group suffered the most severe bank run since Lehman Brothers for selling bonds at a $1.8Bil loss just to raise cash!
They had one of the worst possible yields as well: 1.79.
USDT Tether said on Dec 2nd, 2022, that its equity is expanding swiftly, with "82.45% of the reserves held in U.S. Treasury bonds and other cash equivalents."
What yield do you think Tether has?
I think we are about to witness USDT Tether`s collapse.

Detect new changes in USDTHello?
Traders, welcome.
If you "Follow", you can always get new information quickly.
Please also click "Boost".
Have a good day.
-------------------------------------
(USDT chart)
Looking at the 1D chart, the High indicator on the 1D chart was created with an increase, increasing the possibility of forming a new trend.
Accordingly, the key is whether USDT is maintained above the HA-High indicator on the 1D chart.
If this is not the case and falls below the HA-High indicator on the 1D chart and shows resistance, USDT is expected to fall to around 81.839B-82.467B.
(1D chart)
The Stochastic and RSI indicators, which are included in the 'Strength' sub-indicator, are showing signs of a decline (Stoch > RSI).
Therefore, it can be seen that the possibility of USDT declining is increasing.
Looking at the previous data, it can be seen that USDT recorded a sharp drop once it exited the overbought zone and fell.
-------------------------------------------------- -
(USDC chart)
(1D chart)
The section 26.129B-27.456B is an important branching section.
Therefore, the key is whether you can touch the area around this section and make an upward transition.
If not, I think there is a high possibility of giving a serious blow to the investment products in the coin market.
However, since it is believed that the funds that move the coin market are being made through USDT, the coin market is expected to defend the price if there is no outflow of funds through USDT.
Since the outflow of funds through USDC is highly likely to accelerate the decoupling of the coin market and the stock market, caution is needed when using stock market indicators.
-------------------------------------------------- --------
(BTC.D chart)
Looking at the 1M chart, a new uptrend line has been created.
Therefore, it is necessary to check whether it can be maintained below the newly created uptrend line.
If not, I expect it to continue moving towards the 56.78-61.73 area.
The rise in BTC dominance will cause a phenomenon in which funds are concentrated towards BTC as BTC is leading the coin market.
As a result, BTC price fluctuations will have a great impact on the coin market.
However, if BTC dominance rises, we cannot tell if the BTC price will rise or fall.
It just tells you whether the flow of money is going towards BTC or towards altcoins.
-------------------------------------------------- ---------------------
(USDT.D chart)
The overall trend of the coin market can be seen by the movement of USDT dominance.
When USDT dominance rises, the coin market is likely to show a downward trend.
Conversely, when USDT dominance declines, the coin market is likely to show an upward trend.
Therefore, I do not think it is correct to try to confirm the trend of the coin market, that is, BTC or other coins (tokens), with USDT dominance.
USDT dominance is also related to the flow of funds.
Therefore, it is better to recognize it as a flow of funds in the coin market.
If USDT dominance breaks out of the 6.21-8.25 zone, it is expected to break out of the sideways that BTC is currently showing.
So, if USDT rises above 8.25, there is a high chance that BTC will plunge.
Therefore, it is necessary to check whether the USDT dominance can be maintained by falling to or below the 6.85-7.27 range.
-------------------------------------------------- -------------------------------------------
** All descriptions are for reference only and do not guarantee profit or loss in investment.
** Even if you know other people's know-how, it takes a considerable period of time to make it your own.
** This is a chart created with my know-how.
---------------------------------

BTC mining in South America for Tether adds to the longAre you ready to take your mining game to the next level? Look no further than Tether's latest venture in Uruguay. With its stablecoin technology and top-notch infrastructure, Tether is poised to revolutionize the mining industry. Join us as we explore this exciting opportunity and discover how you can reap the rewards of this cutting-edge technology.
Also , Tether's recent $1B USDT mint on Ethereum is for chain swaps! This clarification comes straight from the Tether CTO, so you can rest easy knowing this is a positive development for the crypto community. For more information, check out the official statement from Tether. Happy trading!

usdt dominance and the possible down tripusdt dominance is preparing for a short ride down to almost 4.0% which is a key factor for the possible incoming bull run for the bitcoin and the Alt season
good luck every one :)

Usdt.d(based on NEo wave)There is 2 possibilities for theter dominance.
In both we are in a big triangle and this is the end wave.
This is a first way of it
It is on aa first branch of wave E and this branch is diamond diametric. This correction can continue for the up trendline of triangle. By crossing the down trend of triangle we have a confirmation for a party on crypto market.

Market Cap USDT Dominance Looking at a long term view of the Market Cap USDT Dominance. Looking bullish on the weekly with a 15.17% target. as we are in a bull flag.

Analysing BTC, BTC.D and USDT.DIf you check my previous ideas (can't remember if here or on a social I can't mention here because "rules" but you can figure it out) there was a small support which has been cleaned multiple times by BTC, so now next target is the 24-24.8K area. BTC is forming a bullish DIV but I think it's still too weak
Both CRYPTOCAP:BTC.D (check this chart: )and CRYPTOCAP:USDT.D (check this chart: ) are going up showing that people are selling altcoins and moving money into Bitcoin and stablecoins. I don't show it here but even USDC.D is going up although it has a smaller share of the market.
Meaning: despite what the crypto twitter influencers told you altseason is FAR, new lows has to be expected and I feel that my bearishness is now justified.
However, by experience I can tell you that you'll recognize the bottom when it'll be too late so the only reasonable thing you can do is to follow this list:
1) identify the crypto you think have a good potential ROI;
2) start DCA;
3) don't throw insane amount of money in every buy, just be consistent, don't bet
4) JOLLY: buy more only if you've decent TA capability and recognize market reaches a point that it's likely to be the bottom
Good luck

USDT.D will rise (1D)First of all you should know that "USDT Dominance" is always moving inverse of BTCUSDT .
Taking more time, we came across signs that USDT's dominance is about to rise.
We have two TPs that we have marked on the picture.
Increasing Tether dominance will mean the fall of Bitcoin and altcoins.


Keep an eye on $HIVE/USDTKeep an eye on $HIVE/USDT
Formed Bullish Bat and Target Mentioned
Did you find this crypto market analysis helpful? Stay updated about the latest crypto market update.
Please continue to follow my analysis and feel free to ask any queries, you may have. I am here to assist you.
TradingView: @FarmanBangashh

Tether Dominance Aanalysis (6H)Many liquidity pools are flowed by whales and the trajectory is difficult to predict. Examining the zones, I think we can move on the picture like this and once Tether Dominance reaches level 8 and breaks down, altcoins will have a good run.

Winning or losing a trade depends on your state of mind (2)Hello?
Traders, welcome.
If you "Follow", you can always get new information quickly.
Please also click "Boost".
Have a good day.
-------------------------------------
(USDT chart)
Looking at the 1D chart, you can see that after a short but long uptrend, it recorded a pullback, creating the first gap.
In the meantime, the HA-High indicator on the 1D chart rose and was created.
Accordingly, it is necessary to ensure that funds are maintained at 81.839B or higher.
Falling while creating a gap means that funds were outflowed through USDT, so we need to check the future situation.
----------------------------------------
(USDC chart)
USDC is currently in a downtrend.
Therefore, it is necessary to check whether the trend turns upside down.
If not, and if it continues to show a downward trend, the coin market will not be able to maintain its upward trend and will likely fall sharply.
Currently, it is judged that the funds that have flowed into the coin market through USDT are defending the price, but if USDT shows a decline, it is necessary to be careful because the withdrawal of funds from the coin market can occur quickly.
The first thing to check is to see if USDC holds above the HA-Low indicator on the 1D chart.
------------------------------------------------
(BTC.D chart)
BTC dominance is good to look at to see if funds are concentrated towards BTC or towards altcoins.
This is because any other method of interpretation will rather complicate your thinking.
-------------------------------------------------
(USDT.D chart)
An increase in USDT dominance can be interpreted as a high possibility of a downward trend in the coin market.
Therefore, it is highly likely that BTC, the number one coin market by market cap, will show a downward trend.
The reason is that when trading on coin exchanges, the USDT market is as large as the BTC market.
Because various coins (tokens) can be directly traded with USDT, changes in USDT dominance can be interpreted as reflecting the overall trend of the coin market.
Therefore, support and resistance points formed on the USDT dominance chart cannot be used to directly trade coins (tokens).
However, since you can know the flow of money in the coin market, you will eventually be able to see the chart of the coin (token) you want to trade and use it as a reference for creating a trading strategy.
This is because you can figure out whether the flow of funds is moving toward buying or selling, so you can find the timing of your trade accordingly.
--------------------------------------------------
Following the DXY chart description, the same explanation is given to the USDT Dominance chart.
If you think these two explanations are different, we recommend that you read them several times in more detail.
The fact that your psychological state is starting to fluctuate due to price fluctuations means that the flow of funds is changing.
That's why, without knowing it, your own psychology starts to fluctuate.
In order to stabilize this psychological state, it can be stabilized through appropriate transactions.
Therefore, if you hold a coin (token), you can get some psychological stability by checking the movement at the support and resistance point and confirming the profit or loss by selling a certain amount.
If you do not own any coins (tokens), you can take your own psychological stability by purchasing a certain amount.
In order to trade, you must make your psychological state stable.
If you proceed with a transaction without achieving this, there is a very high possibility that the transaction will eventually fail.
-------------------------------------------------- -------------------------------------------
** All descriptions are for reference only and do not guarantee profit or loss in investment.
** Even if you know other people's know-how, it takes a considerable period of time to make it your own.
** This is a chart created with my know-how.
---------------------------------

usdt dominance can still increase!i think tomorrow usdt dominance will pullback and again keep going to touch 8.27%

Elliot Wave on USDT.DHere we can see some indications, starting from:
1. Forming Manipulation
2. Elliott Wave
3. Engulfing Candle Patterns

Let's amplify this a little bit.We have a serious bid on weekly USDT dominance chart.
It's just getting started. We have a whole summer ahead of us.

USDT.DI think we will see this soon and crypto market wil start an up trend. so make yourself ready for buying if the weekly candle is strong.

Changes to the stablecoins USDT and USDCUSDC market share has fallen from 34.88% to 23.05%
Over the past 1 year, USDC market share has fallen from 34.88% to 23.05%, with market cap dropping from a peak of $55 billion to $29 billion. BUSD's market share has plummeted from 11.68% to 4.18%, while Dai has kept its participation rate at 3.66%, down from 4.05% in May 2022. USDT, on the other hand, moved in the opposite direction, with stablecoin market dominance rising to 65.89% from 47.04% a year ago. Its market cap soared to $83.1 billion, the
In a recent interview with Bloomberg, Circle CEO Jeremy Allaire blamed the decline in stablecoin market cap on the crackdown on cryptocurrencies by US regulators. The current environment in the US seems to be working in Tether's favour.

TETHER DOMINANCE brief gain 💣🚀Hello 🐋
Based on the chart, the price is close to the support area and parallel channel support ✔️👌
if
the price doesn't break the support zone to the downside, we will see brief gain again 💣🚀
and
in long time more correction expected 💣🚀💣
👌 Notice: pay attention to the price on shortcut chart (located above the main chart with black colour) 📖💡
Please, feel free to share your point of view, write it in the comments below, thanks 🐋

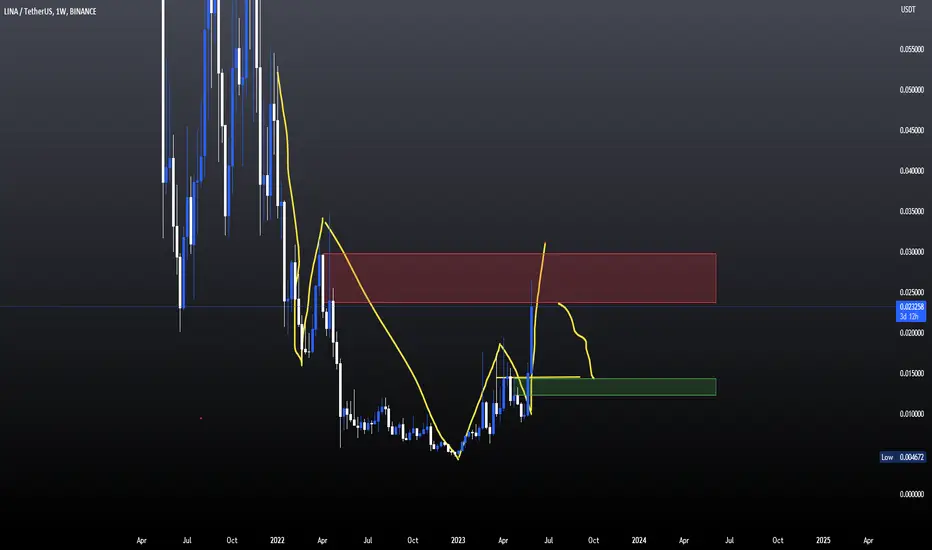
Keep an eye on $LINA/USDTKeep an eye on $LINA/USDT
Making LL HH currently on LH region
Kindly wait for breakout of the structure and target region marked
Did you find this crypto market analysis helpful? Stay updated about the latest crypto market update.
Please continue to follow my analysis and feel free to ask any queries, you may have. I am here to assist you.
TradingView: @FarmanBangashh

Market Cap Chart: Money MovementHello?
Traders, welcome.
If you "Follow", you can always get new information quickly.
Please also click "Boost".
Have a good day.
-------------------------------------
(USDT chart)
(USDC chart)
Looking at the USDT chart, it can be seen that a lot of money is flowing into the coin market, rising above the previous high of 82.467B.
However, if you look at the USDC chart, you can see that there is a constant outflow of funds.
I think this movement can be interpreted as individual investors' funds are constantly flowing into the coin market, but institutional investors are leaving their funds out of the coin market.
The reason why USDT is interpreted as an individual investor is that it is used as a channel through which individual investors can easily move funds because USDT supports trading pairs on exchanges around the world.
In particular, the main power of this USDT is expected to be Chinese funds.
USDC is still a stablecoin that has limited support for trading pairs on exchanges around the world.
Therefore, I think it is highly likely that the forces that move funds through this USDC are American funds.
I think the leadership of the coin market has shifted from Chinese capital to American capital.
This move is expected to make the coin market a transparent investment market.
However, as the possibility of being affected by movements in the capital market increases, the volatility is expected to gradually decrease.
-------------------------------------------------- ------
(BTC.D chart)
Looking at the BTC dominance chart, a volume profile is formed in the 47.64-48.80 section and the 56.78-61.73 section.
So, if it rises above 48.80, I would expect it to rise around 56.78-61.73.
I think that the reason why it starts to be affected by the movements of the world economy is because, as explained in USDT and USDC, American capital is leading the coin market.
The variable for this movement is that funds from individual investors are continuously flowing into the coin market.
This influx of funds is expected to drive the upward trend of the explosive coin market at some point.
This explosive rise will drive the rise in BTC price, which is expected to increase BTC dominance.
Therefore, I think we should observe the flow under the premise that BTC dominance will rise around 56.78-61.73.
It is actually unknown whether the price of BTC will rise or fall due to the rise in BTC dominance.
This is because BTC dominance can tell whether funds are concentrated in BTC or altcoins.
This is because the concentration of funds is relative, so if a lot of funds are withdrawn from the altcoin, BTC dominance may rise.
Therefore, I do not think it is correct to interpret that BTC price will rise as BTC dominance rises.
-------------------------------------------------- --------------
(USDT chart)
I think the first chart you should come across to understand the Coin Market Cap chart is the USDT chart.
This is because USDT has the highest market cap among stablecoins and has become an important stablecoin that supports trading pairs on exchanges around the world.
Therefore, I think that the change in USDT dominance can be used to understand the overall trend of the coin market.
When USDT dominance declines, the coin market is likely to show an uptrend.
Thus, USDT dominance allows you to know how to proceed with a trade depending on whether it is a rising or falling candle.
Since these movements are likely to move against the BTC price chart, they can help interpret BTC price fluctuations.
If USDT dominance rises above the 7.86-8.25 range, the coin market is likely to plunge.
This is because the current section is an important section.
-------------------------------------------------- -------------------------------------------
** All descriptions are for reference only and do not guarantee profit or loss in investment.
** Even if you know other people's know-how, it takes a considerable period of time to make it your own.
** This is a chart created with my know-how.
---------------------------------

Keep an eye on $PHB/USDTKeep an eye on $PHB/USDT.
Falling wedge formation in 1hr timeframe.
Did you find this crypto market analysis helpful? Stay updated about the latest crypto market update.
Please continue to follow my analysis and feel free to ask any queries, you may have. I am here to assist you.
TradingView: @FarmanBangashh
