$PEOPLEUSDT Eyes 83% Upside – Watch This BreakoutBINANCE:PEOPLEUSDT is forming a bullish falling wedge on the 6H chart.
Price bounced from key support and is approaching the resistance line. A breakout could trigger a strong move toward $0.03160
Watch for confirmation.
DYRO, NFA
Usdtdominance

$C98USDT Breakout Setup – 225% PotentialC98USDT is holding the bottom of a long-term falling wedge on the weekly chart, a key support zone.
A bounce from here could push the price up by over 225% toward the upper resistance trendline, located around $0.1175.
Strong setup, but wait for confirmation.
DYRO, NFA

$PENGU Breakout RetestCSECY:PENGU broke above the downtrend and is now retesting the breakout zone.
Holding this support could trigger a 28.91% move higher. Structure remains bullish above this level.
DYRO, NFA

USDT DOMINANCE New Update (4H) First of all you should know that "USDT Dominance" is always moving inverse of BTCUSDT .
In this analysis, we want to examine this index on lower timeframes. It has reached a support zone and a trendline.
Ideally, we should see a pullback from the green box toward the red box.
There is a high chance of price rejection from the red box to the downside, which could lead to a bullish move in the market.
Let’s see how the price reacts to the red box.
For risk management, please don't forget stop loss and capital management
Comment if you have any questions
Thank You

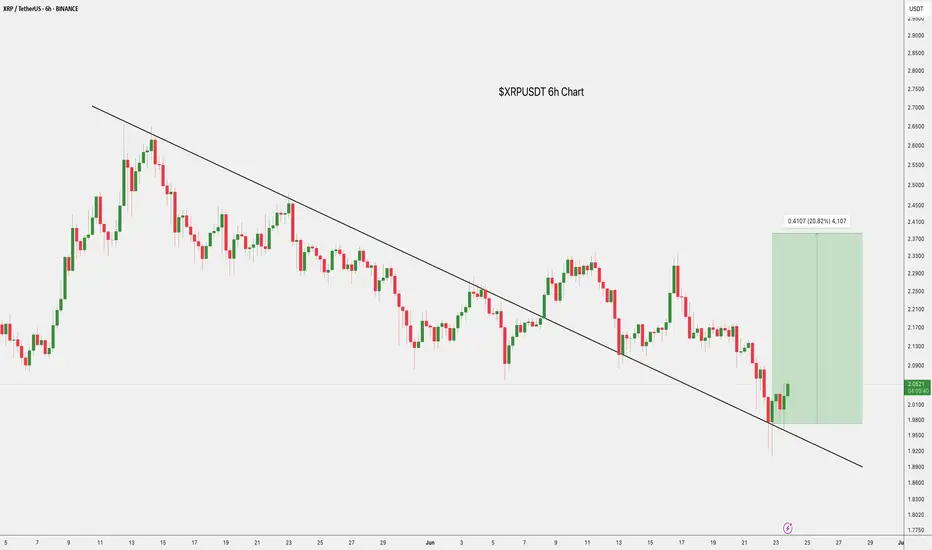
$XRP Trendline Breakout: +20% TargetCRYPTOCAP:XRP has broken out of a long-term descending trendline on the 6H chart, signaling a potential trend reversal.
Price is now holding above the breakout zone around $2.00, with a bullish target near $2.45, a potential 20% move.
Holding this support could fuel further upside.
DYRO, NFA
$FORM/USDT Breakout.$FORM/USDT just reclaimed a key demand zone after a breakout below the trendline.
The strong bullish candle signals a possible reversal, with upside potential toward $3.4456.
As long as the price holds above $2.6072–$2.7054, bulls are in control. MACD also hints at a momentum shift.
DYRO, NFA

$USDT.D Reversal Incoming USDT.D is facing rejection at key resistance near 5% within a descending wedge.
If the trendline holds, we could see a sharp - 35% drop, a strong bullish signal for altcoins and the possible start of altseason.
DYOR, NFA

USDT.D LONG - MID TERM PLANUSDT.D is one of the best tools to understand what's happening in the crypto market.
It shows the dominance of USDT across the entire space — and has a strong inverse correlation with BTC and crypto assets.
Technicals:
USDT.D is approaching its long-term support trendline.
I expect a deviation below that line — possibly toward the 0.75 Fibonacci level — before a strong move up.
That move could last 1–3 months, which means more downside for alts during this time.
Plan:
Shorting altcoins — especially ETH-related tokens and memecoins.
Looking to buy back around early August.

USDT Dominance Update (2H)The USDT Dominance (USDT.D) chart — often referred to as the “reverse chart of crypto” — is currently showing signs of strength. On the micro time frame, a new impulsive wave structure has emerged, and we are likely progressing through wave 3 of this formation.
Wave 3 appears to be targeting the 4.88% level.
A minor correction (wave 4) may follow.
Ultimately, wave 5 is projected to reach the 5.00% zone.
Market Implications:
If this scenario unfolds as expected:
Bitcoin could down toward the $100,000–$101,000 range.
However, altcoins may face a sharp correction, with potential losses of 15–20%, exacerbated by the rising BTC dominance and capital flow concentration.
⚠️ While macro bullish momentum remains intact for the market, this short-term USDT.D surge could present a temporary but significant shakeout, especially across the altcoin sector.
— Thanks for reading.

BTC.D + USDT.D + USDC.D > FLIGHT TO SAFETY SurgingStructures are being broken across the board 🚨
Looks like the Flight to Safety chart is closing the week at a new cycle ATH.
Should push to 74% before we see a meaningful turn around.

Do you wanna see the bigger picture? (USDT.D Analysis 12H)After counting many waves for many days, I have a senario for USDT dominance which will lead the entire market on its way.
For those whose not fimiliar with this parameter, there is a very simple explanation.
It's the reversed way to see the market. If this parameter drops, your alts will skyrocket and if it rises, you're gonna be crying on somebody's X post's comments.
First of all, the short term wiev is bearish. We are currently in an impulsive wave 3 which is expected to be hardest for altcoins at the moment. There will be crash unless the value of this parameter drops below %4.50 and invalidates the analysis (you'll like this senario better, trust me).
All right, we got rid of the scalpers who bothered to read this far and now I'm here to explain what I see for the golden future.
Currently, USDT.D is forming a BEARISH impulsive wave for higher time frames. As long as you stick with 4H candles, you won't be able to see it.
USDT.D is trying to forming its bearish flag, by doing so it will be its second wave and will prepare its very own collapse.
Last summer, BTC has done the same thing (Check for daily time BTC).
There is more.
If we calculate the depth of this incoming flag pattern, breaking this flag would lead USDT to %3.75 which is the yearly support (Check in weekly, you'll see it).
If we calculate the time needed to past for this flag to work, it's the same amount of time needed for previous flag to break from last summer.
We also need to add fundementals in it. Currently people started to talk about a senario which will lead world to WW3. I don't think that will happen. But the problem in here is it will market throguh downside.
Furthermore, there is FED.
FED is insisting to leave interest rates on its own without a change. I believe that we won't be seeing any rate cuts till the end of this summer.
I believe that the FED will cute rates between Agust and September. This will be the fuel for our rocket to fly and ignite the wave 3.
I know it's a long script but you know it's necessary.
Thanks for reading.

USDT DOMINANACE ANALYSIS (12H)This analysis is an update of the analysis you see in the "Related publications" section
First of all you should know that "USDT Dominance" is always moving inverse of BTCUSDT .
I correctly identified the upward movement in Tether Dominance in the previous analysis, but with the news of war in the Middle East, there are now bullish triggers for this index.
It is expected that the price will at least surge upward toward TP1.
Avoid opening impulsive and emotional positions, especially without proper risk management and setting a stop-loss | this is a dangerous market.
For risk management, please don't forget stop loss and capital management
When we reach the first target, save some profit and then change the stop to entry
Comment if you have any questions
Thank You

USDT Dominance on the Verge of Breakout — Major Market Warning?The USDT Dominance chart is flashing early warning signs — a breakout above 4.97% resistance could spell trouble for the broader crypto market.
Key Observations:
Strong uptrend from 4.51% base, respecting the rising trendline
Testing multi-week resistance at 4.97%
RSI (1H): 74.3 — entering overbought zone
Higher highs with accelerating momentum
If USDT.D breaks and sustains above 4.97%, it suggests:
Risk-off sentiment increasing
Traders rotating from crypto into stablecoins
Potential dump across major altcoins & BTC
Conclusion:
Keep your guard up. A USDT.D breakout typically front-runs broader crypto weakness. We’re at a make-or-break level.
DYOR | Not Financial Advice

$BTCUSDT Eyes $120K After Key Support BounceBTCUSDT is holding strong above the ascending trendline and key support near $104K.
A fresh bounce suggests bullish momentum, with potential to break the $110K resistance.
If that happens, the next target could be around $120K. Trend remains bullish above support.
DYRO, NFA

USDT.D Original idea inspired by trader SpartaBTC — highly recommend checking out their page.
On the chart, we can clearly see a descending channel. Historically, every time the price touched the upper boundary and started moving down toward the lower one, it marked the beginning of a broader crypto market rally.
Potential targets are shown on the chart.

Stablecoin Dominance vs Altcoins – Final Altseason Loading?This chart visualises a powerful relationship — stablecoin dominance (USDT.D + USDC.D) versus OTHERS dominance (i.e. altcoins excluding BTC and ETH).
Put simply:
When this chart moves down, stablecoins are flowing into altcoins — risk-on behavior, altseason ignites.
When it moves up, capital rotates back into stables — risk-off behavior, weakness across alts.
This has nailed every major altseason impulse and correction cycle over the past few years.
Right now, we’re seeing this pair push higher into a key supply zone — the same distribution range it previously broke down from. My expectation is a retest of that breakdown zone, which should align with a short-term correction in the altcoin market.
📉 Once this retest plays out and we see signs of weakness at supply, I anticipate continuation bearish in this pair — leading to stablecoins flowing back into altcoins.
That next leg down into higher time frame demand could mark the final altseason push, before the broader market tops out. If we follow the usual cycle pattern, that last alt impulse will likely drag retail back in for the top — just before distribution takes over and the bear phase begins.
🧠 In short:
Push into supply → altcoin correction
Breakdown → capital rotation back into alts
Final altseason + market top → bottoming of this chart + reversal bullish
This will be a key chart I’ll track closely over the next few months — it offers one of the cleanest reads on altcoin liquidity flow and timing for top formation.
1W:

USDT.D Update: Range Reversal in Play?Initially in my last update, I was expecting USDT.D to push into daily supply levels after taking the swing low from the prior daily higher low — pulling back into supply before continuing lower after the market structure break.
Instead, it pushed even deeper, taking out the range low swing at 4.56%, which allowed BTC to break higher and tag its ATH by taking major upside liquidity.
Since then, we’ve seen a cool-off from those levels. Supply has come in across majors (notably TOTAL), and I’ve been tracking the local range forming in USDT.D — forecasting a reversal back into supply. That reversal is now starting to show itself, with USDT.D rising as BTC and alts pull back.
I'm currently watching for a push into the 5.0% – 5.6% supply zone, which I believe could mark the next major pivot point for the market.
From there, I’ll be looking for weakness or signs of rejection in USDT.D — which would align with BTC and the broader market setting up for another leg higher.
Once this supply is hit and the move starts rolling over, I expect USDT.D to begin its final phase down toward 3.73% — a key HTF demand and bullish reversal level. That would mark a major shift, coinciding with what I believe will be the macro market top forming across risk assets.
This level will be one I’m watching closely for DCA entries and scaling back into exposure — the reversal in USDT dominance from that zone should align with the last stage of the current cycle before distribution takes over.
1D:
3D:
1W:
3M:


USDT.D Consolidation Near Breakout Zone – Eyes on the Next MoveHello traders, here is the USDT.D update:
The chart is currently hovering near a major resistance zone, one that historically plays a key role in triggering altseason.
After a period of consolidation inside the mid-range S/R zone, price is now testing the downtrend line from above. A clear rejection here could spark renewed confidence in altcoins, giving them space to rally.
On the flip side, a breakout above this level may delay altseason momentum, as capital remains parked in stablecoins.
For now, this zone is the make-or-break area for altcoin sentiment. Keep it on your radar, the next move could set the tone for the coming weeks.

USDT.D/OTHERS.D - Altcoin Season IndicatorPrice rejected from the 3M HTF supply and major BSL on the prior highs. Price has now gave a confirmed 1W bearish market shift, indicating a market wide altcoin reversal is playing out and the next bullish impulse higher isnt far off....
Watching for rejections in this weekly supply on this pair as marked and looking for a bearish daily market shift to give confirmations of a potential reversal bearish in line with the recent weekly bearish market shift that occurred from the BSL sweep into 3M supply and refined supply within it.
As shown, this chart is an altcoin indicator and im expecting that last altcoin season and cycle to occur after this chart tops out into supply and then continues lower into the SSL low at 0.29% and into the 3 month demand below it.
Seeing similar indications from the other charts shared like BTC.D and BTC.D+ETH.D+USDT.D+USDC.D, where they show continued weakness in alts for now with a HYTF bullish reversal in altcoins not far off.
3D:
1W:


TradeCityPro | Bitcoin Daily Analysis #116👋 Welcome to TradeCity Pro!
Let’s dive into the analysis of Bitcoin and the key crypto indices. As usual, I’m going to review the futures triggers for the New York session.
✅ Yesterday, a very important event occurred: Israel launched a military attack on Iran, targeting not only military facilities but also residential areas.
⚔️ Leaving aside the fact that war is always a global tragedy, the fact that Israel also hit civilian zones shows that the tensions between these two countries have entered a new phase.
💫 In addition to civilian casualties, key commanders of the Iranian military were assassinated in these strikes.
🏳️ Most countries such as the United States, France, and most of Europe supported Israel in this conflict, while only North Korea and Russia backed Iran.
📊 Given these rising tensions and the cancellation of Sunday’s negotiations between Iran and the U.S., the likelihood of war between Iran and Israel has greatly increased following the resolution signed yesterday.
⭐ This development has caused safe-haven assets like gold to move upward, while risk-on assets like crypto have started to decline. As you can see, Bitcoin has been falling since yesterday.
⏳ 1-Hour Timeframe
On the 1-hour chart, as mentioned, after an initial correction to the 108436 zone, Bitcoin continued its decline down to 103606, breaking through the support level we had marked due to the war-related news.
✨ Currently, the price has found support at 103606 and has started a corrective phase. RSI has also exited the Oversold area and is now heading toward the 50 zone.
📉 In my opinion, under the current market conditions, we should wait to see how Iran reacts to Israel's actions. If war breaks out, Bitcoin is likely to drop again.
⚡️ Personally, I’m holding off on opening any positions until we get more clarity on the fundamental developments between Iran and Israel. I'm also not closing any of my longer-term positions that were opened in lower zones like 88k.
🔔 However, if you are looking to open a position, you could enter on a break below 103606. I don’t currently have a trigger for a long position and would prefer to wait for a proper structure to develop.
👑 BTC.D Analysis
Bitcoin dominance moved upward along with the market decline and, after breaking through 64.18, continued its bullish leg up to 64.85.
🧩 It has since begun a corrective phase after hitting that resistance. If this correction continues, the next zone to watch is 64.49.
📅 Total2 Analysis
This index also dropped alongside Bitcoin yesterday, falling from 1.18 down to 1.12 after triggering a short.
🔍 The price has since corrected up to 1.14. If a new bearish leg begins, we can open a short position on a break below 1.12.
📅 USDT.D Analysis
Tether dominance moved upward after triggering 4.68 and reached 4.89.
💥 If 4.79 is broken, the correction could continue. If 4.89 is broken, the next bullish leg in dominance will begin.
❌ Disclaimer ❌
Trading futures is highly risky and dangerous. If you're not an expert, these triggers may not be suitable for you. You should first learn risk and capital management. You can also use the educational content from this channel.
Finally, these triggers reflect my personal opinions on price action, and the market may move completely against this analysis. So, do your own research before opening any position.
