Usdtdominance

USDT.D Consolidation Near Breakout Zone – Eyes on the Next MoveHello traders, here is the USDT.D update:
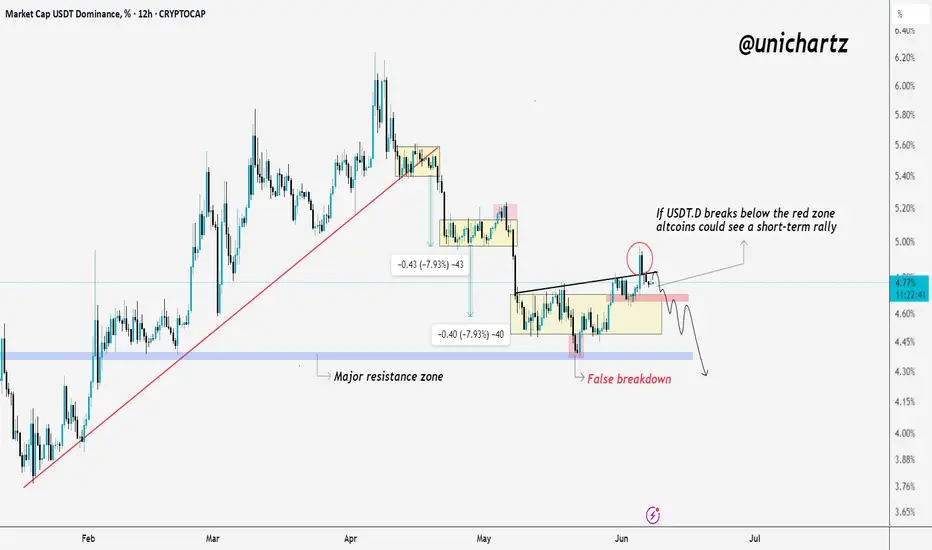
The chart is currently hovering near a major resistance zone, one that historically plays a key role in triggering altseason.
After a period of consolidation inside the mid-range S/R zone, price is now testing the downtrend line from above. A clear rejection here could spark renewed confidence in altcoins, giving them space to rally.
On the flip side, a breakout above this level may delay altseason momentum, as capital remains parked in stablecoins.
For now, this zone is the make-or-break area for altcoin sentiment. Keep it on your radar, the next move could set the tone for the coming weeks.

USDT.D/OTHERS.D - Altcoin Season IndicatorPrice rejected from the 3M HTF supply and major BSL on the prior highs. Price has now gave a confirmed 1W bearish market shift, indicating a market wide altcoin reversal is playing out and the next bullish impulse higher isnt far off....
Watching for rejections in this weekly supply on this pair as marked and looking for a bearish daily market shift to give confirmations of a potential reversal bearish in line with the recent weekly bearish market shift that occurred from the BSL sweep into 3M supply and refined supply within it.
As shown, this chart is an altcoin indicator and im expecting that last altcoin season and cycle to occur after this chart tops out into supply and then continues lower into the SSL low at 0.29% and into the 3 month demand below it.
Seeing similar indications from the other charts shared like BTC.D and BTC.D+ETH.D+USDT.D+USDC.D, where they show continued weakness in alts for now with a HYTF bullish reversal in altcoins not far off.
3D:
1W:


TradeCityPro | Bitcoin Daily Analysis #116👋 Welcome to TradeCity Pro!
Let’s dive into the analysis of Bitcoin and the key crypto indices. As usual, I’m going to review the futures triggers for the New York session.
✅ Yesterday, a very important event occurred: Israel launched a military attack on Iran, targeting not only military facilities but also residential areas.
⚔️ Leaving aside the fact that war is always a global tragedy, the fact that Israel also hit civilian zones shows that the tensions between these two countries have entered a new phase.
💫 In addition to civilian casualties, key commanders of the Iranian military were assassinated in these strikes.
🏳️ Most countries such as the United States, France, and most of Europe supported Israel in this conflict, while only North Korea and Russia backed Iran.
📊 Given these rising tensions and the cancellation of Sunday’s negotiations between Iran and the U.S., the likelihood of war between Iran and Israel has greatly increased following the resolution signed yesterday.
⭐ This development has caused safe-haven assets like gold to move upward, while risk-on assets like crypto have started to decline. As you can see, Bitcoin has been falling since yesterday.
⏳ 1-Hour Timeframe
On the 1-hour chart, as mentioned, after an initial correction to the 108436 zone, Bitcoin continued its decline down to 103606, breaking through the support level we had marked due to the war-related news.
✨ Currently, the price has found support at 103606 and has started a corrective phase. RSI has also exited the Oversold area and is now heading toward the 50 zone.
📉 In my opinion, under the current market conditions, we should wait to see how Iran reacts to Israel's actions. If war breaks out, Bitcoin is likely to drop again.
⚡️ Personally, I’m holding off on opening any positions until we get more clarity on the fundamental developments between Iran and Israel. I'm also not closing any of my longer-term positions that were opened in lower zones like 88k.
🔔 However, if you are looking to open a position, you could enter on a break below 103606. I don’t currently have a trigger for a long position and would prefer to wait for a proper structure to develop.
👑 BTC.D Analysis
Bitcoin dominance moved upward along with the market decline and, after breaking through 64.18, continued its bullish leg up to 64.85.
🧩 It has since begun a corrective phase after hitting that resistance. If this correction continues, the next zone to watch is 64.49.
📅 Total2 Analysis
This index also dropped alongside Bitcoin yesterday, falling from 1.18 down to 1.12 after triggering a short.
🔍 The price has since corrected up to 1.14. If a new bearish leg begins, we can open a short position on a break below 1.12.
📅 USDT.D Analysis
Tether dominance moved upward after triggering 4.68 and reached 4.89.
💥 If 4.79 is broken, the correction could continue. If 4.89 is broken, the next bullish leg in dominance will begin.
❌ Disclaimer ❌
Trading futures is highly risky and dangerous. If you're not an expert, these triggers may not be suitable for you. You should first learn risk and capital management. You can also use the educational content from this channel.
Finally, these triggers reflect my personal opinions on price action, and the market may move completely against this analysis. So, do your own research before opening any position.

TradeCityPro | Bitcoin Daily Analysis #115👋 Welcome to TradeCity Pro!
Let’s dive into the analysis of Bitcoin and the key crypto indices. As usual, I’ll be reviewing the futures triggers for the New York session.
⏳ 1-Hour Timeframe
On the 1-hour chart, as you can see, yesterday the price was rejected from the 110256 level I previously mentioned. Following that, with the activation of the 108617 trigger, Bitcoin experienced a downward leg.
📊 Personally, I didn’t open a short position after the break of that level, but if you did, I suggest taking profits now as the price has reached the marked support zone.
🔍 As for me, I’ll wait to see how the price reacts to this support. If it breaks down, we can open a short position.
📈 However, if the price finds support here, we can once again look for a long position. The trigger for this will be found in the lower timeframes.
👑 BTC.D Analysis
Let’s move to Bitcoin dominance. Yesterday, BTC.D made a pullback to the 64.18 zone and now seems ready for another drop.
✔️ If 63.96 breaks, BTC.D could enter another bearish leg. If instead, the 64.18 ceiling breaks, it could push up toward 64.49 or even 64.67.
📅 Total2 Analysis
Looking at the Total2 index, after reaching 1.24 yesterday, it started to correct and dropped down to 1.18, touching the support with a shadow.
✨ If the 1.2 level breaks to the upside, the price could move back toward 1.24. If 1.18 breaks down, the correction may continue further.
📅 USDT.D Analysis
Now onto USDT.D. After a brief correction up to the 4.68 level, it has resumed its downward movement. If 4.64 breaks, the decline could extend toward 4.56.
💥 If instead, the 4.68 top breaks, it might bounce back up toward 4.72.
❌ Disclaimer ❌
Trading futures is highly risky and dangerous. If you're not an expert, these triggers may not be suitable for you. You should first learn risk and capital management. You can also use the educational content from this channel.
Finally, these triggers reflect my personal opinions on price action, and the market may move completely against this analysis. So, do your own research before opening any position.

USDT DOMINANCE NEW UPDATE (4H)The price is now approaching an important support zone and hasn’t yet pulled back to the broken trendline.
It’s expected that the price will soon recover from the green box, move toward the red box as a symbolic move, and then get rejected downward again from the red box.
For risk management, please don't forget stop loss and capital management
Comment if you have any questions
Thank You

TradeCityPro | Bitcoin Daily Analysis #114👋 Welcome to TradeCity Pro!
Let’s go over Bitcoin analysis and the key crypto indexes. As usual, I’ll break down the futures triggers for the New York session.
⏳ 1-Hour Timeframe
On the one hour timeframe, as you can see, a trading range has formed between the levels of 108617 and 110256. This has happened after a strong upward move with significant buying volume, and now we’re in a market correction phase.
📊 Market volume is decreasing during this corrective phase, which shows the strength of the buyers and supports the ongoing uptrend. RSI has exited the Overbuy zone and is now cooling off, which indicates that the bullish momentum has weakened for now.
📈 For a long position, the 110256 trigger seems very suitable today. If the price forms a higher low above 108617 before breaking this level, the probability of breaking 110256 increases significantly.
💥 If this trigger is activated, it’s crucial that volume rises as well. That would confirm the strength of the trend and increase the chances of the uptrend continuing. The current target for this position is 111747.
🔽 In the correction scenario, if the price stabilizes below 108617, this scenario becomes more likely and a deeper correction could follow.
✨ Personally, I won’t open a short position unless we get confirmation of a trend reversal. But if you want to go short, a break below 108617 is not a bad option and could signal a downward move.
👑 BTC.D Analysis
Bitcoin dominance has continued its downward movement, stabilized below 64.12, and is now heading toward 63.93.
⭐ If the 63.93 low is broken, the bearish move in dominance will likely continue. If it pulls back, a break above 64.12 will confirm that retracement.
📅 Total2 Analysis
Let’s look at Total2. Yesterday, it broke through the 1.2 level and is now moving toward 1.24. A breakout above this level could start the next bullish leg.
🎲 If a correction occurs, the price may drop back to 1.2 or even 1.18.
📅 USDT.D Analysis
Now for Tether dominance. This index is still sitting at the 4.56 support and is currently being held there. If 4.56 breaks, the next bearish leg can form.
🔔 In case of a retracement, USDT dominance might rise to 4.64.
❌ Disclaimer ❌
Trading futures is highly risky and dangerous. If you're not an expert, these triggers may not be suitable for you. You should first learn risk and capital management. You can also use the educational content from this channel.
Finally, these triggers reflect my personal opinions on price action, and the market may move completely against this analysis. So, do your own research before opening any position.


TradeCityPro | Bitcoin Daily Analysis #113👋 Welcome to TradeCity Pro
Let’s dive into the Bitcoin analysis and key crypto indexes. As usual in this analysis, I’ll walk you through the futures triggers for the New York session.
⏳ 1-Hour Timeframe
As you can see in the one hour timeframe, Bitcoin has continued its upward movement and reached the 110256 level and is now undergoing a correction.
✔️ If the price continues correcting, the next support level will be 108777. In case of a deeper pullback, the next area to watch is 106586.
📈 For a long position, our first trigger level is 110256, with a target of 111747.
📊 Market volume is currently increasing, and if this inflow of buy volume continues, the probability of a bullish move increases.
💥 The RSI oscillator has dropped below the 70 level. If RSI reenters the overbought zone, we’ll also get a strong momentum confirmation.
👑 BTC.D Analysis
Let’s take a look at Bitcoin Dominance. Today, it finally closed below the 64.49 level and has dropped to 64.12.
⚡️ This drop has allowed capital to flow into altcoins, and many of them are moving upward today. If 64.12 breaks, the downtrend may continue.
📅 Total2 Analysis
Moving on to Total2, this index finally broke above the 1.21 level and is now heading toward 1.24.
💫 At the moment, there is no major resistance preventing the market from continuing its upward trend. But there’s an important point regarding USDT Dominance, which I’ll cover below.
📅 USDT.D Analysis
During this bullish move in the market, the dominance of Tether hit the support at 4.56, while other indexes and most altcoins activated their triggers.
🔑 The key point here is that Tether Dominance has such a significant influence on the market that the inability to break this support has caused the entire market, including Bitcoin, to start correcting.
🔽 The 4.56 level in USDT Dominance is very important and will be the key to triggering the next bullish leg.
❌ Disclaimer ❌
Trading futures is highly risky and dangerous. If you're not an expert, these triggers may not be suitable for you. You should first learn risk and capital management. You can also use the educational content from this channel.
Finally, these triggers reflect my personal opinions on price action, and the market may move completely against this analysis. So, do your own research before opening any position.

USDT.D(based on NEowave)I think wave E of triangle touched the necessary high and crypto is ready for a big pump.
pay attention to the targets and stop loss!

TradeCityPro | Bitcoin Daily Analysis #112👋 Welcome to TradeCity Pro
Let’s dive into the analysis of Bitcoin and key crypto indexes. As usual, in this analysis I’ll review the futures triggers for the New York session.
⏳ 1-Hour Timeframe
Yesterday, Bitcoin finally broke through the resistance zone it had formed. As you can see, it pushed through this level with strong buying volume and is now moving toward 108777.
🔍 If you entered a position using yesterday’s triggers, I’d be glad to hear about it in the comments. Your feedback gives me great energy.
⭐ Today, I cannot provide a specific trigger because the market has already made its move. If you do not have an open position, it is better to wait for a new market structure and then identify a fresh trigger.
💥 At the moment, I expect Bitcoin’s upward movement to continue toward 108777. Market volume is strongly supporting the trend and is aligned with price action. RSI is also in the overbought zone, indicating strong buyer presence. If RSI stays above 70, the sharp upward movement is likely to continue.
📊 If a market correction occurs, the price could pull back to the zone I marked. In future analyses, I will review triggers for both trend continuation and possible reversals.
👑 BTC.D Analysis
Bitcoin dominance formed a higher low above 6449 and has now broken the 6467 resistance, signaling the beginning of a new bullish leg.
⚡️ If this upward move continues, Bitcoin dominance may climb further. However, if a pullback to 6467 happens, altcoins could see a strong upward move as well.
📅 Total2 Analysis
Looking at Total2, this index was supported at 114 yesterday and is now moving toward 117.
📈 If Bitcoin dominance starts to drop, Total2 will likely break above 117 and begin a main bullish trend.
📅 USDT.D Analysis
Now for Tether dominance. After forming a lower high below 479, it broke below the 472 support and is now heading toward 464.
✅ In my view, this movement toward 464 is likely to continue, and as that happens, the overall crypto market is expected to keep moving upward.
❌ Disclaimer ❌
Trading futures is highly risky and dangerous. If you're not an expert, these triggers may not be suitable for you. You should first learn risk and capital management. You can also use the educational content from this channel.
Finally, these triggers reflect my personal opinions on price action, and the market may move completely against this analysis. So, do your own research before opening any position.

TradeCityPro | Bitcoin Daily Analysis #111👋 Welcome to TradeCity Pro!
Let’s take a look at Bitcoin and key crypto indicators. As usual in this analysis, I’ll review the futures triggers for the New York session.
⏳ 1-Hour Timeframe
As you can see in the 1-hour timeframe, none of our triggers were activated yesterday and Bitcoin has been ranging.
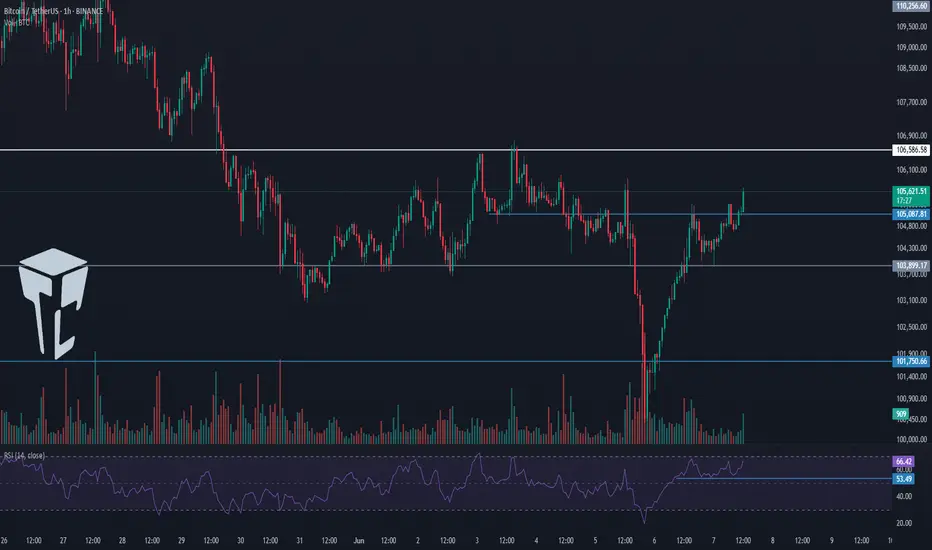
⭐ There was an important RSI level at 53.49, which was tested multiple times. I mentioned that breaking this level could trigger a slight correction — and that’s exactly what happened. The price pulled back slightly to 105087, retested this zone, and now RSI has returned above 53.49. Price is also moving with strong bullish momentum toward the 105851 resistance.
📊 The buying volume entering the market is quite strong, and if this increase continues, the price could begin an upward move. So in terms of both momentum and volume, we have bullish confirmation and can enter a position if the triggers activate.
📈 For a long position, the trigger we’re watching is 105851. While the main resistance is at 106586, I prefer to take the risk and open the position earlier, because I think the 106586 break won’t provide a clean entry and would be harder to act on.
✨ So my chosen trigger for a long position is 105851. Given the rising volume and high RSI momentum, we have the confirmations needed to open this trade.
🔽 For a short position, the first trigger is the break of 105087. This is a risky position since we haven’t yet confirmed a trend reversal — this would be the first signal if a downtrend begins. Personally, I’ll wait for confirmation of bearish momentum before opening a short.
👑 BTC.D Analysis
Bitcoin Dominance is still below the 64.67 level and is ranging under this resistance.
🧩 A break above 64.67 would confirm a bullish move in dominance. A break below 64.49 would signal a bearish reversal.
📅 Total2 Analysis
Total2 is ranging below the 1.15 level. A break above this zone could initiate a bullish move.
🔔 On the bearish side, the current trigger is the 1.13 level. We need to wait for this level to be broken for a trend reversal confirmation.
📅 USDT.D Analysis
Tether Dominance stabilized below the 4.79 zone yesterday and has now pulled back to it, preparing for a possible second leg downward.
🔑 If that happens, the crypto market could move upward. However, if USDT.D rises back above 4.79, its uptrend could continue.
❌ Disclaimer ❌
Trading futures is highly risky and dangerous. If you're not an expert, these triggers may not be suitable for you. You should first learn risk and capital management. You can also use the educational content from this channel.
Finally, these triggers reflect my personal opinions on price action, and the market may move completely against this analysis. So, do your own research before opening any position.

Eyes on USDT.D — Potential Altcoin Rotation SetupUSDT Dominance Update (USDT.D)
USDT.D is currently sitting just above the key red zone (support).
This level has acted as an important pivot for the last few weeks.
If we see a breakdown below this zone, it could trigger a short-term rally in altcoins — as capital rotates out of stablecoins into risk assets.
However, if USDT.D holds and bounces from this level again, it may put short-term pressure on alts.
Key Level to Watch:
The red zone — a clean break below it could open the door for a fresh altcoin run.
For now, patience is key. Let the chart confirm.
USDT DOMINANCE Update (4H)In our latest analysis, we pointed out the bullish movement in Tether dominance and warned to be cautious | and eventually, that move played out.
The bullish movement in Tether dominance started from the point where we placed the green arrow on the chart. It appears to be an ABC pattern, and we are currently in wave C.
Now, after the drop, the price is approaching a support zone that could potentially push it back to higher levels, so we need to stay alert.
The bullish wave C could complete in one of the marked zones.
Let’s see what happens.
For risk management, please don't forget stop loss and capital management
When we reach the first target, save some profit and then change the stop to entry
Comment if you have any questions
Thank You

TradeCityPro | Bitcoin Daily Analysis #110👋 Welcome to TradeCity Pro!
Let’s dive into the Bitcoin analysis and major crypto indexes. In this review, as usual, I’ll cover the key futures triggers for the New York session.
⏳ 1-Hour Timeframe
As you can see in the 1-hour timeframe, Bitcoin formed a higher low yesterday and has now reached the 105087 resistance. It seems likely that this level will be broken soon.
✨ Currently, a candle has closed above 105087, but price hasn’t yet confirmed a breakout, and the move hasn’t taken off.
📈 For a long position, we can enter once the price confirms a breakout above this level. If 105087 breaks, price could target 106586. The main long position will be opened upon breaking 106586.
🛒 Strong buying volume is a very good trigger for this setup. RSI entering the Overbought zone would also provide a powerful momentum confirmation, and price could rise accordingly.
💥 If the current upward move fails and price falls below the recent low, we can open a short position upon breaking 103899, targeting 101750.
⚡️ The 53.49 level on RSI is critical — its break would serve as a strong confirmation for the short position.
👑 BTC.D Analysis
Looking at Bitcoin Dominance, yesterday it once again moved toward 64.67, but failed to break it and is now heading downward after being rejected from that resistance.
🔑 The trigger for bullish continuation remains 64.67, while 64.49 serves as the trigger for a bearish move.
📅 Total2 Analysis
This index formed a higher low at 1.13 yesterday and is now testing the 1.15 resistance. If this level breaks, the price could head toward 1.17 and 1.18.
📊 A break above 1.15 would be a valid long trigger. However, if price is rejected and moves downward, breaking 1.13 could send it back toward 1.1.
📅 USDT.D Analysis
USDT Dominance closed below the 4.79 level yesterday and is now moving toward 4.70. If this continues, the crypto market could see bullish momentum.
🧩 However, if dominance moves back above 4.9, the next bullish leg in USDT.D could begin.
❌ Disclaimer ❌
Trading futures is highly risky and dangerous. If you're not an expert, these triggers may not be suitable for you. You should first learn risk and capital management. You can also use the educational content from this channel.
Finally, these triggers reflect my personal opinions on price action, and the market may move completely against this analysis. So, do your own research before opening any position.
USDT.D Breakout Fading — Relief Rally Ahead for Crypto?Yesterday’s spike in USDT.D during the volatility shook the market hard — but look closer 👀
This breakout above the range could be a seller’s trap. We saw a breakout attempt with strong wicks and rejection right after, hinting that buyers might regain control soon.
The false breakdown earlier and quick reclaim of the range further supports this bias.
If USDT.D starts falling again, it could fuel a recovery in risk assets (BTC + alts). For now — watching for confirmation, but cautioning against chasing fear here.
Stay sharp

TradeCityPro | Bitcoin Daily Analysis #109👋 Welcome to TradeCity Pro!
Let’s dive into the Bitcoin analysis and key crypto indicators. As usual, I’ll walk you through the futures triggers for the New York session.
⏳ 1-Hour Timeframe
In the 1-hour chart, as you can see, yesterday Bitcoin activated the short trigger at 103899 and dropped below the 101750 level. This setup gave an opportunity to open a short position—hopefully you took advantage of it.
✨ After that bearish leg, the downtrend ended and the price began to rise again, now reaching back to the 103899 level.
🔍 If the price gets rejected once from 103899 and then forms a higher low compared to 101750, we can consider a long position on subsequent attempts—if 103899 breaks. If the price breaks this level sharply, the next long triggers will be 105087 and 106586.
📉 For today's short position, we can enter on a pullback to 103899. Personally, I’ll look for a bearish trigger in lower timeframes; if confirmed, I’ll open a short. The main bearish trigger remains the break of 101750.
📊 Currently, volume favors buyers, but we’ve seen divergence during this bullish leg, and volume increased on the last bearish move. So, I still see a higher probability of the market turning bearish rather than bullish.
👑 BTC.D Analysis
Looking at Bitcoin dominance, yesterday it made an upward move to 64.67 after breaking through 64.23. This 64.67 level is a strong resistance, and as shown, the dominance got rejected there.
💫 If this rejection is confirmed, there's a high chance of a retracement back to 64.23. In that case, if the market continues to drop, Bitcoin will likely be a better short than altcoins.
☘️ However, if 64.67 breaks, dominance could initiate another bullish wave.
📅 Total2 Analysis
As for Total2, after activating the 1.16 and 1.13 triggers, it dropped to the 1.1 zone and is now making a pullback to its previous support—similar to Bitcoin.
💥 For a long position, we’ll need a Dow Theory confirmation. For a short, we can wait for a pullback to 1.13 and look for a bearish confirmation to enter.
📅 USDT.D Analysis
Now onto Tether dominance: yesterday, after breaking 4.79, it moved up to 4.98. Following that, it reversed and is now back down to 4.79.
🔑 If 4.79 breaks, Tether dominance could drop further to 4.70 and 4.64. But if it holds and finds support there, another bullish leg may begin.
❌ Disclaimer ❌
Trading futures is highly risky and dangerous. If you're not an expert, these triggers may not be suitable for you. You should first learn risk and capital management. You can also use the educational content from this channel.
Finally, these triggers reflect my personal opinions on price action, and the market may move completely against this analysis. So, do your own research before opening any position.

USDT Dominance Update (4H)First of all, as you know, the market has been going through complex corrections lately, and the scenarios are not very clear. So make sure to trade with proper risk management and a defined stop-loss.
It seems this index is preparing for a drop. It has tapped into the origin order block, and from here, it has the potential to move downward.
The good thing about this setup is that the invalidation level is close. If a 4-hour candle closes above this level, the analysis will be invalidated.
For risk management, please don't forget stop loss and capital management
Comment if you have any questions
Thank You

TradeCityPro | Bitcoin Daily Analysis #108👋 Welcome to TradeCity Pro!
Let’s dive into the analysis of Bitcoin and key crypto indices. As usual, in this analysis, I’ll review the futures session triggers for New York.
⏳ 1-Hour Timeframe
As you can see in the 1-hour timeframe, yesterday the 105087 trigger was activated, and now after a pullback to that level, the price is heading toward the 103899 support.
💥 If you entered a short position based on the 105087 trigger, you can hold it until 103899. If you haven’t opened a position yet, you can consider today’s triggers.
🔽 The first short trigger for today is the 103899 level. A break below this level can start a major bearish move. Personally, I’ll enter a short if this level breaks.
⚡️ Breaking below 38.95 on the RSI will give us a suitable momentum confirmation. If selling volume increases, the probability of a bearish move will rise.
📈 For long positions, our first trigger is the same 105087 level. If a higher low is formed compared to 103899 and this level breaks, it will provide a good long opportunity.
💫 The main long trigger is 106586. If this level is broken, the uptrend can resume and price could move toward higher resistance levels.
👑 BTC.D Analysis
Looking at Bitcoin Dominance, a range box has formed between 63.93 and 64.23.
✨ A break above 64.23 confirms bullish continuation, while a break below 63.93 confirms a bearish trend in dominance.
📅 Total2 Analysis
Moving to Total2, yesterday it closed below 1.17, and now after a pullback, it's heading toward 1.16.
✅ If 1.16 breaks, a short position can be opened. If the downward move turns out to be fake, a break above 1.18 gives us a long trigger.
📅 USDT.D Analysis
Looking at Tether Dominance, yesterday it confirmed above 4.70 and is now moving toward 4.79. A break of 4.79 could signal a continuation of the upward move.
📊 If it closes back below 4.70, the price could move toward 4.64. A break below 4.64 would signal a bearish trend in USDT dominance.
❌ Disclaimer ❌
Trading futures is highly risky and dangerous. If you're not an expert, these triggers may not be suitable for you. You should first learn risk and capital management. You can also use the educational content from this channel.
Finally, these triggers reflect my personal opinions on price action, and the market may move completely against this analysis. So, do your own research before opening any position.

TradeCityPro | Bitcoin Daily Analysis #107👋 Welcome to TradeCity Pro!
Let’s dive into Bitcoin and key crypto indices. As usual, in this analysis I’ll walk you through the triggers for the New York futures session.
⏳ 1-Hour Timeframe
As you can see in the 1-hour timeframe, yesterday the price made another upward move and formed its resistance at the 106586 level and a bottom at 105087.
📈 For a long position, considering the uptrend in higher timeframes such as the daily and weekly, we can enter upon a breakout of 106586. A bounce of the RSI from the 50 level can act as a good confirmation for the position.
📊 Buying volume is currently increasing, but the price is still sitting on the support bottom and hasn’t moved upward yet. If this volume inflow continues, a breakout of 106586 would be a strong confirmation for a long position.
🔽 For a short position, the first trigger is the breakdown of the 105087 bottom. If this level is broken, we can enter a short. The main short trigger is at 103899.
💥 Conditions are currently favorable for a short position, and the current candle has strong bearish momentum. So, if 105087 breaks, a short position would be appropriate.
👑 BTC.D Analysis
Let’s look at Bitcoin Dominance. After a pullback to the 64.23 level, the next bearish leg continued to 63.93. If 63.93 breaks, the downtrend is likely to continue and the price could fall to 63.50.
✅ If 63.93 holds, dominance may start moving back up toward 64.67.
📅 Total2 Analysis
Now let’s check out Total2. This index is still below the 1.18 level, and breaking this level would confirm a bullish move.
✨ A new bottom has also formed at 1.17. If this level breaks, we can look for a short position.
📅 USDT.D Analysis
Now to Tether Dominance. This index has formed a box between 4.64 and 4.70.
🔔 A breakout above 4.70 could initiate a bullish move in dominance, while a breakdown below 4.64 could trigger a bearish move.
❌ Disclaimer ❌
Trading futures is highly risky and dangerous. If you're not an expert, these triggers may not be suitable for you. You should first learn risk and capital management. You can also use the educational content from this channel.
Finally, these triggers reflect my personal opinions on price action, and the market may move completely against this analysis. So, do your own research before opening any position.

TradeCityPro | Bitcoin Daily Analysis #106👋 Welcome to TradeCity Pro!
Let’s dive into Bitcoin and the key crypto indices. As usual, I’ll be reviewing the futures triggers for the New York session.
⏳ 1-Hour Timeframe
On the 1-hour chart, the 105800 trigger was activated yesterday and Bitcoin’s trendline was broken. However, the price failed to hold above 105800 and quickly fell back below, making it a fake breakout.
⚡️ For now, I’m keeping the 105800 level as the long trigger to observe how the price reacts. We need to wait for a clear reaction to this zone to better refine the trendline. On the next test, if it breaks successfully, we can enter a long position.
🔍 If a higher low forms above 103899 and the RSI finds support above 50, the likelihood of breaking the 105800 resistance increases, potentially leading to a stronger upward move.
✨ On the short side, since the 105800 breakout failed, bearish momentum could increase. A breakdown below 103899 would trigger a short position with a target at 10750.
If you’ve already opened a short position before this trigger, be aware that it's a risky trade and shouldn’t be relied on as a long-term position.
👑 BTC.D Analysis
The downtrend in Bitcoin dominance has continued following the breakdown of 64.29, and now it has also broken below 64.15, heading toward 63.87.
⭐ For now, BTC dominance is temporarily bearish. If the market corrects, Bitcoin might fall harder, but if the market recovers, altcoins could perform better — unless BTC dominance reverses trend.
📅 Total2 Analysis
Yesterday, the long trigger at 1.16 was activated, and now the index has reached 1.18. Thanks to falling Bitcoin dominance, altcoins have outperformed Bitcoin.
✔️ If 1.18 breaks, the uptrend could continue. Key levels to watch next are 1.21 and 1.24.
📅 USDT.D Analysis
This index formed a lower high below 4.79 yesterday and is now retesting 4.70 after breaking below it.
🎲 If this pullback gets rejected, it confirms weakness in USDT dominance — which supports long positions on altcoins. However, if USDT.D climbs back above 4.70 and it turns into a fake breakdown, there’s a strong chance it could revisit 4.79 or even break that resistance.
❌ Disclaimer ❌
Trading futures is highly risky and dangerous. If you're not an expert, these triggers may not be suitable for you. You should first learn risk and capital management. You can also use the educational content from this channel.
Finally, these triggers reflect my personal opinions on price action, and the market may move completely against this analysis. So, do your own research before opening any position.

TradeCityPro | Bitcoin Daily Analysis #105👋 Welcome to TradeCity Pro!
Let’s dive into Bitcoin and key crypto indices. As usual, in this analysis, I’ll walk you through the triggers for the New York futures session.
⏳ 1-Hour Timeframe
On the 1-hour chart, as you can see, Bitcoin’s correction phase began after the breakdown of the 107010 level. Currently, after pulling back to the 105673 area, it seems ready to begin its next corrective leg.
✔️ One of the reasons Bitcoin has moved downward over the past few days is the escalation of war between Ukraine and Russia. As the conflict intensified, risk assets like Bitcoin dropped while safe-haven assets like gold surged.
🔍 Currently, price action is forming an expanding triangle and is trending downward. It was recently rejected from the triangle’s top and is now sitting on a key support at 103899.
💥 If 103899 breaks, a short position targeting 101750 could be triggered. Selling volume has increased significantly, confirming bearish momentum, so opening a short upon a break of 103899 appears logical. However, keep in mind that the primary market trend remains bullish, and there is a high probability that any short may hit stop-loss.
📈 For a long position, the first trigger would be a breakout above the triangle. In this case, breaking 105673 could justify entry. Key overhead resistances are located at 107010 and 110256.
👑 BTC.D Analysis
Looking at Bitcoin dominance, the metric continued its upward move to reach 64.67 and has since been rejected from that level.
⚡️ If the bullish move continues, the breakout above 64.67 would act as a bullish trigger. On the other hand, a breakdown below 64.29 would confirm a bearish shift.
📅 Total2 Analysis
Total2 is currently ranging between 1.13 and 1.16. A breakout from either side could serve as a trigger for a directional position.
📊 If 1.13 breaks, a short position could be considered. Conversely, breaking above 1.16 would signal a potential long.
📅 USDT.D Analysis
After breaking above 4.70, USDT dominance has been ranging between 4.70 and 4.79. It’s now heading back toward the 4.79 resistance.
🧩 If 4.79 is broken, the next bullish leg in dominance may begin. A drop back below 4.70 would bring the dominance back into its previous range and could lead to further downside toward 4.49.
❌ Disclaimer ❌
Trading futures is highly risky and dangerous. If you're not an expert, these triggers may not be suitable for you. You should first learn risk and capital management. You can also use the educational content from this channel.
Finally, these triggers reflect my personal opinions on price action, and the market may move completely against this analysis. So, do your own research before opening any position.
