💡Don't miss the great buy opportunity in USDTRYTrading suggestion:
". There is a possibility of temporary retracement to the suggested support line (7.00000).
. if so, traders can set orders based on Price Action and expect to reach short-term targets."
Technical analysis:
. USDTRY is in a range bound and the beginning of uptrend is expected.
. The price is above the 21-Day WEMA which acts as a dynamic support.
. The RSI is at 54.
Take Profits:
TP1= @ 7.26750
TP2= @ 7.50000
TP3= @ 7.77550
TP4= @ 8.04150
TP5= @ 8.57500
SL= Break below S2
❤️ If you find this helpful and want more FREE forecasts in TradingView
. . . . . Please show your support back,
. . . . . . . . Hit the 👍 LIKE button,
. . . . . . . . . . Drop some feedback below in the comment!
❤️ Your Support is very much 🙏 appreciated!❤️
💎 Want us to help you become a better Forex trader?
Now, It's your turn!
Be sure to leave a comment let us know how you see this opportunity and forecast.
Trade well, ❤️
ForecastCity English Support Team ❤️
USDTRY

USDTRYHello everyone, if you like the idea, do not forget to support with a like and follow.
DISCLAIMER
________________
Forex trading and trading in other leveraged products involve a significant level of risk and are not suitable for all investors.

USD/ARS: up nearly 9000% since the 1990s... Hi traders!
In this video I look at:
- updates on my development as a trader;
- looking at exotic pairs;
- comparing various exotic pairs (USD/ARS, USD/TRY, USD/MXN) to the S&P500 and US Dollar Index (DXY);
- conclusions.
Take care!
Thanks for watching, I love you all.
Francesco

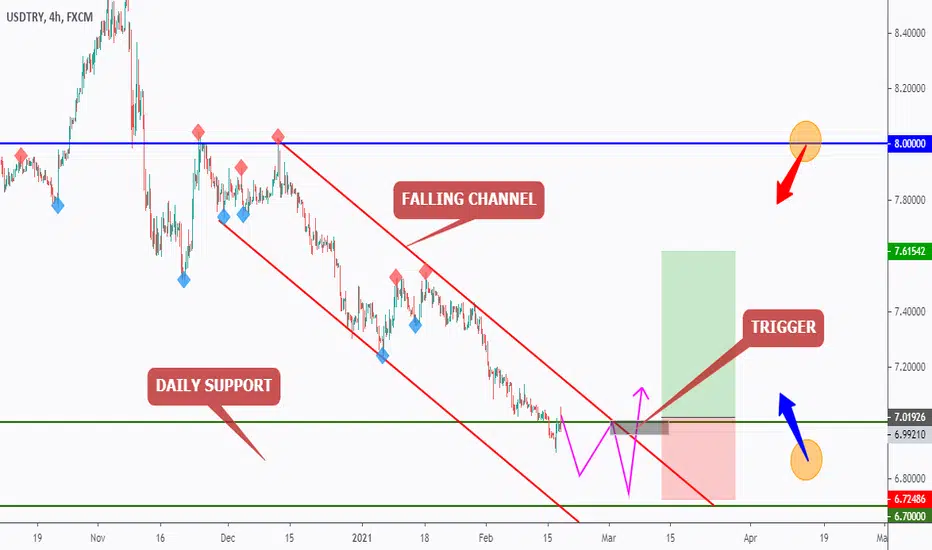
USDTRY - Buy Setup Forming!Hello everyone, if you like the idea, do not forget to support with a like and follow.
USDTRY is approaching strong support in green from Daily so we will be looking for buy setups on lower timeframes.
on H4: USDTRY is forming a channel pattern in red but it is not valid yet so we will be waiting for a third swing high to form around our upper red trendline to consider it our trigger swing. (projection in purple)
Trigger => Waiting for that swing to form and then buy after a momentum candle close above it (gray zone)
Until the buy is activated, USDTRY would be overall bearish and can still dive inside the green support or even break it downward.
And of course, as USDTRY approaches our upper blue resistance / round number 8.00, we will be looking for sell setups.
Good luck!
~Rich
USDTRY correction may continue.USDTRY correction may continue. It can be seen from the analysis that the Turkish lira built a symmetrical wave sequence on an orange wave axis. In the event that this rule system continues, we can see further declining movement up to the level of 6.76306 usd. Then I expect an increase from this level. Target price 7.20322 usd

USDTRY SHORTDAILY CHART W/ SUPDEM & PARALLEL CHANNEL FORMATION
If you find my analysis useful, you can support it by liking and commenting.


#USDTRY USDTRY is now below 7.0 level and in final stages of an extended 5th wave, but there's still room down to 6.75 level. However, keep in mind that bounce and recovery may occur anytime soon, but only if we se decisive break back above channel resistance line and 7.23 region would confirm the bottom.

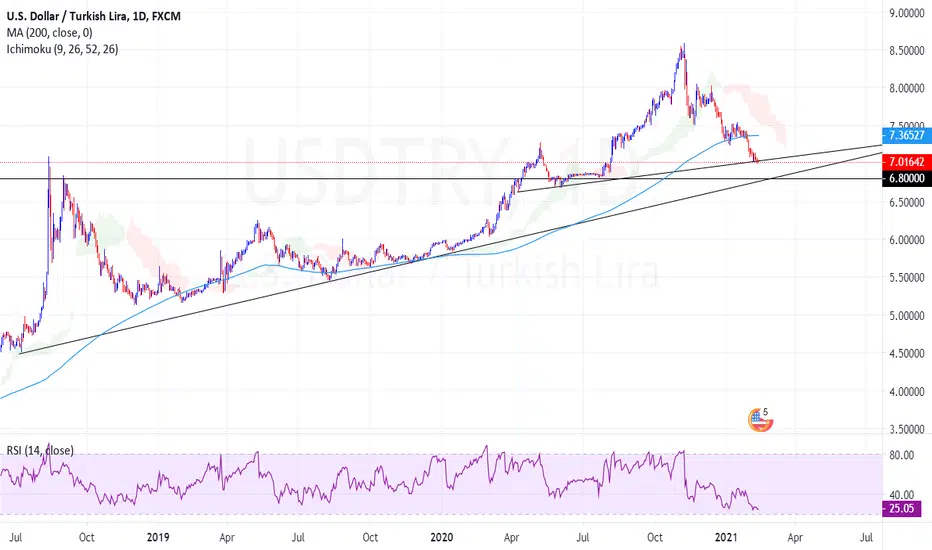
FALLING WEDGEThe price is below 250D MA
6,99 is 300D MA, This pair has never been able to break 300 MA
7 is a very strong psychological support
Trade at your own risk!

USDTRY on a minor retracement 🦐USDTRY on the 4h chart, reached the support structure.
The market which is moving inside a descending channel is now testing the upper one.
IF the market will break above we can expect a test of the resistance zone.
–––––
Follow the Shrimp 🦐
Keep in mind.
🟣 Purple structure -> Monthly structure.
🔴 Red structure -> Weekly structure.
🔵 Blue structure -> Daily structure.
🟡 Yellow structure -> 4h structure.
⚫️ Black structure -> <4h structure.
Here is the Plancton0618 technical analysis , please comment below if you have any question.
The ENTRY in the market will be taken only if the condition of the Plancton0618 strategy will trigger.


USDTRY will Skyrocket soonjust wait until Turkish Central Bank do sth stupid or Erdogan open his mount.... 6.85 is amazing place to open position with leverage...

USD/TRY longHi everyone! My long-term idea published last year now completely was implemented (in the connected ideas). The price reached the support defined early. Now I expect correction with the first purpose to level 7.38. SL = 6.89. USD/TRY on technical indicators it is completely ready for this purpose. Besides the price almost approached the lower bound of the channel.
Information provided is only educational and should not be used to take action in the market.

Reaction Time For USD TRYHey guys as you know we told correction time for usd/try now price is coming our reaction here I think we can see up movement her

Price Rate Of Change Indicator (ROC)Signals:
In an uptrend look for the indicator reversal points below zero to go long.
In a downtrend look for the indicator reversal points above zero to go long.
Trend identification:
A rising ROC typically shows uptrend and crossing above zero line confirms the uptrend.
A falling ROC typically shows downtrend and crossing below zero line confirms the downtrend.

USDTRY: 1D, LONG!Lira is the best performing EM currency against US dollar at the moment. Not a surprising move after unorthodox monetary policy by CBRT. However I do think we are pretty close to a rebound from here. AB=CD move and daily demand zone area crossing, this is where I will be looking for bullish price action.


GAME STOP HALKBANK $HALKB #HALKB Ipo price was %1000 more in 2008 ..
this GAME MUST STOP..
American BANKERS Wallstreet bankers shorted this stock to zero....
Lost %93 of value....
%1000 first ipo value
%1600 second ipo value.
%1600 gain can be... but must made by FREE PEOPLE...
Rise against wallstreet

USDTRY USD TURKISH LIRA - BULLISH DIVERGENCE ON Daily ChartUSDTRY USD TURKISH LIRA - BULLISH DIVERGENCE ON Daily Chart
