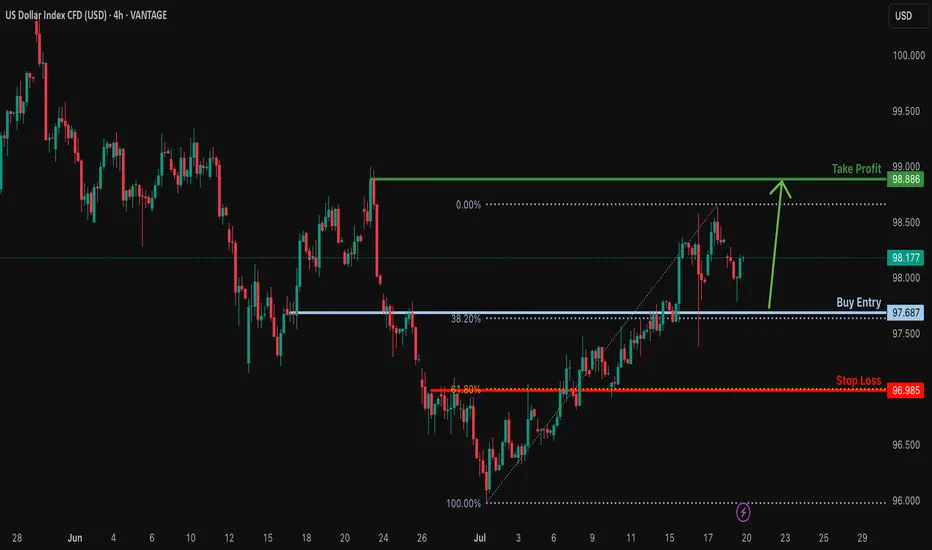
Bullish continuation for the Dollar?The price is falling towards the support level which is a pullback support that lines up with the 38.2% Fibonacci retracement and could bounce from this level to our take profit.
Entry: 97.68
Why we like it:
There is a pullback support that aligns with the 38.6% Fibonacci retracement.
Stop loss: 96.98
Why we lik eit:
There is an overlap support that aligns with the 61.8% Fibonacci retracement.
Take profit: 98.88
Why we like it:
There is a pullback resistance.
Enjoying your TradingView experience? Review us!
Please be advised that the information presented on TradingView is provided to Vantage (‘Vantage Global Limited’, ‘we’) by a third-party provider (‘Everest Fortune Group’). Please be reminded that you are solely responsible for the trading decisions on your account. There is a very high degree of risk involved in trading. Any information and/or content is intended entirely for research, educational and informational purposes only and does not constitute investment or consultation advice or investment strategy. The information is not tailored to the investment needs of any specific person and therefore does not involve a consideration of any of the investment objectives, financial situation or needs of any viewer that may receive it. Kindly also note that past performance is not a reliable indicator of future results. Actual results may differ materially from those anticipated in forward-looking or past performance statements. We assume no liability as to the accuracy or completeness of any of the information and/or content provided herein and the Company cannot be held responsible for any omission, mistake nor for any loss or damage including without limitation to any loss of profit which may arise from reliance on any information supplied by Everest Fortune Group.
Usdx
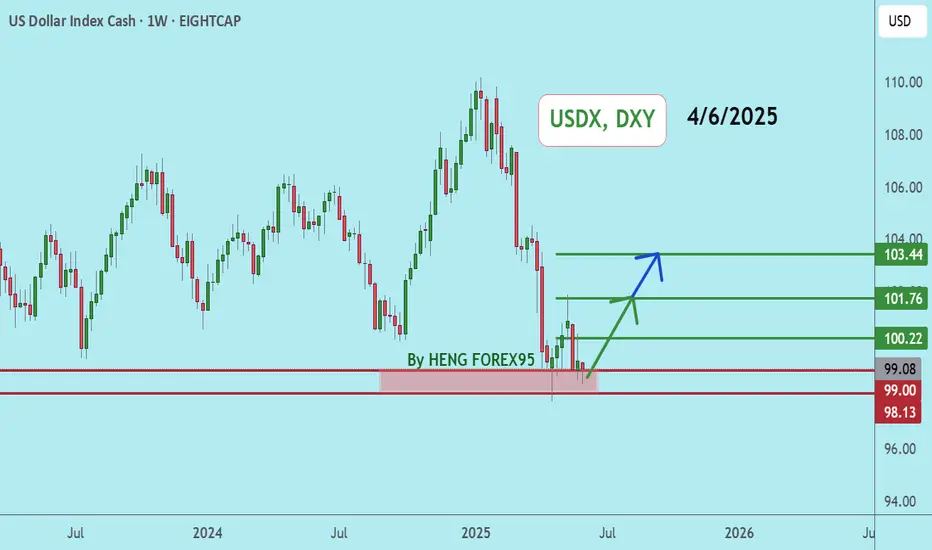
DXYDXY price has come down to test the important support zone 96-95. If the price cannot break through the 95 level, it is expected that the price will rebound. Consider buying the red zone.
🔥Trading futures, forex, CFDs and stocks carries a risk of loss.
Please consider carefully whether such trading is suitable for you.
>>GooD Luck 😊
❤️ Like and subscribe to never miss a new idea!

USD Roadmap: Bullish Recovery or Structural Breakdown?TVC:DXY CAPITALCOM:DXY
🟢 Scenario A – Bullish Rebound (Red Arrow Up):
Price bounces from the lower channel and breaks toward:
107.348, 110.176, or even 111.901 resistance area.
If the dollar is supported by China buying USD, hawkish Fed, or geopolitical tensions, this scenario gains weight.
🔸 Resistance: Blue downward-sloping line (possible trendline resistance or lower high area)
🔸 Risk: Price could form a lower high and then reverse.
🔴 Scenario B – Bearish Breakdown (Red Arrow Down):
If the USD fails to break above resistance (around 107–112) and gets rejected…
Then we see a move back down, possibly breaking the long-term channel, aiming for the lower diagonal support zone or even sub-92.
🔸 This would signal a major shift in USD strength, possibly driven by:
Fed rate cuts
Global de-dollarization
China not supporting USD
Stronger EUR or CNY

DXYDXY price is near the support zone 98.74-97.87. If the price cannot break through the 97.87 level, it is expected that the price will rebound. Consider buying the red zone.
🔥Trading futures, forex, CFDs and stocks carries a risk of loss.
Please consider carefully whether such trading is suitable for you.
>>GooD Luck 😊
❤️ Like and subscribe to never miss a new idea!
Dollar Bounce to 103 Incoming or Straight to 96?Will the Dollar Keep Tumbling, or Are We About to Bounce Back to 103 in May?
Checking out the monthly charts, April finally delivered a close under that critical 100 level, breaking a floor that held firm for years:
Zooming into the weekly chart, we’ve retraced back to test the 100 level from below. It’s now acting as resistance—so, is another big drop coming?
Long term, my bias is clear: the dollar looks set to keep sliding lower after breaking the crucial 100 mark. But if we flip to the daily charts, we can clearly see signs of a short-term bounce brewing. It looks like price might want to squeeze back inside the range, aiming for that juicy sell zone around the 103 mark—the very origin of the leg down that initially broke 100:
This 103 area is a prime spot for short-term bulls, and an even better opportunity to start loading up on shorts for a move down towards the Monthly buy zone around 96.
Personally, I won’t trade USDX directly to the upside—I'll instead use this analysis to play setups on pairs like EURUSD and AUDUSD, as they're approaching key resistance areas right now.
My game plan: wait patiently for price to reach around 103, then start hunting for sell signals. But first, we’ll need a solid daily close back above 100, something I think we could see happen this week.
Don’t forget—we’ve got the Fed’s interest rate decision coming up, which might trigger some volatility. We could easily rally up to 103 ahead of the decision and then see a sell-off afterward. Of course, if the Fed throws us a curveball, the dollar might never get back above 100, and just continue dropping straight away.
Right now, the 100 level is crucial—so watch closely.
What’s your take? Drop your thoughts below! 😊

USDX,DXYUSDX price is near the important support zone 98.23-97.75. If the price cannot break through the 97.75 level, it is expected that in the short term there is a chance that the price will rebound.
**Very Risky Trade
🔥Trading futures, forex, CFDs and stocks carries a risk of loss.
Please consider carefully whether such trading is suitable for you.
>>GooD Luck 😊
❤️ Like and subscribe to never miss a new idea!

USDX in danger ! Usdx or Dxy or Us dollars index in dangrous position .. it needs to reverse soon.
Im not sure what is the impact of further decline but seriously it will be harmfull . !
I forcast the positive vision .. otherwise ....!!!!!!
DXY The Fake Dance- One of the most important barometers for global currencies and markets in the world.
- Most of the time DXY is a well used machine to supress markets (forex, stocks, cryptos, etc..)
- When they don't start the printing machine, DXY keeps is strength.
- When they start to print DXY starts to dip and markets boom up.
- it's really basic and based on "BRRR Machine".
- i had a hard time to decrypt this fake peace of resilience.
- actually there's none visible divergences on the 1M or 3M Timeframes.
- So i decided to push my analysis to 6M Timeframe and noticed few things :
- You can notice that from 2008 ( Post crises ), DXY was in a perma bullish trend.
- So now check MACD and will notice this fake move on January 2021 ( in graph the red ? )
- MACD was about to cross down, columns smaller and smaller, then a Pump from nowhere lol.
- i rarely saw that in my trading life on a 6M Timeframe.
- So to understand more this trend, i used ADX (Average Directional Index)
- ADX is used to determine when the price is trending strongly.
- In many cases, it is the ultimate trend indicator.
- So if you look well ADX columns, you will notice that a strong divergence is on the way.
- First check the Yellow Doted Line in July 2022 when DXY reached 115ish and look the size of the green columns.
- Now check today (red doted Line), and look again the ADX green columns is higher, but DXY diped to 105ish.
- So like always, i can be wrong, but i bet on a fast DXY dip soon or later.
- it's possible to fake pumps, but it's harder to fake traders.
Happy Tr4Ding !

Global Market Overview. Part 1: USDXThe Dollar Index is drifting at the key 99.5 mark. This strategic support level, which has held since early 2024, is on the verge of collapsing.
Let’s be clear: this isn’t just about the strength of the dollar. What’s at stake is the monetary sovereignty of the United States, caught between inflation, politics, and election-season hysteria.
And make no mistake — this has nothing to do with technical analysis. What we’re witnessing is a fundamental fire, and Donald Trump and his administration are fanning the flames.
Powell: “Rates remain unchanged.” But for how long?
Just days ago, Fed Chair Jerome Powell delivered what seemed to be a firm message:
“We are in a wait-and-see mode. Cutting rates prematurely could do harm.”
“If inflation accelerates, more difficult decisions may follow.”
On the surface — classic hawkish rhetoric. But in reality, this isn’t resolve.
It’s a delay tactic. Even Powell admits:
“The labor market is walking a fine line.”
“Economic growth weakened in Q1.”
“Business sentiment is deteriorating.”
“Tariff policy could lead to stagflation.”
“Political pressure is mounting by the week.”
The Fed says, “It’s too early to cut rates.”
But the market hears something entirely different: “We’re getting close.”
Trump applies pressure
Ahead of the elections, Trump declares:
“If we don’t cut rates now, we’ll lose to China, Europe, and our own markets.”
This isn’t just campaign rhetoric. It’s an open challenge to the Fed’s independence.
And history already tells us what happens when Trump applies pressure — 2019 rate cuts proved he can break through Powell’s defenses.
What the charts are saying
The Dollar Index (USDX) is locked in a persistent downward channel.
The 103.0 support zone has been broken
The 101.17 level remains the final significant support
99.5 is already being tested as a potential sell-off trigger
Below that — only air until 98.0 and 97.5
The technical setup confirms a fundamental truth:
The market no longer believes in the dollar’s strength.
What if the Fed actually cuts rates?
If the Fed moves to cut, USDX will break below 99 and enter a systemic phase of weakening.
Capital will flow into gold (as if it hasn’t already gone far enough), oil, crypto, and high-yield emerging markets.
The United States will lose its competitive edge in monetary policy,
and the dollar will slowly cease to function as the global anchor it once was.
Powell can talk tough all he wants. The market is no longer listening.
The Dollar Index isn’t dropping because rates are already cut — it’s falling because everyone knows it’s just a matter of time.
U.S. monetary policy has lost the initiative, and market expectations have taken over.
Today, the Fed rate is no longer a tool of control. It’s a signal of approaching capitulation.
The question is no longer “Can we hold 99.5?”
The real question is: “What happens after it breaks?”
Manipulation or strategy? Black swans on a leash
Powell’s rate policy, DXY charts, inflation forecasts — all of it loses clarity when the dominant market force is no longer economics, but politics.
We live in an era where markets break not from bad data, but from tweets, briefings, and backroom deals — moves that only reveal themselves in the charts after the fact.
That’s what makes the current cycle the most toxic in the last 15 years.
Markets aren’t just volatile — they’ve become irrational.
Trade war: scalpel in a surgeon’s hand or a bat in a brawler’s grip?
Tariffs aren’t new.
But in Trump’s hands, they’ve evolved — from macroeconomic tools to blunt political weapons.
He uses them as battering rams — to force concessions, corner opponents, and set up ideal conditions for insider gains.
The market reacts exactly as you’d expect:
Tariffs announced — indexes fall
Panic ensues — capital flees into dollars and gold
Within 48 hours — videos surface of Trump and his allies joking about the “hundreds of billions” they made during the crash
This isn’t conspiracy.
It’s already triggered official investigations, but everyone knows: the odds of accountability are near zero.
And that’s the biggest risk for fundamental analysis today:
It’s powerless against narratives crafted behind closed doors.
So who’s really running the market?
Trump is deliberately deflating the bubble. Loudly. Dramatically. On camera.
But the goal isn’t destruction. It’s control.
And while Powell fears making a mistake, Trump fears only one thing — losing control of the narrative.
The market is no longer a field for rational actors.
It has become a battlefield, where officials already understand:
You can control more than just money through the market — you can shape public consciousness.
How not to lose your footing in this chaos?
We’ll break it down in the next part of the Global Market Overview. Stay tuned.

Bearish reversal?USDX is rising towards the resistance level which is a pullback resistance that aligns with the 78.6% Fibonacci retracement and could reverse from this level to our take profit.
Entry: 103.43
Why we like it:
There is a pullback resistance level that aligns with the 78.6% Fibonacci retracement.
Stop loss: 104.13
Why we like it:
There is a pullback resistance level.
Take profit: 102.30
Why we like it:
There is a pullback support level.
Enjoying your TradingView experience? Review us!
Please be advised that the information presented on TradingView is provided to Vantage (‘Vantage Global Limited’, ‘we’) by a third-party provider (‘Everest Fortune Group’). Please be reminded that you are solely responsible for the trading decisions on your account. There is a very high degree of risk involved in trading. Any information and/or content is intended entirely for research, educational and informational purposes only and does not constitute investment or consultation advice or investment strategy. The information is not tailored to the investment needs of any specific person and therefore does not involve a consideration of any of the investment objectives, financial situation or needs of any viewer that may receive it. Kindly also note that past performance is not a reliable indicator of future results. Actual results may differ materially from those anticipated in forward-looking or past performance statements. We assume no liability as to the accuracy or completeness of any of the information and/or content provided herein and the Company cannot be held responsible for any omission, mistake nor for any loss or damage including without limitation to any loss of profit which may arise from reliance on any information supplied by Everest Fortune Group.

DXY (Dollar Index) and Pamp/Dump BTC. Markets Cycles.USA Dollar Index + Bitcoin Pamp/Dump Cycles. Logarithm. Time frame 1 week. Minima and maxima of bitcoin secondary trends are shown. Everything is detailed and shown, including what everyone always wants to know. Cyclicality. Accuracy.
This is what it looks like on a line chart to illustrate simple things.

USDX, DXYUSDX price is approaching the support zone of 106.45-105.36. If the price fails to break through the main support zone of 105.36, it is expected that there is a chance that the price will rebound. On the contrary, if the price can break through the level of 105.36, it will have a negative impact on the dollar.
🔥Trading futures, forex, CFDs and stocks carries a risk of loss.
Please consider carefully whether such trading is suitable for you.
>>GooD Luck 😊
❤️ Like and subscribe to never miss a new idea!

#USDX 4HUSDX (4H Timeframe) Analysis
Market Structure:
The price is forming a flag pattern, which is generally considered a continuation signal. This indicates that the market is in a consolidation phase after a strong move, and a breakout could lead to further bullish momentum.
Forecast:
A buy opportunity may arise if the price breaks above the upper trendline of the flag pattern, confirming bullish strength.
Key Levels to Watch:
- Entry Zone: A buy position can be considered after a breakout above the flag pattern with strong volume.
- Risk Management:
- Stop Loss: Placed below the recent low to manage risk.
- Take Profit: Target the next key resistance levels based on previous price action.
Market Sentiment:
The flag pattern suggests that the market is pausing before continuing its upward move. Waiting for a confirmed breakout will help align with the prevailing trend and avoid false signals.

The weekly chart that indicates the $ will rally all of 2025
The weekly chart will tell us how things will probably playout in the months ahead.
The double bottom has much further to run.
In the immediate time-zone on a daily the dollar price is at the bottom of a triangle that it wants to have some more room.
I expect the dollar will continue its climb this week.

USDX, DXYUSDX is in an uptrend. The price has tested the 110.16 resistance and failed to break through. It is believed that in the short term there may be a correction. If the price can still stand above 107.41, it is expected that the price will continue to rise. Consider buying in the red zone.
🔥Trading futures, forex, CFDs and stocks carries a risk of loss.
Please consider carefully whether such trading is suitable for you.
>>GooD Luck 😊
❤️ Like and subscribe to never miss a new idea!

USDX, DXYUSDX price is in a correction phase. Currently, the price is near the support zone of 105.61-104.70. If the price cannot break through the 104.70 level, it is expected that there is a chance that the price will rebound. Consider buying the red zone.
🔥Trading futures, forex, CFDs and stocks carries a risk of loss.
Please consider carefully whether such trading is suitable for you.
>>GooD Luck 😊
❤️ Like and subscribe to never miss a new idea!

USDX "Dollar Index" Bullish Heist PlanHello! My Dear Robbers / Money Makers & Losers, 🤑 💰
This is our master plan to Heist USDX "Dollar Index" Market based on Thief Trading style Technical Analysis.. kindly please follow the plan I have mentioned in the chart focus on Long entry. Our target is Red Zone that is High risk Dangerous level, market is overbought / Consolidation / Trend Reversal / Trap at the level Bearish Robbers / Traders gain the strength. Be safe and be careful and Be rich.
Entry 📈 : Can be taken Anywhere, What I suggest you to Place Buy Limit Orders in 15mins Timeframe Recent / Nearest Low Point take entry should be in pullback.
Stop Loss 🛑 : Recent Swing Low using 4H timeframe
Target 🎯 : 107.500
Attention for Scalpers : Focus to scalp only on Long side, If you've got a lot of money you can get out right away otherwise you can join with a swing trade robbers and continue the heist plan, Use Trailing SL to protect our money 💰.
Warning : Fundamental Analysis news 📰 🗞️ comes against our robbery plan. our plan will be ruined smash the Stop Loss 🚫🚏. Don't Enter the market at the news update.
Loot and escape on the target 🎯 Swing Traders Plz Book the partial sum of money and wait for next breakout of dynamic level / Order block, Once it is cleared we can continue our heist plan to next new target.
💖Support our Robbery plan we can easily make money & take money 💰💵 Follow, Like & Share with your friends and Lovers. Make our Robbery Team Very Strong Join Ur hands with US. Loot Everything in this market everyday make money easily with Thief Trading Style.
Stay tuned with me and see you again with another Heist Plan..... 🫂

USDX is up 0.26% 4 the $ in support. But D-Tops Intraday.
That is the 4HR chart of the USDX. It's in a massive rising wedge still on many timeframes but it also is caught up in a Top2 on timeframes right up to the 4HR.
This does not mean 100% that the $ will fall and it does not mean the USDX will fall. But on the law of averages, they normally drop some more from those levels and this appears to be an MTOP down below which if breached then certainly the dollar could really come-off a bit.
Gold and Silver known for retraces prior to important economic news, well they got a bounce after the non-farm payroll bearish figure was not supportive of the dollar.
Trades coming up in Gold. Hopefully Longs.

Why I was surprised some called for a cooling/correction of USD$
Daily & Weekly Below
Late last week and earlier this week, some traders & price predictors were giving their big 'scoop' about the Dollar correcting going into the start of this week. I didn't really buy it and here is why.
I knew that there was no real recent resistance for USDX at these current levels. In fact, absolutely nothing for 12 months.
I could also see that by late last week the Dollar had simply pulled back from its recent high at around 107.03 and yes even got over a whole number before pulling back and closing a little lower on 14 November. By last Friday 1 week ago the USDX (dollar index) was a mere 0.3% below 107.03. Also, look at the combined volume for last week and for that matter this week. Why and how would any instrument recede in price after all that weekly volume?
Whenever, I make a call on the USDX, I am acutely aware of its wide influencing price behaviour on currency pairs, gold price and even Crypto and other commodities.
Making calls on the dollar should be reserved for those who properly pull the chart apart and study the price-action with leading-indicators, not some sort of on the run call like "the dollar looks like selling, its a bit overbought". Theres no such thing as over bought when an instrument is rallying.
I said the USD was BREAKING OUT back when it was around 100 prior to Gold's breakout. I had concerns over RSI Monthly Oversold levels and I could see historically when this had happened to the Dollar (on a USDX chart with monthly RSI levels plotted) that this occurrence had preceded a major breakout in the USD$. Multiple times at different periods going back only several years.
Perhaps, next time give us your reasons why the USD is correcting and taking a break, that we can see how sound your technical analysis trading methods might be.
Don't do something for example Bloomberg recommends in a headline, I am not picking on Bloomberg but the entire trading news, who really don't have a clue and are chase headlines.

USDX,DXYUSDX price is near the important support zone 100.68 - 99.89. If the price cannot break through the 99.89 level, it is expected that the price will rebound. Consider buying the red zone.
🔥Trading futures, forex, CFDs and stocks carries a risk of loss.
Please consider carefully whether such trading is suitable for you.
>>GooD Luck 😊
❤️ Like and subscribe to never miss a new idea!

Will the US Dollar Index Collapse Below 100? Or Back To 105?The big day has arrived: the first Fed rate cut. The burning question is, will it be 0.25% or 0.5%?
In recent days, the markets have been leaning toward a 0.50% cut. Could this be the catalyst for a breakdown below the critical 100 level in the USDX? Let’s break down the charts and find out.
Looking at the weekly charts, the 100 level has been a solid support zone for several years, briefly dipping below last year in what turned out to be a false breakout within the 100 - 107 range.
I’ve highlighted some key levels on the charts: last year’s low at 99.47, and just below that, the 0.99 mark, which is a key Monthly 0.618% fib level and a strong former resistance turned support (see image below).
Below this level is a significant BUY zone, where the massive 2022 rally began, breaking through 100 and eventually driving the price up to nearly 115.
Considering these key areas, I do suspect we may see a breakdown through the 100 level, but it will likely be met with strong buying pressure at the areas mentioned. This is why, for now, I’m leaning toward the upside for the US dollar.
Zooming into the daily charts, an M pattern is forming at this key support, suggesting that price is gearing up to break through the 100 level.
Additionally, there’s a divergence emerging on the MACD, indicating that although a break below 100 might occur, it could be short-lived. This is why we should be looking for buy setups as the price dips under this level.
Zooming in further to the 6-hour charts, we can see the divergence even more clearly, with the MACD on the verge of a crossover to the upside.
With all of this in mind, a whipsaw move could be on the cards today after the rate decision. I’ll be turning on my TRFX indicator and watching for buy setups on dips under 100 and toward 0.99.
Although the USDX may weaken in the longer term, I fully expect a strong reaction at the levels mentioned, with the price likely to run back up toward the 103-104 area before selling off again.
Let me know your thoughts in the comments below!

The 4HR USDX W-Bottom Rocketing USD - Today!
I know it reads like a headline in a newspaper trying to sell the Sunday paper, but that is really not me. But I am also not the kind of person who finds keeping a good secret - a secret.
We are all here on Tradingview to watch each other's backs in a risk management and learning experience kind of way, in relation to being a consistent and profitable trader.
A couple of things to be aware of today in your Friday-trading. I am quite convinced that the USDX will be propelled upwards & finally through 101.85 causing a sustained breakout in the dollar over the next several days to a week.
I see this occurring right before, at the open or within in an hour or 2 of the NY market session today. What reason(s) do I have to be propagating this type of fear and panic into Traders today. I will tell you right below!
The 4HR W/Bottom is now properly formed. Well the finishing touches are being made to the right-side of the W as I write, which will give the dollar plenty of relative strength. Helping that cause? Well of course that would be the momentum -oscillators RSI & Stochastic's on the higher timeframes.
I watch these a lot in my own trading because they warn me about supply/demand levels especially when commodities, currency's, stocks, metals etc, enter their overbought and oversold zones - for example the USD has been beaten down the past month or so and it's now oversold, but when something is oversold, provided that it's a commodity, currency or thing that people want and demand again, it's oversold state becomes one with increasing buyer demand at cheaper prices - then boom - breakout.
I will be watching closely the Vix Index as well. I see it possibly breaking higher than 15% today and as for Gold - well after yesterday's shot-in-the-arm, I for one will be Shorting it back to 2430 to 2450 levels.
Finally, take a look at the following current 4HR USDX chart. What I see occurring with the Oscillators' is that the RSI / Stochastic's on the 1HR, 2HR, 4HR Daily & Weekly Charts, will cross-up out of their oversold condition's concurrently and simultaneously, igniting the USDX off it's W-Bottom and smashing through 101.85 without so much as the blink of an eye.
Maybe I am a looney you are thinking? Yes, but a looney who capitalises ahead of time.

USDX, DXYUSDX price is near the support zone 101.18-99.89. If the price cannot break through the 99.89 level, it is expected that the price will rebound. Consider buying the red zone.
🔥Trading futures, forex, CFDs and stocks carries a risk of loss.
Please consider carefully whether such trading is suitable for you.
>>GooD Luck 😊
❤️ Like and subscribe to never miss a new idea!
