USDZAR USDZAR BUY
It reject a daily support.
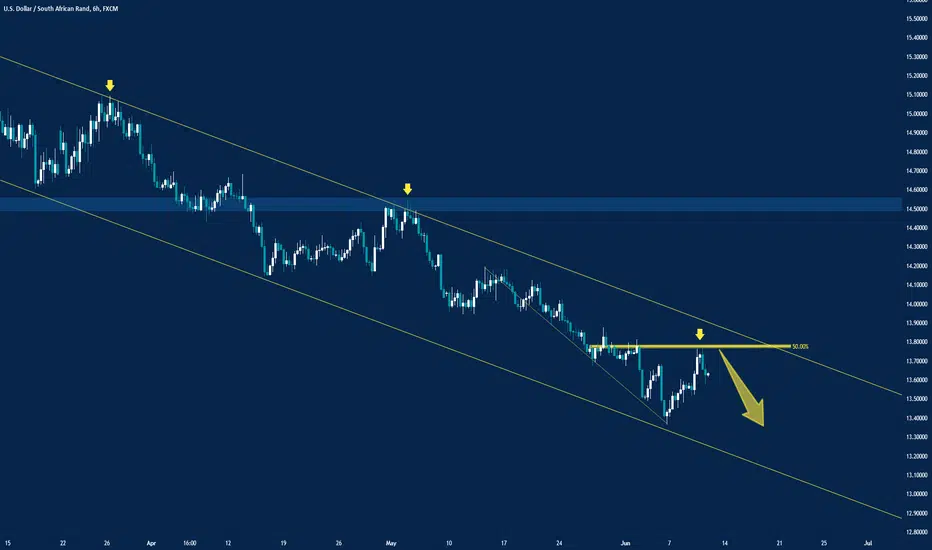
in 4h i am expecting a continuation to the upside.
Already in the trade
USDZAR


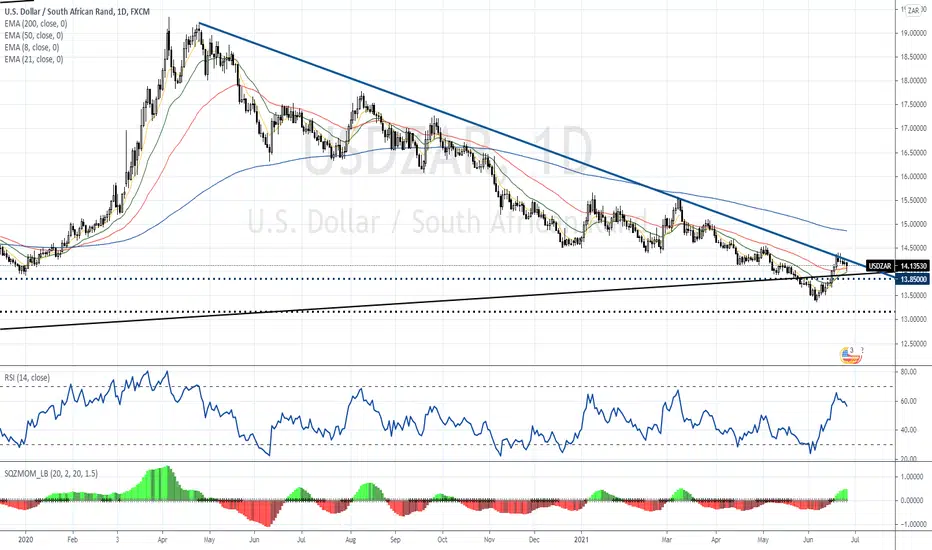
ZAR strength not necessarily overMedium-term bullish trend still seems to be intact for the USDZAR, after its recent weaknesses (strength in the US Dollar). It currently finds itself back at the 50-day Moving Average (EMA), with a break and close below R14.07, bringing back the strong support level at R13.95. This is a strong support level, with a break lower, most probably bringing back R13.50 (short-term target). Should we however see further weakness, with a break above the bullish trendline at R14.30, could see the USDZAR only find resistance again at the 200-day EMA at R14.86. For now, I still believe that the Rand is in oversold territory, which is confirmed by its 14-day RSI.
USDZAR (Dollar-Range) Faces Big Picture TechnicalsThough much of the attention in the FX market automatically goes to the majors, there are some remarkable technical pictures among the Dollar-based EM pairs. In particular, I am impressed by the pattern shaped by USDZAR through the past year.
The post-pandemic recovery trendline resistance is still guiding the exchange rate lower, but we are starting to come upon far more significant support levels founded on years of price action. A break in either direction would likely require a significant escalation in conviction beyond the casual drift we have seen these past months.
If risk appetite continues to rise, the 3.50% benchmark yield on the Rand could draw more appeal, but the forecast for this rate's path is not particularly encouraging. So, while a haven bid would certainly benefit the Greenback, even comparative yield forecasting could benefit a USDZAR bullish view. Overall, the easier technical move would be to clear resistance in the trendline and 100-day moving average.

USDZAR (4hr) updateusdzar looks very bearish, a bearish close on the 4hr timeframe will see usdzar going down to 13.81 zone.

USDZAR Looks Strong Bullish We have seen USDZAR price was falling like Skyfall the last couple of weeks, and all the Bear was enjoying the fall, but now it's Bull time. If you closely see the USDZAR daily time frame, it's already breakout the downtrend channel and creates a good reversal umbrella pattern. Right now, it consolidates the support level, which is good for me for further up. We are expecting to see the price once again 15.20000.

USDZARUSDZAR- Confluences are lining up on this pair. The overall trend is bearish. Price pulled up for a retest of our level with trendline. The current daily candle is forming a pin bar rejection. Wait patiently for the daily candle to close, if the daily closed as a pin bar, i will lower to smaller TF for my entry

USDZAR impulse waveIt seems as if the USD/ZAR has completed a 5-wave impulse. The MACD is also working into a huge wedge which highlights the maturing rand bull. Possibly time for a correction towards the dotted green neckline if the pair breaks out of its current downward channel. Technical indicators are leaning to more rand losses this week but the dollar's movement will be dictated by the Fed this week.


USDZAR Rand might suffer for the next coming months, be on the look out for it as the president is going to put measures in place to control covid cases, this might affect the rand negatively long term hence the US economy is recovering slowly but surely.

USDZAR - Bullish dollar coming up!Get your pending orders ready as we about to shoot up.
I'll continue to update this trade.
- On the smaller time frames, we've touched a crucial support level.
- Inverse H&S PATTERN indicating bullish momentum.

IS USDZAR READY FOR BRERAKOUT? Would love to see a nice breakout, with usd strength chiming in the market.
#BLESSEDPIPS

USD/ZAR: FUNDAMENTAL FORECAST | PRICE ACTION | SHORT SCENARIO 🔔The South African Current Account for the first quarter is predicted at ZAR182.1B, and the Current Account Percentage of GDP at 3.55%. Forex traders can compare this to the South African Current Account for the fourth quarter, reported at ZAR197.7B, and to the Current Account Percentage of GDP at 3.70%. South African Mining Production for April is predicted to increase by 105.0% monthly. Forex traders can compare this to South African Mining Production for March, which increased by 21.3%.
US Initial Jobless Claims for the week of June 5th are predicted at 370K, and US Continuing Claims for the week of May 29th are predicted at 3,602K. Forex traders can compare this to US Initial Jobless Claims for the week of May 29th, reported at 385K, and to US Continuing Claims for the week of May 22nd, reported at 3,771K. The US CPI for May is predicted to increase by 0.4% monthly and by 4.7% annualized. Forex traders can compare this to the US CPI for April, which increased by 0.8% monthly and by 4.2% annualized. The US Core CPI for May is predicted to increase by 0.4% monthly and by 3.4% annualized. Forex traders can compare this to the US Core CPI for April, which increased by 0.9% monthly and by 3.0% annualized.
Volatility may increase after today’s CPI report out of the US and with the CCI moving higher, but the downtrend is intact.US Dollar weakness is expected to continue, but will bears take advantage of the momentum and pressure the USD/ZAR into its next horizontal support area?


USD/ZAR Elliot wave My target range for the pair remains at 13.18-13.20. If we assume that wave 5 will be equal in length to wave 3, the pair could however drop as low as 12.75...
Fundamentally, the commodity cycle looks far from over which is rand supportive as the rand is a commodity currency (particularly industrial- and precious metal prices).


USDZAR-Long#USDZAR market is moving in the bearish channel and after hitting strong support it is going to buy up to TP2.

South African Rand Follows ThroughThe Financial Post had the following to say to try to explain the fresh strength in the South African rand (USD/ZAR):
"With the local economy remaining weak and facing power cuts, the rand’s recent rally has been mainly on the back of global factors, including higher commodity prices which benefit resource-rich South Africa and expectations U.S. lending rates will stay lower for longer."
This explanation falls well short of the longer-range dynamics benefiting the rand on this foollow-through move for a longer USD/ZAR downtrend. Commodity prices are soaring, and South Africa is a direct beneficiary. More importantly, the South African central bank expressed great confidence in the economy in mid-April. I posted the following at the time including key economic charts:
South African Rand Boosted By Central Bank Confidence
Last November, the South African rand (USD/ZAR) finished reversing its pandemic related losses against the U.S. dollar. Along the way I pointed out the benefits of getting long the South African rand. This week, USD/ZAR dropped to levels last seen in January, 2020. The rand looks to strengthen further based on the confidence expressed by South Africa’s Reserve Bank Governor Lesetja Kganyago in a recent Reuters interview.
In the interview, Kganyago expressed confidence that investors will remain interested in buying high-yielding South African bonds even as monetary policies start to normalize (higher rates) around the globe. Moreover, South Africa enjoys a real rate advantage over other emerging market countries given South Africa’s success in containing inflation. Higher bond yields attract capital inflows and boost the domestic currency.
The following quote convinced me of Kganyago’s determination to contain inflation:
“High inflation perpetuates inequality..Those who are rich can buy assets to protect themselves from inflation, they can buy shares and bonds and property. But those who are earning fixed incomes, whether a salary or a government social grant … if inflation erodes it you have to wait for the next increase.”
The South African Monetary Policy Forum
The Reuters interview likely came after the Reserve Bank released its April report monetary policy (the “Monetary Policy Forum”): the commentary in the interview supported themes from the report. The report reflected Kyganyago’s confidence. For example, here are some of the Reserve Bank’s main points:
Global recovery stronger on vaccination & stimulus
Domestic recovery on track, some sectors constrained
SA inflation well-contained… balanced risks
Gradual normalization with low inflation
{The South African Reserve Bank is confident in a future of well-contained inflation.}
I was most impressed with the strength in South Africa’s terms of trade. The country’s terms of trade broke out in late 2019 and has trended sharply higher since then. The trend managed to to stay strong through the pandemic with a slowing in Q4 of 2020. This overall strength bodes well for the post-pandemic recovery in South Africa.
{The prospects for the South African economy look good with an uptrending terms of trade.}
The Trade in the South African rand
The strong terms of trade particularly support a strong currency with surging commodity prices leading the way. Combining with a high yield, the South African rand is an attractive currency trade. I missed the last round of downward pressure on USD/ZAR, but I am on alert to fade the next bounce. Ideally, I can start a new position short USD/ZAR on another test of declining resistance at the 20-day moving average (DMA) and/or the 50DMA.
Be careful out there!


USDZAR monthlyRSI indicator is currently testing major support. The rand may still pull the pair to 13.18 but the rand's run is maturing.


