USDZAR


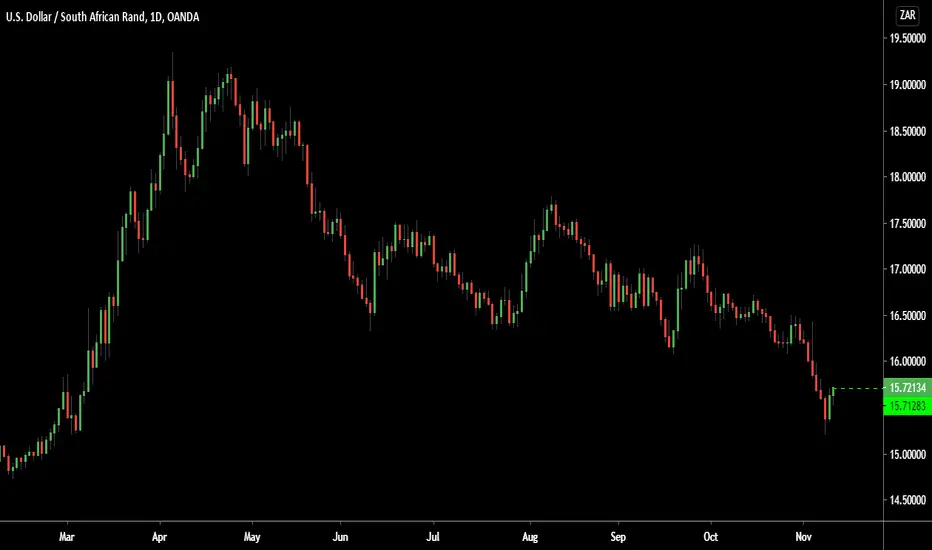
USD ZAR BUY (US DOLLAR - SOUTH AFRICAN RAND)Hi there. Price is forming a reversal pattern to change its direction.
These are the fundamental reasons for a possible USD/ZAR bullish scenario:
Sentiment shifts:
Bullish scenario:
A breakdown in US stimulus talks and a possible towards a government shutdown; FDA rejecting or postponing the approval of the Pfizer vaccine; a breakdown in Brexit talks with no deal by EU summit.
In this scenario we would expect to see downside in equities across the board, with US equities expected to fall more if we see US stimulus talks break down and more downside for EU equities if we see Brexit talks collapse and upside in the dollar across the board.
Strong equity sell offs are usually accompanied with some support for the US dollar as the world’s reserve currency and with its safe haven status as well as Japanese yen and Swiss franc .

Ke Dezemba update Old target range is at jeopardy following the break below 15.00 this week. Revised target (15.50 and 15.64). A break above 15.36 could be a signal for a turn of trend and a possible bottom-out. The MACD is still holding a buy-signal and a move towards the 50-day EMA looks likely as dollar short sellers will look to close their short positions before year-end.
There is however a possibility of a looming bear flag and a weekly close below 15.00 will see the pair fall to the major support rate of 14.84 or lower towards the trend line from 2019.
Fundamentals: Disappointing local data dampened rand buying yesterday. Mining-, gold- and manufacturing production all came back weaker, compared to the production levels from September, in October. The South African current account swelled to R297.5 billion in the third quarter, up from the second quarter’s deficit of R123.7 billion. On paper this looks like a positive print but if we dig a little deeper the current account increase was due to the 201.4% increase in exports, largely driven by vehicle, precious metals and base metal exports. Again, this is positive, but imports declined by 1.6% which concerning as it highlights the feeble local investor and consumer demand. The commodity price recovery, particularly metals and crude oil, is however supportive of further rand appreciation before year-end.

USD/ZAR ke DezembaThe pair is confined by the range of 15.10 and 15.45. I favour an upside break out of this range with the support rate of 15.08 expected to hold this month. A break above 15.45 will allow the pair to move up towards 15.61 and possibly the upper bound of the current channel. This sets a target range between of 15.93 and 16.00 for the month of Dezemba.


USDZAR 15.013700 - 0.82% SHORT * CONTINUATION PATTERNS Hey everyone
Hope you're having a great one, here's an idea on the DOLLAR ZAR, the pair has been trading in a descending channel and respecting structure with regard to price looking for continuation of this move on the pair targeting both my Fibonacci extensions.
the pair is currently trading near structure we could see some range or the formation of a descending channel or a full out retracement so watch price and keep the pair in your wacth list to catch this one.
many stars must align with the plan before executing the trade, kindly follow your rules.
LET'S SEE HOW IT GOES..
HAPPY TRADING EVERYONE & LET YOUR WINS RUN...
_________________________________________________________________________________________________________________________
ENTRY & SL - FOLLOW YOUR RULES
here's some of my rules if they help.
1. look at structure be it descending channels, pennants and so forth.
2. RSI is overbought/oversold so will be looking for a pull back to structure before continuation.
3. will be looking for entries from 30M , 1H, 2H & 4H time-frames if taking the trade long term.
4. aggressive trades can be executed on the pull back
5. price action must definitely align with the plan.'
6. structure definitely
7. the 20 EMA must be respected as support / see a bounce at this structure
8. FIBONACCI EXTENSIONS AS GUIDELINES FOR SL & TP'S .
9. CANDLE STICK PATTERNS.
so i will most like's enter this one in a bit but i hope this idea assists in any way on your trading plan.
RISK-MANAGEMENT
PERIOD - SWING TRADE
__________________________________________________________________________________________________________________________
If this idea helps with your trading plan kindly leave a like definitely appreciate it.


USD/ZAR weekly candle. The November risk currency rally is loosing some steam which has the USD/ZAR pair struggling to break the major support rate of 15.08/.09, which is on the trend line from from March 2018 and the 78.6% Fibonacci retracement level from Covid dollar rush back in February and March this year. A break below 15.08 will allow the pair to move into the support range between 14.58 and 14.84. Strong support is expected at 14.84 but continued rand momentum could see the pair drop towards the bottom of the current upward channel at 13.88 in the first or second quarter of next year.
A failed break below 15.08 could however see the pair move back towards the 16.00, the 61.8% Fibonacci retracement level. This move will however only prolong the expected move towards the support range of 14.58 and 14.84.
The MACD and Stochastic indicators are however dropping close to the their respective support levels which is an indication that a marginal retracement of the November risk currency rally is highly probable.
Local factors from SA could also hamper a move towards the support range namely: The weak fiscal position, continued civil labour union tensions and the threat of further credit rating downgrades (largely due to the debt pile of the long list of failed State Owned Entities and the crumbling of the SA economy). These factors could easily jeopardize the move into the support range which could mean that South Africans may never see the USD/ZAR trade below 14.50 ever again...


USDZAR top-down AnalysisHello everyone, if you like the idea, do not forget to support with a like and follow.
on WEEKLY: USDZAR is sitting around strong demand in blue and rejecting a green trendline so we will be looking for trend-following buy setups on lower timeframes.
on H1: USDZAR is forming a trendline in red so we are waiting for a new swing to form around it to consider it our new trigger swing.
Trigger: Waiting for a momentum candle close above the gray area to sell.
and until the buy is activated, this one would be overall bearish and can still dive inside the blue zone.
Good luck!

USDZAR UP!It can be seen that this configuration has a great potential for return against risk. Cheers!


UASDZAR looking to put in a bottomwe have finally reached the weekly supply zone that we have been waiting for since june. Momentum is still strong, so you wold expect to see some sort of basing/accumulation forming at these levels. Looking at the daily chart, we can see them starting to slow it down, however, we will look for the weekly to continue to hold support.


USDZAR long analysisUSDZAR long analysis
-Long idea
- BUY 15.33500
- SL 15.25000
- TP1 15.65000
- TP2 15.77000


