USDZAR GET READY FOR LONGGet ready for long position. Stoploss will be at 15.51130 -> double bottom. Profit targets at fibonacci level 0,618 or much more higher. This can go to test even 20
Lets see
USDZAR


USDZAR Opportunity - Bullish Divergence Quick Reversal ExpectedUSDZAR Opportunity - Bullish Divergence Quick Reversal Expected post 1 more low for short period of time -


South Africa’s recent reportsThe pair will break down from a major support line, sending the pair lower towards a key support line. South Africa’s recent reports were mixed with a lower trade surplus and a high Manufacturing PMI report. The trade balance report on Friday, October 30, showed the country’s surplus for September adding $33.51 billion, lower than the prior month’s $38.70 billion. However, the manufacturing sector has been expanding with 60.9 points against the previous record of 58.5 points. On the other hand, figures from the US’ latest reports were better-than-expected. Investors are also looking forward to the result of the US election today, November 03. Analysts expected that a win for Joe Biden will be beneficial for South Africa as the country considers China as one of its largest trading partners. Biden is expected to be more accommodating to China while it will be more skeptical of Russia’s growing influence. The opposite is true for Trump.


USDZAR longUSDZAR reached support and did break through resistance, waiting for the bullish impulse to the upside

USDZAR/ Buy pattren //USDZAR/ Foracsting buy pattren ,
Buy at this key level simple
and clean method ??
THANK YOU

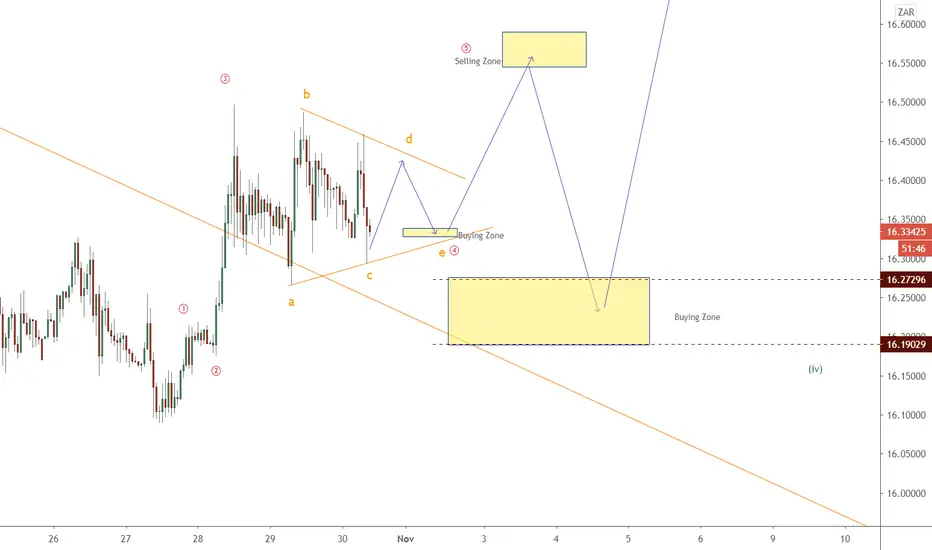
USDZAR Map Update Hello Traders,
It seems that Wave 4 is changing pattern to bigger Triangle Pattern
FX:USDZAR


USD/ZAR Monthly BuyAfter big breakout, price has pull back / consolidated for 6 months and is now testing moving average. Long @ market with stop at 15.74 and target of 19


USDZAR ANALYSISPrice is in an accumulation phase/range and at the support of the AR. The support would be a good place for a long trade with low risk. This falling wedge will be a good place for an uptrend continuation if price breaks above the wedge. Please endeavor to do your own analysis to find better entries and better options. Cheers!

USDZAR2 option as always - price will break support level and close underneath for future drop or price will rejected to the long side.


USDZAR ZONE TO ZONECONFIRMACIONES
1. zona de demanda en h4/ H4 Demand zone
2. Bullish engulfing confirmando patrón de continuación/ Bullish engulfing confirming continuation pattern
3. 78% fib
