"De-Dollarization" is coming...?The U.S. dollar has dominated global trade and capital flows over many decades. However, many nations are looking for alternatives to the greenback to reduce their dependence on the United States. This graphic catalogs the rise of the U.S. dollar as the dominant international reserve currency, and the recent efforts by various nations to de-dollarize and reduce their dependence on the U.S. financial system.
The United States became, almost overnight, the leading financial power after World War I. The country entered the war only in 1917 and emerged far stronger than its European counterparts. As a result, the dollar began to displace the pound sterling as the international reserve currency and the U.S. also became a significant recipient of wartime gold inflows.
The dollar then gained a greater role in 1944, when 44 countries signed the Bretton Woods Agreement, creating a collective international currency exchange regime pegged to the U.S. dollar which was, in turn, pegged to the price of gold.
By the late 1960s, European and Japanese exports became more competitive with U.S. exports. There was a large supply of dollars around the world, making it difficult to back dollars with gold. President Nixon ceased the direct convertibility of U.S. dollars to gold in 1971. This ended both the gold standard and the limit on the amount of currency that could be printed.
Although it has remained the international reserve currency, the U.S. dollar has increasingly lost its purchasing power since then.
Russia and China’s Steps Towards De-Dollarization
Concerned about America’s dominance over the global financial system and the country’s ability to ‘weaponize’ it, other nations have been testing alternatives to reduce the dollar’s hegemony. As the United States and other Western nations imposed economic sanctions against Russia in response to its invasion of Ukraine, Moscow and the Chinese government have been teaming up to reduce reliance on the dollar and to establish cooperation between their financial systems.
Since the invasion in 2022, the ruble-yuan trade has increased eighty-fold. Russia and Iran are also working together to launch a cryptocurrency backed by gold, according to Russian news agency Vedmosti.
In addition, central banks (especially Russia’s and China’s) have bought gold at the fastest pace since 1967 as countries move to diversify their reserves away from the dollar.
How Other Countries are Reducing Dollar Dependence
De-dollarization it’s a theme in other parts of the world:
- In recent months, Brazil and Argentina have discussed the creation of a common currency for the two largest economies in South America.
- In a conference in Singapore in January, multiple former Southeast Asian officials spoke about de-dollarization efforts underway.
- The UAE and India are in talks to use rupees to trade non-oil commodities in a shift away from the dollar, according to Reuters.
- For the first time in 48 years, Saudi Arabia said that the oil-rich nation is open to trading in currencies besides the U.S. dollar.
Despite these movements, few expect to see the end of the dollar’s global sovereign status anytime soon. Currently, central banks still hold about 60% of their foreign exchange reserves in dollars.
What will happen to the dollar in the next few years? What is your opinion?
Like if my analysis is useful.
Cheers!
Useconomy

U.S. Case Shiller Home Price Index in contraction?As you can see from the Monthly Chart, U.S. Case Shiller Home Price Index could experience an interesting price contraction in short-medium term, could this also be a clear sign of a potential economic contraction, recession? If this happens, we shouldn't be surprised, the Fed is doing everything to fight inflation in the United States...
Trade with care! 👍 ...and if you think that my analysis is useful, please..."Like, Share and Comment" ...thank you! 💖
Cheers!
N.B.: Updates will follow below

Things are looking very ugly, day by dayRate hike will continue as Jerome has no way out now. 50 basis points is my projection. Experts cannot see any concrete signs that economy is under control, in which they are right.
Wall St banker's narrative are switching from soft landing, to crash landing.
US money supply has shrinked while yield curve remain heavily inverted. Uh ohh.
Congress voted to end emergency allotment. This means millions of Americans will lose $3 Billion a month food stamp benefits.
Debt levels across all segments & categories are at record high.
Layoffs are still on-going and is not stopping.
Stay liquid and conserve ammunition. The bottom is not in yet.
By Sifu Steve @ XeroAcademy

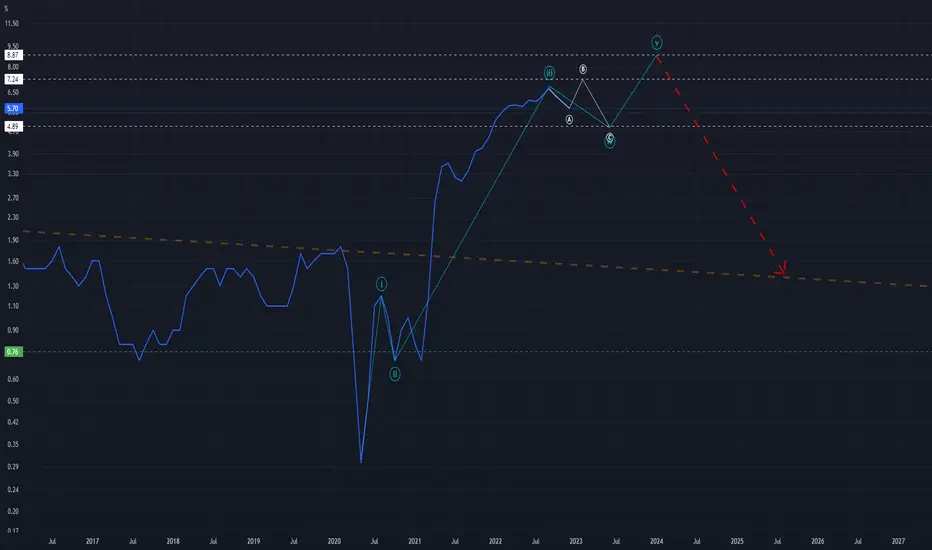
Elliott Wave Science Meets the Consumer Price IndexIt would be awesome if TradingView offered a candlestick chart for CPI but considering its only updated once per month, maybe the line graph/chart is the best option (not sure how that works). As for the data available to me, I've done a best effort markup using the science of Elliott Wave Theory. Considering the fluctuations seen on the M(onthly) chart, I believe its possible that CPI is sitting in the midst of a shallow Wave 4 correction. With this in mind, I find it possible that the number stretches into the low-mid 7.xx range between now and March. From there we may see a 2023 low within the 4.xx level.
I will share my thoughts here as I know there is much interest in "what will the CPI numbers be?"... Being that this CPI data is directly based on the actions of humans and the habits that we act on, it should work pretty well with Elliott Wave Theory. I will keep this post fluid and apply analytical updates as monthly results are publicly announced.
Remember these three important things: 1) trade the chart instead of the news and 2) stay safe /3) don't drown!
Reduce inflation rate from 6.5% to 3% this years, says WilliamsFOMC's Williams speech did not do much, as he was echoing what Jerome Powell already said 2 days ago. Rate hikes to resume, but at slower pace. Williams mentioned that inflation rate in the US should cool off to 3% this year, now at 6.5%. That's 50% lower.
Question is, how much more rate hike is required to push inflation down by 50%? Will that be somehow somewhat slowdown the US economy as a whole? A whole lot more tightening will need to take place, as I see it. Lending has already begun to tighten and credit is more difficult to obtain due to stricter requirements by banks.
Hmm... how will this play out?
By Sifu Steve @ XeroAcademy
#usdollar #usd #dxy #interestrates #useconomy #federalreserve #FOMC #inflation

Bond Market Signals Potential Trouble for the Federal ReserveIn recent weeks, the bond market has been sending a strong signal to the Federal Reserve: it may be making a serious mistake. The yield curve, which measures the difference in interest rates between short-term and long-term bonds, is currently more inverted than it has been since the early 1980s.
An inverted yield curve occurs when short-term interest rates are higher than long-term interest rates. This can be a cause for concern because it can indicate that investors are expecting economic growth to slow in the future. When investors expect the economy to slow, they are less likely to lend money for long periods of time, leading to higher interest rates on short-term bonds and lower interest rates on long-term bonds.
The current yield curve inversion has many experts worried. In the past, an inverted yield curve has often been a reliable predictor of a recession. In fact, every recession in the past 50 years has been preceded by an inverted yield curve.
One reason for the current inversion may be the Federal Reserve's recent interest rate hikes. The Fed has raised interest rates several times in recent years in an effort to prevent the economy from overheating. However, these rate hikes may have had the unintended consequence of slowing economic growth.
Despite the potential risks, experts believe that the current yield curve inversion may not be as concerning as it seems. They argue that other factors, such as the strong job market and low unemployment rate, suggest that the economy is still in good shape.
In the end, only time will tell if the bond market's concerns are justified. However, the Federal Reserve will need to closely monitor the situation and be prepared to take action if necessary to prevent a potential recession.

BOOM broke line Going parabolic!!
40 years inflation high
Now we go to all time inflation high
Sell before its late
(((Dont fight the FED)))

Ever wonder what’s preventing the market from a massive crash?The answer is DEBT
Real GDP (Green) US Public Debt(yellow).
Look at how aggressively debt has grown from 1970 till today.
Just to bring this a bit closer home. It’s like constantly getting yourself in financial trouble yet the bank keeps giving you more and more credit.
If the government was an individual, it’s credit score would be less than 500. And even with a shitty score like that, they keep getting more and more into debt.
This is NOT capitalism. This is the part where gamesmanship applies.
The question becomes, what happens to our economy if the government didn’t bail out or print any NEW money for 10 years?
In other words, Be slightly paranoid when it comes to your investment philosophy.
Play offense, but stay alert.

BITCOIN OUTLOOK, 2022-2023 - Rain, before the rainbowGreetings community
As the crypto giant sets the tone and leads the pack, it is evident to see examples of 'impulse-correction-impulse', or 'drop-rally-drop'. Whilst down significantly, it is still up significantly to early adopters. It is sometimes good to remember that even with this plummet, BTC still is, and will always have the highest growth factor and ROI across any asset. This correction was inevitable and should bring smiles to faces of all - as this is not a tragedy, but rather an opportunity of a lifetime, to what is, and will continue to expand as one of, if not, THE primary currency of the world.
It is a digital world, and as consumers we need to understand Bitcoin will be to us, what Gold and Silver were to our forefathers. It is actually the primary digital commodity of the 21st century, that every being will require, to 'barter' across platforms and exchanges for other necessary tokens, in order to transact daily, as with every tomorrow, fiat currencies all over the world, evidently loses more trust, and more value due to being unable to keep up with inflation.
I have illustrated my outlook on Bitcoin for the next few months. We are clearly in corrective state despite mandatory manipulation here and there. There is no two ways about it.
Avoid FOMO, perhaps, rather watch the BTC chart as you'd binge watch a Netflix series, every night. Well, at least until Q4 2022, leading into Q1 2023.
Anticipate long positions between 10-13k.
Notes:
-Inflation & Interest
-Recession rumors
-Bear market continuation
-US/Global economy
-Safe haven of the future
-Crypto in the Metaverse
Ever heard the saying, "Fall down seven, stand up eight." That sums it up pretty well.

MARCH MADNESS (Major historical event key dates and price areas)The patterns are there if you look close enough you will see them.
EVERY MAJOR ECONOMIC HISTORICAL EVENT HAPPENED IN MARCH.
EVERY SINGLE ONE.
- We are not in a recession. The recession has not started yet but it is imminent.
Something to keep in mind is when the economy is in a recession the dollar deflates not inflates and unemployment rises.
Something big is going to happen March of 2003. Just like March of 2020 (Corona Virus)
My guess is the planned "Russian hacks" will begin in the United States initiating a war crime agains the US thus commencing a new WWIII
***(Keep in mind the Russians have already hacked a MAJOR United States cyber security company as of mid 2021)***
All major historical events have always been and will continue to be orchestrated and planned.
Brace yourselves, .March of 2023 might be the start of the new Great Recession.
Reference the dates and historical events on the chart. I can't make this stuff up.
-Lomeli

SPX500: Down goes the economy!Get ready for something we have never seen before in American history.

SP500 recovery or dead cat bounce?Hi traders this analysis is very simple and uses some basic methods.
I'm using the "filling gaps" method, the SP500
During the last years this method has been simple but effective.
I'm worried about the gap left in November 2020, the SP can easily go and fill it considering we are only 15% above it, and in June 2022 we dropped 12% in a single week.
This gap confluates with the ATH before the COVID crisis, so by technical analysis we know:
“Previous resistance, now new support.”
So I am considering a bounce of the SP500 until 4000 and then possible sell off.
All financial markets follow SP500 including crypto.
So I'm expecting a DEAD CAT BOUNCE on all markets.

DXY macroview for 2022 - Will the history repeat?This analysis has a lot to look at.
Lets begin with the DXY at the end of the 70s, those times my parents were just born, so I had to do research.
The US 70s crisis. According to the information I gathered, this crisis was due to the trade balance deficit. A strong speculation against the dollar appeared due to the American economic weakness.
In March of 1985 the DXY crashed 52% and by September of 1992 a bounce happened, this bounce took the DXY to the 0.5 Fib Retracement level, and when this level was reached, the .com bubble took place.
In January of 2002 until February 2008 the DXY crashed 41% very similar to the previous scenario.
(To make this easier to understand I drew a path using dotted lines, the pattern is similar except on the timing aspect.)
So I think that the DXY will reach the 0.786 level area and then … darker days will come.
I'm also considering the “The typical big cycle behind empires rises and declines” by Ray Dalio and also the fact that every 100 years empires suffer.
83 years have passed since the start of WWII, this war marked the beginning of the American empire, this means that we are 17 years away from the 100 anniversary, these 17 years coincide with the emergence of China as the 1st world power.
This is all I have to say for this analysis, I appreciate your attention

Will sanctions on Russia backfire on the U.S.? What about crypto- Sanctions, led by the U.S. in hopes of punishing Russian aggression may NOT have the impact the U.S. is hoping for? Could they actually backfire?
- Saudi Arabia rejects Biden's request for talks on increasing oil production and instead announces that they are considering accepting Yuan instead of dollars for Chinese Oil sales (per house rules, links to sources are not allowed)
- India's move to "explore" alternative payment channels with Russia to avoid sanctions (per house rules, links to sources are not allowed)
- With official inflation numbers running at 8% and climbing the Federal Reserve is being forced to raise interest rates for the first time since 2018 (per house rules, links to sources are not allowed). Multiple rate hikes are projected. The last time rates were raised markets crashed and the Fed quickly reversed course. This leads many to say that the Fed won't really raise rates as much as projected, because the market won't let them, but what these people don't seem to get is that in order to finance the U.S. national debt, new debt has to be sold every year. As inflation rises countries like Saudi Arabia become more and more inclined to invest in assets that show a return or at least hold their value. This means that unless you raise the rates to a level that offsets inflation many investors will move elsewhere and you won't be able to take on new debt. Central banks are cornered. Once they start raising rates government budgets will quickly hit a wall as interest payments on existing debt become unmanageable.
- This may devastate the dollar along with the U.S. economy, but it may be great for crypto

US500 LongHey traders, in today's trading session we are monitoring US500 for a buying opportunity around 4220 zone, once we will receive any bullish confirmation the trade will be executed.
Trade safe, Joe.

NZDUSD SHORT Negative NFP for USD didn't make USD pairs go the other way because US economy is very strong and DXY will raise soon. NZDUSD looks very berish on weekly and I found and entry Friday on the 1h. What I see is a bounce from 0.67200 area where there is a daily resistance/support, then back to the yellow line where there was a previous support ( which you can use to re enter short) and then back down for trend continuation. Fundamentals USD is very strong and I see this pair going to 0.65 by January latest.

USD Quickly Lost Ground To Major Trading PartnersAs of writing, the DXY is trading at 93.355, down by 0.50% on Thursday trading.
GDP growth in the US may be contributing to this 4-week low in the dollar index. GDP growth missed expectations for Q3 2021, reporting in at 2.0% rather than the expected 2.7%. Q3’s GDP growth represents the lowest value reported for this data point since the US began to recover from the worst of the pandemic.
Supply constraints have been pointed out as one of the major causes for the GDP growth miss, as reported by Fannie Mae earlier in the month. Fannie Mae expects the constraints to continue for another 12 months, although weakening in intensity as time passes.
USD suffers greatest loss against the EUR
The USD has lost the most ground against the EUR in the past 24 hours. EURUSD is trading at 1.16831 at the time of writing, up by 0.72% and a one month high for the pair. The cause of the EUR's strength: The public address by the Christine Lagarde, head of the European Central Bank (ECB), playing down any fears of inflation.
While Inflation in the Eurozone is at a 13-year high (3.4%), Lagarde and her ECB associates are not ready to drop the notion that inflation is transitory. The ECB want to see inflation above 2% over the medium term before considering rate hikes or taking a more hawkish tone.
The ECB believes that inflation in the Eurozone has been driven chiefly by supply bottlenecks and energy prices. It could be some time before investors see any change in the dovish stance of the ECB.
Supply constraints are expected to last for a great deal of time, as noted above, while energy prices are yet to show any sign of abatement. The Biden administration has asked energy producers to lift production to help drop the cost of energy. But the request is falling on deaf ears.
At the time of writing, WTI is trading at US $83.04 per barrel, while Brent is trading at US $84.39 per barrel. Both Oil instruments are trading at multi-year highs. The price of Natural Gas does swing widely day-to-day. A 7% swing either way over a day’s trading is not uncommon. Yet, Natural Gas is still trading at US $5.732/MMBtu, more than double the price at the beginning of 2021.

THE GREAT CRASH IS COMING! This Fractal Pattern Tells Us Why!Hello friends! It's been a while. Many apologies for that. Life has been busy so I haven't been able to dedicate much time to T.A on TradingView.
I have recently pulled out of Crypto, just waiting to see if Bitcoin decides to break-through or crash. Patience is key here - keep cash handy. You want to be sure of your investments (easier said than done in these very strange financial times).
I have been researching the U.S Economy lately. How is it that in that there is no correlation between the workforce economy and the stock market?
The U.S have recently averted default (when you're unable to make a repayment) by once again - lifting the debt ceiling to 28.9 trillion US dollars (yes, that is correct). This situation, better known as Cockroach Motel is a game that has never been played to this extent before. Keep avoiding a recession by printing your way out of it. Negative consequences? Yes. Many.
Here is a dump of my notes and why the US isn't in as good as a position as you may believe:
✓ Uncontrollable Inflation due to the U.S's printed economy.
✓ Debt highly leveraged across all trading firms.
✓ Feds left with no further tools due to 0% interest rates.
✓ Commercial property vacancies increasing.
✓ Energy shortage crisis in Europe and China.
✓ Rising expenses, declining incomes.
✓ Gas and oil prices at an all time high in Europe.
✓ Commodity prices at highs not seen since 2011.
✓ Irresponsible government spending and federal policies. (Yes, the Biden Administrations 'Build Back Better' agenda is a little too pricey for their current situation)
✓ Evergrande and Fantasia Holdings on the brink of bankruptcy in China.
✓ 2008 GFC was the housing bubble crash. Every asset is currently in a bubble. We are in a debt crisis.
✓ 40% of the money in the US economy has been printed in the last 12 months - now more. Feds have printed their way out of the 2008 and 2020 COVID-19 recession and made the debt bubble larger.
✓ Effective Federal Funds Rate is down to 0.8% - cheap money.
✓ Post 2008 recovery is an ongoing untried experience.
✓ Market is currently parabolic, as seen in 1929 crash which results in 90% drop.
✓ Wealth gap is increasing due to printed money. Asset prices increase as yearly salary stagnates/decreases due to inflation. This makes the rich richer and the middle class and poor poorer.
✓ No correlation between the economy and the stock market. Money is staying in the investor market.
✓ Velocity of money is plummeting. People are not spending. The Chinese economy is growing while we are stuck with a massive debt.
✓ Saving going up and spending going down. Debt/GDB ratio is extremely high.
✓ Huge underemployment.
✓ Massive social unrest. Fed and treasury haven't invested in the working class.
✓ Superannuation is going to crash which will force many to convert their portfolio to liquid money.
✓ Armed the Taliban in Afghanistan. Weapons will be used against our only ally, Israel.
✓ Yallan and Powell work for the Fed and treasury which is essentially a communist organisation.
✓ Bullish Gold, Silver and BTC
✓ Michael Burry and Robert Kyosaki predicts crash of 90% and American financial system collapse
✓ The US Government is inviting inflation with its MMT tinged policies, brisk debt/GDP ratio, M2 increases while retail sales, PMI stage V recovery. Trillions more stimulus and reopening to boost demand as employee and supply chain costs skyrocket
✓ Consumer price index reaching all time highs.
✓ Biggest speculative market of all time - Robinhood generation
✓ Real-estate is currently experiencing hyperinflation.
Back to the Chart:
I found a fractal pattern from the 2008 GFC which is quite similar to this crash. I wouldn't compare it to the Dot Com bubble as that was far more speculative. This crash is similar due to greed - the belief that the economy will never crash and just continue in the upwards direction despite increasing debt at levels never seen before.
Enjoy this fractal and better yet, enjoy the rest of your day.
Love, peace, Seb.

Big Bubble in US tech stocksNO VOLUME and making new highs, BEARISH DIVERGENCE, as you know APPLE is one of the major stocks for the US economy, I can see that right now theres is a big bubble around american tech companies, (google, amazon, facebook, etc)
So in the next coming years we MIGHT see a huge crash in american stocks, and by consequence in US economy.
And Im not sure about this crash because the US goverment cannot allow something like this, but in this world anything is possible.
If there is any grammatical mistake I´m sorry, bout right now I´m very drunk
this is an experiment to see if being drunk is good for the analisys.

US Markets to See Big PullbackWe've been on quite the bullrun this year. I think it's time to go short.
Technically:
For the first time this year, we have fallen below the 50ema on the Daily and failed to recover above it. We normally recover same day or next but its been 6 trading days below the 50ema. We made a lower low in June which signaled a sign of weakness in the uptrend. Now we are again making another low below August 19th low. I think its time we retest some support levels.
Fundamentally:
- Fed has talked about tapering and possibly raising rates buy EOY/early next year
- Covid Delta variant is on the rise, raising fear in multiple countries
- US Congress has not yet voted on the Federal Budget and will most likely go into a Government Shutdown next month.
- China cracking down on Tech + Evergrande 300b default is likely to make some waves globally
Levels to watch:
- ~34000 (July Low)
- ~33200 (May High, June Low, 200 ema)
- ~31200 (New year consolidation range)
- ~29600 (Pre-covid High, Feb Low)

EURUSD - USD Likely To Rise further - lower interest ratesWanted to share this around the outlook on the EUR and Dollar. Looking at a more long term chart one notices the weakness in time of the EUR versus the Dollar.
All simple and forward. The dot.com bubble burst was more difficult for the EUR zone then the USD. Same for the subprime crisis.
Then came the negative interest rate in Europe. And that sucked most of the life out of the EUR.
These negative interest rates are still ongoing in Europe and along comes what history maybe falsely will claim to be the Covid-19.
So what could we predict for the future of the EUR and USD.
The US is dealing much better with the Covid pandemic. Vaccines are being administered in record times. The US economy will likely bounce back better and faster then in Europe.
The now democratic leadership will initiate a central bank based digital USD and will use it to provide economy stimulus. The ECB will follow suit.
Yet given that the US is pumping way more USDs into the world then EUR is being created all this stimulus will be stimulus in USD.
The World Economic Forum is setting the tone of where the money will flow.
Et voila, I believe the EUR will drop further.
Keep in mind this is like all predictions crystal ball territory. I believe the historic view shows USD will reign. Only maybe the Chinese could put a dimple into that, but the US is sure to work against that.
So stronger economy and recovery means stronger currency in my view.
** Please support this idea with your likes and comments, it is the best way to keep it relevant and support me. **
--------------------------------------------------------------------------------------------------------
!! Donations via TradingView coins also help me a great deal at posting more free trading content and signals here !!

DXY – Down to weekly resistance areaFederal Reserve Chairman Jerome Powell on Wednesday February 10 painted a bleak picture on the state of U.S. employment, saying continued aggressive policy support is needed to fix the myriad issues still facing workers. Addressing the issue will require a “patiently accommodative monetary policy that embraces the lessons of the past” regarding the benefits that low interest rates bring to the labor market, the central bank chief told the Economic Club of New York.
We believe that the low interest rate environment will continue and that the FED will continue to increase the money supply putting pressure on the dollar index to go lower.
Technically, after a corrective period that lasted from January to the beginning of February it seems like the dollar index is resuming its weekly downtrend. We are now waiting for a smaller corrective pattern and then go lower to reach the rectangular area of weekly resistance where the price reversed in January 2018.
Trade with care.
Best regards,
Financial Flagship
Disclaimer: The analysis provided is purely informative and it should not be used as financial advice. Remember that you need a plan before you start trading; so, take this knowledge and use it as a guidebook that will ultimately help you understand the market and easily predict your next move.

THE US DOLLAR ($DXY) IS ON THE VERGE ON GETTING OBLITERATED...!!THE US DOLLAR (DXY) SITS AT THE TOP OF THE 3RD OF A SERIES OF BEAR FLAGS WHICH HAVE BEEN PRINTED SINCE THE BEGINNING OF 2020... THIS CURRENT LEVEL (THE CLOSE ON 2.3.2021) = 91.101 (What an interesting number for a possible break down hmmmm) was support & then later resistance before breaking thru higher in 2018... now we appear on the verge of a break down from this level in February 2021...
The next level of support below this is ~89.664 which held as support back in 2018.
Hang tight...!
