s&p spx sell opportunity trade of the weeks n p 500 is iam looking for trade of the week lets see how it goes
Usindices

Taf's Gun to the HeadTrade Idea: Selling Dow at market
Reasoning : Selling on rejection from supply zone (32200-32500) and a bearish head and shoulders on an intraday basis(although not validated yet)
Entry:32048
TP: 31138
SL: 32416
RR: 2.47
Disclaimer – Signal Centre. Please be reminded – you alone are responsible for your trading – both gains and losses . There is a very high degree of risk involved in trading. The technical analysis , like all indicators, strategies, columns, articles and other features accessible on/though this site is for informational purposes only and should not be construed as investment advice by you. Your use of the technical analysis , as would also your use of all mentioned indicators, strategies, columns, articles and all other features, is entirely at your own risk and it is your sole responsibility to evaluate the accuracy, completeness and usefulness (including suitability) of the information. You should assess the risk of any trade with your financial adviser and make your own independent decision(s) regarding any tradable products which may be the subject matter of the technical analysis or any of the said indicators, strategies, columns, articles and all other features.

SPY double diamond in 1H chart w/ divergence near Oct lowSPY formed 2 diamond patterns as seen in this hourly chart. It formed slight RSI positive divergence near the Oct low. However, this divergence may still get lower to reach 3500, an impt Fibonacci level, more so if the CPI report come out higher tomorrow.
Weekly wma 200 still the line in the sand.
The next major catalysts this week are Thursday”s CPI data & bank earnings. Start of earnings season will
usher in more volatility next week due to the fear of earnings recession.
Not trading advice

SPX - Opening gap on MondayAfter successfully predicting the bounce following new lows and then warning about the subsequent drop, we are back to provide more thoughts on the market. In the big scheme of things, not much has changed. Merely the market confirmed our bearish bias, which we have continued to nourish throughout 2022.
Despite many calling it the spreading of fear and uncertainty, we can not ignore macroeconomic factors driving the market. Because of that, we continue to think that the bear market is not done. Quite the contrary, we believe the market conditions are set to dramatically worsen with the FED rising interest rates later next month.
In tandem with that assessment, we think the market is due to start slowly progressing from the second stage of the bear market into the third stage in 2023 (after weak earnings reinforce our notion of the 2nd stage of the bear market). Therefore, we believe that the market has not hit bottom yet. Accordingly, we stick to our price target of 3500 USD.
Illustration 1.01
Illustration 1.01 shows the hourly chart of ES1! continuous futures. An opening gap occurred on Monday, and the price retraced it later. Therefore, we will pay close attention to whether the price manages to hold above the gap; the inability of the price to do so will be bearish.
Technical analysis - daily time frame
RSI, Stochastic, and MACD turned bearish on Friday. DM+ and DM- continue to be bearish. Overall, the daily time frame is bearish.
Technical analysis - weekly time frame
RSI, MACD, Stochastic, DM+, and DM- are all bearish. Overall, the weekly time frame is bearish.
Please feel free to express your ideas and thoughts in the comment section.
DISCLAIMER: This analysis is not intended to encourage any buying or selling of any particular securities. Furthermore, it should not be a basis for taking any trade action by an individual investor. Therefore, your own due diligence is highly advised before entering a trade.

$NQ - C'mon! $NQ - C'mon!
One of my favourite indices, enjoy my outlook...! Key support...Hard or soft landing?!
Best,
TJ

S&P - Harsh landing!?S&P - Harsh landing!?
As had FOMC, dot plots moving to further rate hikes till end of the year anticipated, dxy heads higher leading indices to land at an interesting area. I personally think it wont be soft as I have mentioned in my videos in...technically we are at very key support if this support does not hold further bearish momentum is set to continue.
Regarding the week ahead a lot of CB's speakers!
Key tip: Lot of others may underestimate you, but don't let the noise get to you...
Trade carefully & have a great week ahead,
TJ

SPX500 Weekly outlook on the SPX looks to me like we are on the verge in a big downwards move in SPX on the weekly, LTF could sell a pullback first. What this will signal is a strong rise in the Dollar as Stocks have a bit of mean reversion after than monstrous climb.

Evening Update: Entered ES Short via Futures OptionsJust for accountability purposes since I don't normally post Friday evening...I sold 3 AUG EOM 4400 Calls for $16.50 which = $2466 in Premium. I like selling near dated options on a Friday because of the premium deterioration over the weekend. I did this trade when the ES was at 4274.
Best to all,
Chris

SPX lost 4k on high inflation data; 5-3-5 ABC wave targets 3400?As I have been warning many times since start of June, SPX again pulls another bulltrap. Many were expecting a bullflag to break above 4200 but what I actually see is a DIAMOND REVERSAL PATTERN which breaks below the psychological 4k support by gapping down to 3900. It stopped exactly at the base of the green Megaphone pattern of Sept 2021 to 4818 ATH. I think SPX may go up soon to fill the gap before doing the final leg of this ABC corrective wave. 3500/3400 is a good support with SPX retesting another green Megaphone pattern back from 2018.
A BIG MOVE is coming next Wednesday to Friday after another impt FED event. Last Friday, VIX was not able to reach 30 even with so much drop in the indices.
US dollar DXY & TNX 10-yr rate going higher. Money is rotating into safe haven like gold & dollars.
WATCH VIX carefully. If VIX reaches 30 before the event, there will be a shortterm rally. But if VIX remains low going into FED announcement, another capitulation will follow. There is a possibility the FED will be more hawkish by annoiuncing a 75 basis point rate hike in July or September. The FED needs to show it is serious in fighting inflation but many times it is just another FED rhetoric to condition the market & see how the market reacts.. Often times the bond vigilantes will do the job for the FED, without the need for aggressive hikes.
Small WAVE 5 prediction: ABC’s wave C is near completion & currently doing the final wave 5 of C. This small wave 5 will be 5 waves. Friday’s breakdown of 4k from the diamond reversal will be the first wave of 5 (1/5). Wave 2/5 will be the counter trend relief rally to fill the down gap. Wave 3/5 will be the big capitulation needed to push VIX above 30. Then Wave 4/5 & 5/5 may be the lower low to create a DIVERGENCE to end the almost 30% market crash.
Stock market is a forward looking mechanism. It may start rising even before the economy recovers. Major inflation happens in food & gas. Commodity prices are already stalling & if oil prices start to slow down, inflation will surely follow. Market sentiment may suddenly shift after the market has already priced in so many negative headwinds. All it needs is a “not so bad news” or when valuation becomes significantly cheap & smart money starts accumulating.
Not trading advice

SPXSPX makes an head and shoulders reversal under high volume before breaking the neckline and retesting, we could look for shorts and aim for 3300-3400 region.

US30 gonna be bullish after breaking the triangle patterAs you can see its about two weeks which the price break the long term bearish channel and fixed itself above the last resistance.... Now we have to wait for breaking out of the triangle pattern.
Entering above 33500 would be appropriate and the midterm tp would be 34100 as well as the long term tp 35300 (based on fib retracement of the last bullish price movement)

Evening Update: Well it's a startThis morning I posted..." the current pattern looks locked and loaded for a big up day. I don't want to get ahead of myself but if we trade above 4,000 "impulsively" it starts to make a strong case for at least a local bottom."
My target for SPX is at least 4200 for a minor wave 1. No reason to NOT stay long.
Best to All,
Chris

Morning Update: Do we have a 1-2, i-ii in place?If we can build on yesterday's rally, the current pattern looks locked and loaded for a big up day. I don't want to get ahead of myself but if we trade above 4,000 "impulsively" it starts to make a strong case for at least a local bottom. Let's see how things shape up today.
Best to All,
Chris

Evening Update: Wave 4 Frustration Any one who follows EWP and trades will tell you NEVERTRADE A WAVE 4. Wave 4's typically can have the most complex of all EWP patterns. It's just not worth it.
Today the SPX opened high and stayed high throughout the day. I do think this will take time but we should get retrace tomorrow in b of 4. They way I'm labeling this area is largely as a wave 4 flat. Obviously I'm keeping an open mind to what price tells me...but patience is required as this wave 4 will not compete tomorrow.
Best to All,
Chris

Weekend Update: SP500 to bottom (possibly) this upcoming weekAll hope is lost. The Federal Reserve has lost control of inflation. Interest Rates are the highest in Decades. The Stock Market is un-investable.
To me, these headlines are the sound of music. The stuff bottoms are made of. Let's take inflation and interest rates. The newer generations of stock market traders have never had to learn the lesson of " Mean Reversion".
Investopedia defines this as a theory used in finance that suggests that asset price volatility and historical returns eventually will revert to the long-run mean or average level of the entire dataset. That gobbly-gook basically says as it pertains to inflation and interest rates when you artificially mess with interest rates to control inflation, eventually the intervention unwinds and reverts to mean data set of where it would've been had not intervention taking place.
In the 1990's mortgage rates were as high as 10%. January of 1990 the yield on the 30yr Treasury was 7.5%. In January of 2000, that yield was 6%. In the same timeframe the stock gained 500%. Enter one Alan Greenspan, a Ben Bernanke and subsequent others starting with Larry Summers under Reagan and we used the Federal Reserve to intervene on all sorts of things and much more frequently as time went on.
Inflation and interest rates will play out they way they'll play out. In my opinion, these macro economic data sets will have little effect over the long term. I know you'll think I'm Looney...but if I told you the stock market would absolutely flourish at 7% yield on the long bond, you would laugh. You would say the stock market would be dead money and bonds would be the place investors would flock too. Maybe, for a short period of time, but entrepreneurs and innovators have a way of making ideas blossom in even the harshest financial environments.
As we read the reports of "Runaway Inflation" and Jerome Powell is not the man for these economic times to steer the fed...The Stock Market is busy bottoming. It's hatching it's plan to run to 5200 and telling only a few.
For those who listen, this next dive down will be a major wave IV bottom of the larger wave 3. The area of the wave 3 top should reside in the 5200 - 5500 area. Getting there should take the rest of the year maybe even 1st quarter of 2023.
Best to All,
Chris

US30Hey traders, in the coming week we are monitoring US30 for a selling opportunity around 34800 zone, once we will receive any bearish confirmation the trade will be executed.
Trade safe, Joe.

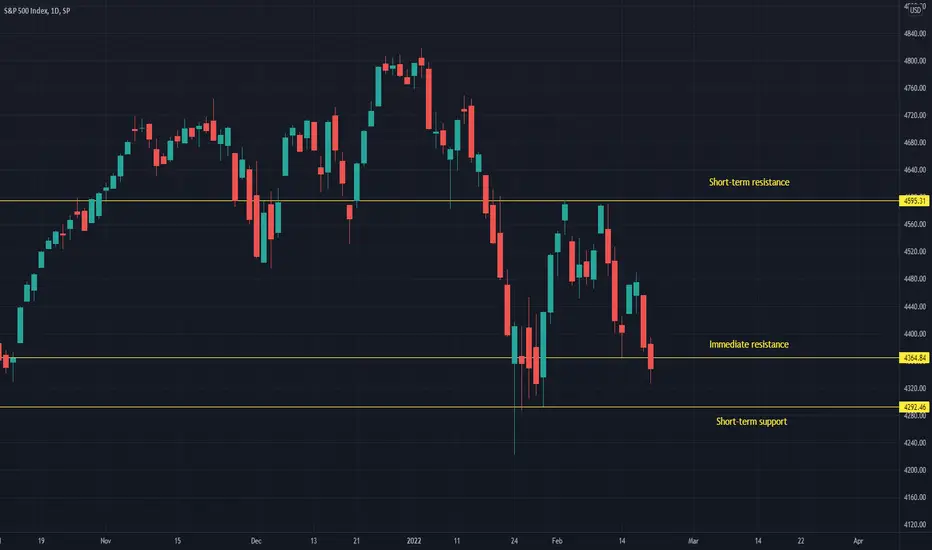
SPX - We expect more weakness ahead of the FOMCWe turn bearish on SPX as the FED meeting is less than a month away. We expect elevated volatility and weakness to continue ahead of the meeting. At the moment, we actually think it is very likely that weakness will remain persistent even after the FED meeting and interest rate hike. In our opinion, higher interest rates in the U.S. pose a substantial threat to further rise of SPX in short-term, medium-term as well as long-term. Our change of view is supported by recent failure of major U.S. indices to reverse to the upside. In addition to that, a change in technical indicators from neutral to bearish also supports our thesis. Because of that we would like to set a new short-term price target for SPX to 4 292 USD; we would also like to set a medium-term price target to 4 222 USD.
Illustration 1.01
Picture above shows the daily chart of SPX and its RSI. We expect the price to reach a new low below 4 222.62 USD. Meanwhile we expect RSI to reach a higher low in comparison to its recent low on 27th January 2021 (which was equal approximately 24 points).
Technical analysis - daily time frame
RSI failed to break its medium-term bearish structure. Stochastic continues to decline which is bearish. MACD reversed to the downside which is bearish as well. DM+ and DM+ also show bearish conditions in the market. ADX shows relatively flat movement which reflects recent choppy price action in the SPX. Overall, the daily time frame is bearish.
Technical analysis - weekly time frame
RSI continues to develop bearish structure. Same applies to MACD and Stochastic. DM+ and DM- are bearish too. ADX increases which suggests the prevailing trend is regaining momentum. Overall, the weekly time frame is bearish.
Support and resistance
Short-term support coincides with our short-term price target of 4 292 USD. Support 1 coincides with our medium-term price target of 4 222 USD. Short-term resistance lies at 4 595.31 USD and Resistance 1 sits at 4 748.83 USD. The major resistance level can be found at the all-time high value of 4 818.62 USD.
Please feel free to express your own ideas and thoughts in the comment section.
DISCLAIMER: This analysis is not intended to encourage any buying or selling of any particular securities. Furthermore, it should not serve as a basis for taking any trade action by an individual investor. Your own due diligence is highly advised before entering trade.
View on S&P500Could we see a contrarian move back to the resistance zone ?
I am slightly bullish and waiting for a retracement play.

US500Hey traders, in the coming week we are monitoring US500 for a buying opportunity around 4620 zone, once we will receive any bullish confirmation the trade will be executed.
Trade safe, Joe.

USOIL RESULT...CONGRATUALTIONS HIT OUR TARGETThe market is respect our target ... Congratulation To all who took this free signal ✅

SP500 MF-H4-IN ROUTE FOR LOWER LEVELS !4 HOURS (H4)
Two successive failure attempts to breakout the clouds resistance triggered a reversal move from its recent top @ 4'739.50 towards a low so far of
4'606.75, filling in its way both the 61.8% Fibonacci retracement (4'572.75-4'739.50)@ 4'636.50 and the 78.6% Fib ret @ 4608.50
Global picture in this time frame does not look very encouraging as currently the SP 500 is below :
1) The clouds
2) The Mid Bollinger Band
3) The Tenkan-Sen
4) The Kijun-Sen
and last but not least a Chikou-Span or Lagging line converging to the South as well...
RSI is @ 37.66
Last candle which closed a few minutes ago triggered an hammer pattern, watch next ongoing candle to validate or invalidate this pattern on a H4 closing basis !
1 HOUR (H1)
Short term recovery only triggered by a long white candle which just closed below the Mid Bollinger band resistance level.
Watch ongoing candle for getting more clues about short term picture.
DAILY (D1)
Under the influence of a major double top formation (trigger @ 4'500), coupled with a DOJI top and a bearish divergence !!!
In an ongoing downtrend price action and below the MBB, TS and KS.
Next support zone to watch at very carefully is the daily clouds support zone which is currently between 4'633 and 4'500 and which should be seen
as a key pivot zone for further development.
Indeed, a failure to :
1) stay and hold above the top of the clouds would be seen as the first warning signal, calling for further downside
2) A breakout of the bottom line of the former uptrend channel currently @ 4'566 (roughly the middle of the clouds too !) would also add more value for a downtrend continuation.
A breakout of 4'500 on a daily closing basis would :
1) confirm the double top formation in progress ---> target 4'200
2) also confirm the breakout of the daily clouds bottom area
WEEKLY :
The ongoing weekly closing level, later on today, would add more indication for the next week...
As a gentle reminder, the Mid Bollinger Band is currently @ 4'572 and a weekly closing below this level would be very negative for the upcoming week (s).
Second important support to look at is the weekly Kijun-Sen, @ 4'516 should be seen as the LAST VERY IMPORTANT LEVEL IN THIS WEEKLY TIME FRAME !!!
A failure to hold above 4'516 on a weekly closing basis would put the focus on 4'186.50, weekly clouds top and also 23.6% Fib retracement of the big rally from
2'174 towards the ATH @ 4'808.25
Ironman8848 & Jean-Pierre Burki

SP500 for a new ATH? 🦐SP500 after last weeks retracement is now back pushing at the resistance level near to the market all-time high.
According to Plancton's strategy of the market will break above we will set a nice long order.
––––
Follow the Shrimp 🦐
Keep in mind.
• 🟣 Purple structure -> Monthly structure.
• 🔴 Red structure -> Weekly structure.
• 🔵 Blue structure -> Daily structure.
• 🟡 Yellow structure -> 4h structure.
• ⚫️ Black structure -> >4h structure.
Here is the Plancton0618 technical analysis , please comment below if you have any question.
The ENTRY in the market will be taken only if the condition of the Plancton0618 strategy will trigger.

Nasdaq: Weekly Forecast 20210530The US market continued to recover from a major pullback in early May, resulting in another monthly gain except for Nasdaq.
However, recovery has slowed down over last week and the bulls seem to has become sluggish but the same goes for the bear as we don't see any significant attempt in the market to sell.
The stock market is somewhat expected to rise amid heavy government spending but will also continue to face challenges of rising inflation.
This week, we plan to attempt going short if Nasdaq continued to stay resisted at 13700.
Otherwise, the main plan is still to buy as the price pulls back with prices such as 13400, and 12800 should it breaks a new low.
