US Indices - Nasdaq, SP500, Dow; Market TopsMost likely Market Tops in US Indices .
Probable dates and price levels;
The Nasdaq100;
The SP500;
The DJIA;
The NDX/DJIA/SPX rotation;
Usindices

NASDAQ 100 – Week 6 – Earnings to impact Wall Street?A day earlier, the Nasdaq powered to another record closing high as tech stocks outperformed. In the current situation we expect the price to crawl towards the 14000.0 psychological level as we still have some bullish momentum left in the tank in order to wipe-out potential sellers. This target may be reached today, when FED Chair Jerome Powell will hold a speech in 4 hours from now.
Another aspect that can impact US100 could come from different companies that would report their earnings today, such as Coca-Cola (KO), UBER, GENERAL MOTORS (GM) & CME.
From a technical perspective, the price is moving righteously inside the channel, continuing to create higher-highs with continuous divergence forming on the Relative Strength Index. This is a sign that the bearish trend is running out of fuel, with a bearish move very likely on the cards that can push the price in its 13k’s.
We recommend patience and discipline. Don’t jump in any trade without a proper setup.
Trade with care.
Best regards,
Financial Flagship
Disclaimer: The analysis provided is purely informative and it should not be used as financial advice. Remember that you need a plan before you start trading; so, take this knowledge and use it as a guidebook that will ultimately help you understand the market and easily predict your next move.

The Black Penguin Waddle of 2021
The chart is one possible visualization of the confluence of unpredictable high-impact events. For example:
February 24th, 2020 World Health Organization declared the COVID-19 outbreak a pandemic and warned that "much of the global community is not yet ready, in mindset and materially,.." Over the following eleven months over 2 million lives were lost globally, more than 430,000 of the US.
Wall Street hedge funds lost billions by betting against a group of amateur day traders who banded together on social media to execute a short squeeze. They sent shares of depressed companies like ( GME ) GameStop and AMC ( AMC ) up into the stratosphere, hurting the billionaire hedge funds that bet against those stocks. Called by some "The Grand Awakening" It was an unprecedented attempt to compete with the pros on Wall Street. The action raised questions of equity and policy reform to ensure a more level playing field.
1) The Black Penguin evokes the Black Swan* symbol from the 2007 book by author and former options trader Nassim Nicholas Taleb. The symbol of the Black Swan represents the extreme impact of rare and unpredictable outlier events.

Nasdaq - What to do next?!Nasdaq NDX - What bearish moves we had on the indices yesterday!
I will now explain why we had this move:
1) FOMC FED - Rates kept as same, nothing new in that aspect. During Questions - We had now the mention Taper tantrum was mention, that's a key word to keep in meaning they could decrease the amount of asset purchase that would increase yields further upwards. This is due to the vaccines, as long as that carries on further the deployment of vaccine , the economic data and other various other factors combined there will be less need for QE. However, I feel Q2-21 we will be following the same momentum as we was before. We've had a squeeze building for while and at this current moment of time that will ease pressure on various instruments.
2) Hedge funds Struggles
3) Disappointing Earnings
Fundamental:
- US Q4 Adv GDP: Jobless data.
Technical Aspect:
Pattern: We are still within the channel until broken to down side, bearish momentum confirmation continues.
Support: 12970, 12715, 12535, 12270 (50 EMA)
Resistance: 13170, 13275, 13595, 13840
Key Tip: Follow your own trade plan to add further confluence!
Overall, I did take scalp shorts whilst FOMC on US Indices & other currencies, I expect this to be a temporary move.
All the best,
Trade Journal

SPX Shaping up for the bearish sell
Hello traders:
Looking at SPX here for further development on the bearish move.
We see the price action had a bullish push up breaking previous highs.
However, price did not continue with continuation corrections, instead we see the bearish move down on the LTF.
This is a good indication that the bullish momentum is exhausted, and we may see the reversal happening in the coming days/week.
Wait for this LTF correction to develop and finish before getting in the sell.
Thank you

DOW waiting for bearish correction to completeHi traders:
Looking at DJI for the bearish reversal in the up coming days/week.
Overall looking at the price action, we see DOW has hit the all time double tops, and price is showing reversal price action on the LTF.
Price had a push up, but failed to continue higher with any bullish correction.
Instead, we see a short bearish push down from that area, and a correction begin to form.
Key here is to not jump in right away, rather wait for price to develop and structure to complete for the sell.
Thank you

NASDAQ RALLY TO CONTINUE?IM jumping back in us100 as i expect it to spike on dollar fall at some point this week. head and shoulders reversal on 30m

$SPX - It formed a Symmetrical triangleHello everyone!
When the world goes lockdown on Wave 2, the US remains in lockdown since March, and guess what, it was a pretty damn good March to November for the US Indices.
Despite losses in major fields, tech companies showed significant growth and revenue, pharmaceutical companies were on the spot as well, and in general despite DXY dropping since then, SPX for example pumped up higher than ever this year, so I'm guessing if we are going to see more surprises in the market.
From the technical point of view, I think the wave count might be incorrect because of the curve-shaped previous impulse, though looks perfect to me, but in general the direction is right.
SPX is about to break out of the triangle and move towards new highs, which I'm guessing could be 3600. Though before we get super excited and place long on SPX here, I'd highly recommend to see the next actions inside the triangle.

S&P-500 - will there be Monday panic before elections?Very important how US indices will close today. All week long we had a non-stop selling , and if today we get the close at the lows (ideally close to support line), I would not be surprised to see strong follow through on Monday as well, even gap lower and limit down maybe.
Prices often continue trending on Mondays in the same direction as Friday close. So given it will be 1 day before most important and unpredictable elections in recent history (and I am not even speaking COVID here), a lot of investors might decide to rush for the way out all at once, especially, if today is another ugly day in the making...

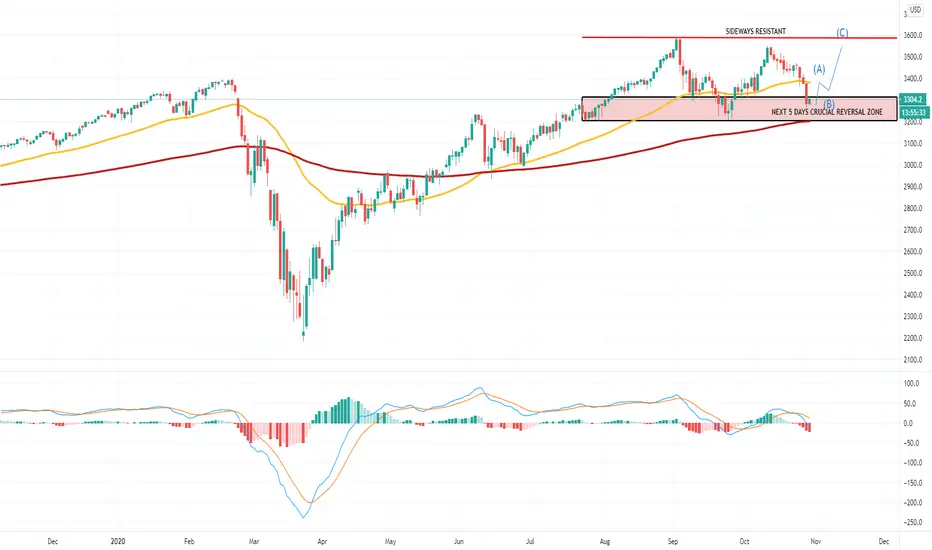
U.S S&P 500 index a boo?U.S S&P 500 Index.
- Retraced from its sideways resistant.
- Broken down below its Mid Term Trend.
- Its next 5 days crucial reversal zone will be important to take note.
- A break down below this zone will also mean breaking down below its Long Term Trend (Red Line) will spark a Bear Market.
- A recovery above this zone and above its Mid Term Trend = Super Bull Run remains intact.
NAS100 SHORTNASDAQ has made a run towards the trend line and looks to have broken a wedge which i shall post on the 15m timeframe after this post.


NASDAQ 15M ENTRYLooks really nice to short here after printing a high and rejection of trendline and what appears to be the break of a wedge. rvi bearish cross

NASDAQ - WEEKLY PREDICTIONA lot going on here, both technically and fundamentally. Any trades taken will look to move stops to entry for risk free trading ASAP given the volatility of election season and Covid resurgence. We cannot control any fundamentals, but we can control our risk management.
Firstly, on the weekly we can note the potential wick rejections forming a Double Top.
Drilling down to the Daily, we can see the descending channel and also the current area is very much a no trade zone where price needs to decide it's next move.
Close below support and grey zone on the daily see's sells to the red line, next support.
Buys on break of the channel and both near term fib levels to retest the 61.8% fib and daily resistance.

NASDAQ - WEEKLY OUTLOOKTECHNICAL POINTS:
4HR resistance
4hr Fib
Daily fib (50% lines up with 4hr resistance)
Daily support
4hr Head and shoulders
Buys:
Close above 4hr resistance invalidating H&S
Sells:
Wait for rejection around 11,400 in line with left shoulder. Failing that, break of the neckline.

Nasdaq - Trade opportunity! Short term trade idea:
Pattern wise within Nasdaq - Double bottom, measuring it comes to 38.2 Retracement of Fibs which is matches nicely key retracement area.
Above 11270 Area bullish with the resistance areas of: 11480 - 11560 - Target area for double bottom = 11815 - 12000 area.
Below 11085 Area Bears could come in control with key support areas of: 10930 - 10711
Medium term: I am bearish US Indices, Precious Metals, EUR, AUD, NZD - This would be a counter trend move, please use appropriate risk management.
Target for EUR - Low ends of 1.16 to 1.15 area to position for longer term EUR target of 1.22/1.25
All the best,
Trade Journal
Remember: Just a trade idea, not a recommendation.

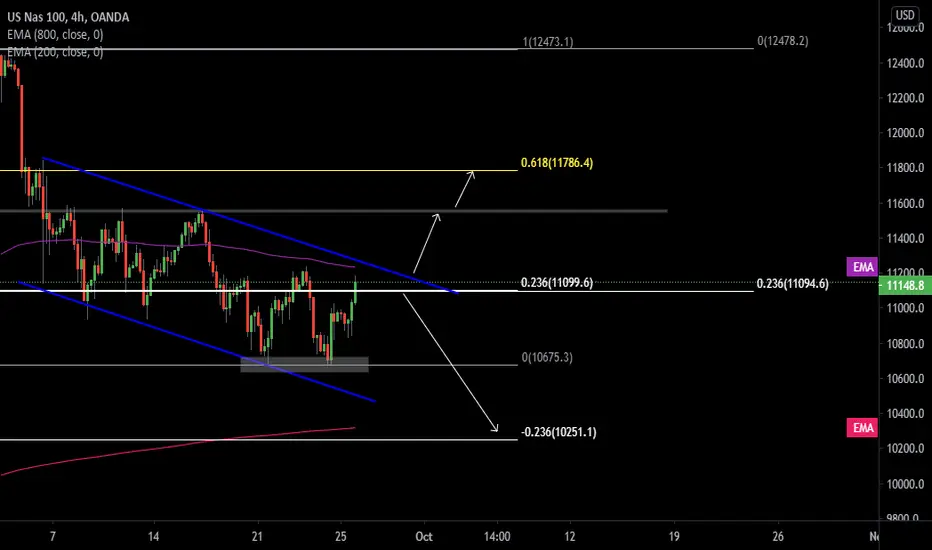
NASDAQ - WEEKLY OUTLOOKTechnical:
Weekly Fib
4hr Fib
4hr Descending Channel
4hr Double Bottom
200ema as ceiling
Buy Entry:
Descending channel broken on 4hr
Break and close above both 23.6% fib levels
Close above 200 4hr EMA
Confirmation of double bottom if price breaks previous lower high @ 11,200.
Target 61.8% 4hr fib for around 500 points
Sell Entry:
Close back below both 23.6% Fib levels
This will also confirm structure with another lower high
4hr channel holding
Targets - -23.6% fib on 4hr as well as the 800 4hr EMA for around 600 points.
US30/DJ30 Weekly OutlookTechnical:
Daily ascending trendline
Weekly fib
4hr fib
4hr descending channel
Buy Entry:
Close above 78.6% weekly fib level
Close above 23.6% 4hr fib level
Close above 27,500 breaking LH/LL structure
Break of descending channel
Target - 4hr 61.8% Fib for around 600 points
Sell Entry:
Break of daily ascending trendline
Close back below both fib levels
Target - 4hr -23.6% fib for around 600 points

SP500 WEEKLY OUTLOOKTechnical:
Weekly Fib plotted
Daily support area
Falling wedge
4hr Fib plotted
Entry Buy:
Break of channel
Close above 4hr 23.6% Fib
Close above Key 3300 level
Target - 4hr 61.8% FIb level around 40 points
Entry Sell:
Channel holding
Close below weekly 23.6% Fib
Close below daily support
Close below 3200
Target - Weekly 38.2% Fib around 100 points

#NASDAQ - Inverted head and shouldersHello guys! There is a possible H&S pattern on 15M chart of NDX.
Wait for the breakout of the neckline for confirmation.

NASDAQ 100 at key levelPrice is now consolidating below the key 11000. If we look at Elliott wave analysis, this should be the top. However, this summer showed the exuberance of greed and addition of retail traders like Robinhood, shifted the balance making retail trading almost 25% of all trading in the world. So while I am still advocating for a tech bubble burst, it may come later. Still appropriate to look for reverse patterns on 1 and 4 hour charts. A break of 11000 and close of the daily candle would indicate further buying momentum. This year has been truly astonishing.
Please support the idea and share your thoughts on NASDAQ 100!
Good Luck and Stay Healthy!

NASDAQ Divergence on the Daily chartTake a look at the divergence that happened in February 2020. Well that same divergence has happened once again in a similar scale so we can expect a similar type of sell off. Not to mention how overbought the Nasdaq is doing, many will take this as a sign to take their profits.

DOW JONES Trading planPattern: Channel Up on 4H.
Signal: Bullish on every dashed line.
Target: The two Resistance levels 26,790 and 27,640.
** Please support this idea with your likes and comments, it is the best way to keep it relevant and support me. **
