Remains Below 1.3700 Ahead of CPI Data from the US and CADUSD/CAD Remains Below 1.3700 Ahead of CPI Data from the US and Canada
USD/CAD continues to decline ahead of inflation data from both the US and Canada.
The US inflation rate is expected to rise to 2.7% year-over-year in June, up from 2.4% recorded in May.
Meanwhile, Canada’s CPI is forecasted to increase by 1.9% year-over-year in June, up from 1.7% in May.
USD/CAD is trading around 1.3690 during the European session on Tuesday, following two days of gains. The pair is declining as the US dollar (USD) continues to weaken ahead of the June CPI data from the US. The inflation figures will provide new insights into the Federal Reserve's (Fed) monetary outlook.
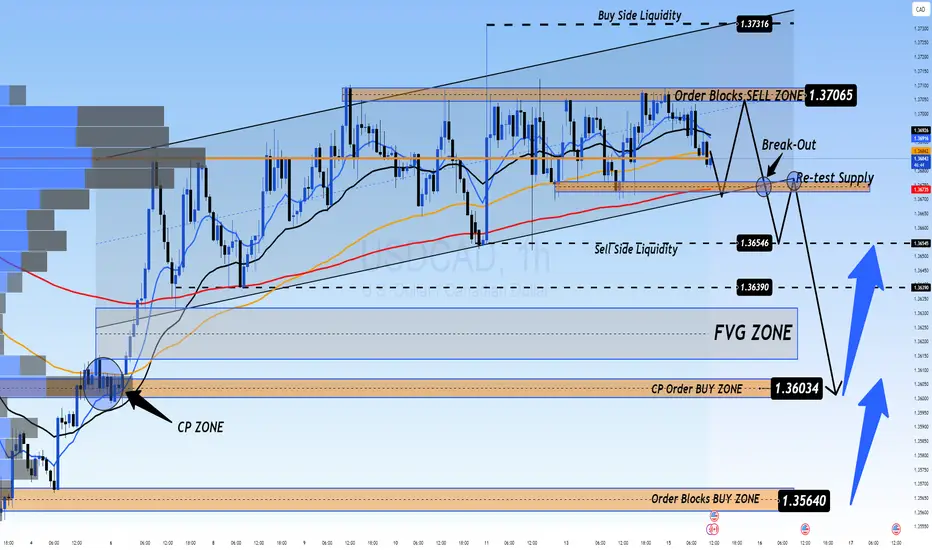
📉 Market Outlook for USD/CAD – Possible Drop on CPI Release
The USDCAD is still in a downtrend, and a sharp drop could occur with today’s CPI data release. Currently, there are two Buy Side Liquidity zones above and Sell Side Liquidity below, with the price balanced around the VPOC zone, which will soon decide the direction after the CPI announcement today.
Market liquidity still holds a FVG below, and with CPI data expected to favor USD, this could trigger a sharp drop towards this liquidity zone, possibly nearing CP OBS at 1.3600, followed by a potential rebound.
If price breaks CP zone, it may head toward a strong OB zone near 1.35xxx. Therefore, caution is advised when monitoring these OB zones.
🎯 Trading Strategy for Today
🟢 BUY ZONE: 1.36000
SL: 1.35500
TP: 1.36500 → 1.37000 → 1.37500 → ????
💬 What are your thoughts on USD/CAD ahead of the CPI data release? Do you expect a strong bounce or a continued decline? Share your views and join the conversation below!
👉 Follow for more updates and insights, and join the community to discuss real-time market moves!
Usinflation
Just got the May US CPIs. PPIs next...Here is the reaction in the US instruments to the numbers. Let's dig in.
TVC:DXY
TVC:DJI
MARKETSCOM:US500
MARKETSCOM:US100
Let us know what you think in the comments below.
Thank you.
77.3% of retail investor accounts lose money when trading CFDs with this provider. You should consider whether you understand how CFDs work and whether you can afford to take the high risk of losing your money. Past performance is not necessarily indicative of future results. The value of investments may fall as well as rise and the investor may not get back the amount initially invested. This content is not intended for nor applicable to residents of the UK. Cryptocurrency CFDs and spread bets are restricted in the UK for all retail clients.

NZDUSD Analysis for 16/10/2024: Slight Bullish Bias ExpectedIntroduction
As of 16th October 2024, the NZDUSD (New Zealand Dollar vs. US Dollar) pair shows a slight bullish bias in today’s trading session. A combination of fundamental factors, economic data releases, and market sentiment are all playing a pivotal role in driving this price action. In this article, we will break down the key drivers for the potential bullish trend in NZDUSD today, with a focus on the latest developments in the global economy, central bank policies, and market conditions.
Key Drivers for NZDUSD Bullish Bias
1. New Zealand Economic Data Strength
One of the primary factors contributing to the slight bullish bias in NZDUSD is the recent release of positive economic data from New Zealand. Key indicators such as GDP growth and retail sales have come in stronger than expected, supporting the NZD. The New Zealand economy continues to exhibit resilience despite global challenges, and this has attracted investors towards the Kiwi dollar.
In the latest report, New Zealand’s consumer sentiment index showed improvement, reflecting increased consumer confidence. This suggests that domestic demand is picking up, which is supportive of the New Zealand Dollar’s strength. As a result, this economic optimism is likely to boost NZDUSD.
2. RBNZ Hawkish Stance
The Reserve Bank of New Zealand (RBNZ) has maintained a relatively hawkish stance, signaling a possible interest rate hike in the near future to combat inflation. Although inflation remains elevated globally, New Zealand’s inflation figures are closely monitored by the RBNZ, and the central bank is prepared to act if needed. A potential rate hike would increase the attractiveness of the NZD in the forex market.
The US Federal Reserve, by contrast, is leaning towards a more neutral stance, with expectations that interest rates may have peaked for the time being. This divergence in monetary policy between the RBNZ and the Federal Reserve is providing support to NZDUSD, as a more hawkish RBNZ outlook favors the New Zealand Dollar.
3. US Dollar Weakness
On the other side of the equation, the US Dollar has experienced some softness amid mixed economic data and shifting market sentiment. The recent US CPI (Consumer Price Index) report showed inflation cooling, reducing the likelihood of aggressive Federal Reserve tightening. As inflation shows signs of easing, investors are beginning to price in the possibility of a Fed pause, which has led to USD weakness.
Additionally, political uncertainty in the US, particularly related to fiscal policy and government shutdown risks, is weighing on the USD. The combination of a potentially dovish Federal Reserve and domestic uncertainty is making the US Dollar less attractive, boosting the NZDUSD pair.
4. Global Risk Sentiment
Risk sentiment in global financial markets is another critical driver of NZDUSD. As a commodity-linked currency, the New Zealand Dollar often performs well when risk appetite improves. Today, we see a more optimistic tone in equity markets as investors respond positively to the easing inflation pressures in the US and signs of stabilization in global growth. This “risk-on” environment typically benefits the NZD, and we are seeing this reflected in the slight bullish bias for NZDUSD.
Moreover, China's economic stabilization efforts, especially in the property sector, have provided additional support for commodity-exporting countries like New Zealand, bolstering the NZD.
5. Technical Outlook
From a technical perspective, NZDUSD has been testing key support levels in recent trading sessions, and a bounce from these levels is likely to fuel further upside. The 50-day moving average (MA) has recently crossed above the 200-day MA, forming a bullish “golden cross,” which is a positive signal for further upside movement in the short term.
In addition, RSI (Relative Strength Index) readings are indicating that the pair is not yet in overbought territory, suggesting more room for the bullish momentum to continue.
Conclusion
In summary, the NZDUSD pair is expected to maintain a slight bullish bias on 16th October 2024, driven by several key fundamental factors. Strong New Zealand economic data, a hawkish RBNZ stance, US Dollar weakness, positive global risk sentiment, and favorable technical signals all contribute to the optimistic outlook for NZDUSD today. However, traders should remain cautious of any unexpected developments that could shift the market sentiment.
Keywords: NZDUSD, New Zealand Dollar, US Dollar, Forex Analysis, 16th October 2024, bullish bias, RBNZ, Federal Reserve, US inflation, interest rates, forex market, technical analysis, risk sentiment, currency trading, New Zealand economy, NZD strength, TradingView analysis, forex forecast, USD weakness.

GBP/USD Analysis: Slight Bullish Bias Expected on 14/10/2024The GBP/USD pair is expected to show a slight bullish bias today, supported by a combination of key fundamental drivers and technical factors. Traders and investors in the forex market should remain vigilant as several economic data releases and geopolitical events could shape the pair’s movements. Below is a comprehensive analysis highlighting the key factors driving this potential bullish bias for GBP/USD.
1. UK Economic Outlook
One of the major drivers for a possible bullish momentum in GBP/USD is the recent strength in the UK economy. Despite some challenges in the global economic landscape, the UK has shown resilience, particularly with stronger-than-expected GDP growth and robust retail sales. UK inflation remains elevated, with the CPI figures suggesting sustained price pressure, which could prompt the Bank of England (BoE) to consider further tightening measures. A hawkish stance from the BoE, which is already maintaining higher interest rates, would support a stronger pound, adding to the bullish sentiment in the market.
2. US Dollar Weakness
The US dollar is showing signs of exhaustion after a prolonged period of strength. USD weakness is being driven by softer inflation data, with the recent CPI report showing cooling price pressures in the US economy. The Federal Reserve may lean toward a more dovish stance, refraining from further aggressive rate hikes. This has caused the dollar to lose some of its safe-haven appeal, providing room for the pound to gain ground against the greenback.
3. Geopolitical Risks and Market Sentiment
The broader market sentiment is being influenced by geopolitical tensions , especially in the Middle East and Europe. Risk-off sentiment tends to favor the US dollar, but given the recent easing of these concerns, market participants may shift back to higher-yielding assets like the pound. A relief in risk sentiment can boost the GBP/USD pair, pushing it toward higher levels.
4. Technical Analysis of GBP/USD
On the technical front, GBP/USD is trading above its 50-day moving average, indicating a bullish trend in the short term. The pair has found strong support around the 1.2100 psychological level, with upward momentum suggesting a test of the 1.2250 resistance level. RSI (Relative Strength Index) is trending upwards, confirming the bullish bias, while MACD (Moving Average Convergence Divergence) also shows strengthening momentum.
5. Key Data Releases to Watch
Traders should keep an eye on upcoming data releases for further clues on the GBP/USD trajectory:
- UK Unemployment Rate: A stable or better-than-expected figure could lend support to the pound.
- US Retail Sales: Any softness in the US retail sector could further weaken the dollar.
- BoE Governor Bailey's Speech: Any comments on future monetary policy tightening could provide additional bullish support to the pound.
Conclusion
The GBP/USD is expected to exhibit a slight bullish bias today, driven by strong UK economic fundamentals, cooling US inflation, and broader market sentiment. The technical setup also favors upside potential, with the pair poised to target higher resistance levels. However, traders should remain cautious and monitor key data releases that could shift market dynamics throughout the day.
Keywords for SEO Ranking:
- GBP/USD analysis
- GBP/USD bullish bias
- UK economic outlook
- USD weakness
- Bank of England rate hikes
- UK inflation
- US inflation
- US dollar outlook
- Forex trading strategies
- Technical analysis GBP/USD
- BoE monetary policy
- Federal Reserve rate decision
- Geopolitical risks forex
- Trading GBP/USD in 2024

US & Headline CPI - October Release/Overview US CPI
US Headline and Core CPI for October both came in lower than expected (decrease).
US Headline CPI:
YoY – Actual 3.24% / Exp. 3.3% / Prev. 3.7% (Green on chart)
US Core CPI:
YoY – Actual 4.02% / Exp. 4.2% / Prev. 4.13% (Blue on chart)
The chart below illustrates the direction of the current YoY down trend for both Headline and Core CPI however we are still not at the historical moderate levels of inflation desired. You can see these moderate levels of inflation between 1 – 3% from 2002 – 2020 below.
Nice to see the Core CPI come down, almost down, into the moderate historical averages
PUKA

World Wars & US Inflation From 1914This is the US Inflation Rate (YoY) from 1914 until 2022.
Symbol is called USIRYY and it measures the Inflation Volatility in the United States.
With the War going on in Ukraine, and Russia trying to force its way through, I took the liberty of looking into the following:
- How Global Wars Affect Inflation
- How US Inflation Reacts to External Wars
- How Wars Affect the Financial Markets
You can see the time-lines, it's all laid-out in the chart (graph).
I took all the Major World Wars and events that significantly affected, not only the US Inflation, but Inflation itself.
First of all, the US Inflation Rate (USIRYY) tells me the following:
* When the US was involved in a War, we can notice that the US Inflation spiked.
* Most of the times when US was not involved in an External War, then Inflation dropped.
That's because of War & Uncertainty Sentiment around this "terrific" word.
War does not bring anything good, in fact, in only brings bad times.
People die and global sentiment gets super-negative.
This of course, leads to... you guessed it: Market Crash.
Why? Because after or during times of War, there are Recessions and Depressions.
Supply Chains are disrupted and the Global Economy falls on its face.
What about looking at things from a Technical Analysis perspective?
* Symmetrical Triangle: and the only way is UP!
I will give you points which I believe are worth keeping in mind for the next Market Crash.
First of all, let's be logical about this.
Winter is coming and it's only gonna get worse before it gets better.
As Inflation spiked to a 40y high, the higher powers intervened, in an attempt to cool the Inflation spike off.
I'm talking here about the Federal Reserve (FED) ramping up the Interest Rates.
This is the Effective Federal Funds Rate (FEDFUNDS).
Can you see the break-out?
They want to calm down Inflation, but they can't.
Why? Because this is no ordinary Inflationary period, it's a long-lasting thing.
One of those hyperinflation, deflation, stagflation, or whatever the heck these experts call it... :)
The Volatility Index (VIX) tells me that another spike in Fear Sentiment is inevitable.
I'm in love with Elliott Wave Analysis, so I labeled this next chart.
This is the United States Consumer Confidence Index (USCCI) and it measures exactly what its name says, LOL.
When it drops, people are freaking out. When it rises, people are optimistic and the Markets are going up. Daaaa!
With all that said, what's the bottom line here?
I believe that periods of terror are gonna hit us all.
Are we having World War 3? Who the heck knows?
All I know is that there are more pieces to this puzzle:
United States 10Y Bonds (USB10YUSD) have reached the Support, and a spike bigger than the Covid Pandemic has started:
The 10Y Treasury Note Yield (TNX) have broken out of a 40y down-trend:
Isn't it ironic how it synced with the Inflation 40y high?
Damn!
Germany 40 (DAX, GER30, GRXEUR) is doomed.
Fractal sequence, Descending Channel, and a "beautiful" ABC Elliott Wave Pattern.
So, how can you prosper from all this?
Metals could be a good hedge.
Gold (XAUUSD) just broke out of an important Bearish Structure.
Maybe it will go up.
Natural Gas (NG1!) & Crude Oil (USOIL) however, are showing Bearish Reversals.
Bitcoin (BTCUSD) is Bearish until further notice as well.
But this may become the new currency moving forward.
In times of terror, the banking systems might need to change.
Cash and Card is so '00.
WHAT'S YOUR TAKE? WAR OR PEACE?
Leave your commend down below.
Cheers!
Richard

The end of the fiat experiment, USA Hyperinflation / WAR
This will be just insane to watch unfold month by month take a look.
Adjust the US GDP to USM2 (Money supply growth) the US has not experienced real growth since the 1999, pretty alarming. Adjusting the SPX to the M2 the SPX has actually not experienced growth either.
Forced to sanction the Russian Ruble (creating an excuse) to stop Russia gaining an advantage, CNY well we know what happen to them. EUR forced to print adopting countries into the EURO system.
Now the FRED what just figured out this all leads to hyperinflation even BEFORE the QE policy?
Very very coincidental that when the USA tried to avoid this scenario in 2018 by quietly raising rates, China happens to leak something that would completely throw the entire world off throwing the USD/EUR into quantitative easing policies, China would have known a lockdown event would trigger lockdowns and QE and put the USA / EUR system in a place worse than ever.
coincidence I think not.
Where does this leave the future? when the DXY starts to fall, Money Velocity starts to rise as assets are liquated back into the US economy at the same time. This will be from the EU and JP ramping up Yield curve control, the US will have to start engaging in Yield Curve Control for US yields as you can clearly see its not an inflation problem causing yields to rise, its the doubt the US economy, yields could start leaping to 7% - 15% this can't happen because then the US government will default.
Pointing heavily to an all out war with Russia / China vs US / NATO.
Either the world splits up into 2 system East / West separated economies or there's going to be a fight, and the country in the worst position has the biggest military arsenal and capabilities in the world.
No point not buying Bitcoin at this point, either Bitcoin is the miracle to stop this or we no longer exist.

AUDUSD Short Trade Idea: High U.S. Inflation and Hawkish FedThe AUDUSD pair is currently under pressure as a result of stubbornly high U.S. inflation and signals from the Fed that interest rates may need to be raised for a longer period than previously anticipated. We are looking to take a short trade on AUDUSD at 0.68977, with a take profit target at 0.67519 and a stop loss at 0.70014. This trade idea is based on the potential for the U.S. Dollar to continue to strengthen, while the Australian Dollar may weaken due to concerns about containing inflation. #AUDUSD #shorttrade #USinflation #hawkishFed #tradingstrategy 📈📊💰

DXY Still Strong UptrendDXY still Strong Uptrend with 3 CandleS Daily Strong Bullish.
If price breakOUT Supply Zone, then DXY will continue up until 116 as Target #1.
As we know The Fed will continue raise the interest on 3rd Nov 2022, I will update the DXY Daily Chart to you periodically.

USIRYY analysis for crypto market#USIRYY
All eyes on US inflation Rate (9.10) 🧐
Long Story short Expectation is 8.7%
🐻 - if new CPI data is above 9.4 then Market will Crash.
🐮 - if Remain between 9.1-9.4 then Market will be Stable and can Pump as well.
🐮🐮 - if below 9.1 then Crypto Market will Pump Hard.

US Inflation.US inflation is very correlated with the extreme rallies we have seen in US stocks, Oil and crypto, FED are increasing rates frequently to counter this abnormal levels inflation show as the bar graph in my chart, one thing that is going to directly affect asset prices is rates, the dollar should look to gain strength too. So increased Inflation will see rising asset prices, and a falling inflation should drop asset prices from their highs. FED are beginning to try tackle the major inflation seen in the US, and the market conditions are going to change, so be prepared and manage your risk very safely, these coming market conditions are going to be a tough sea in my opinion.

Out of the Box chart !!!US Inflation has reached falling trendline where it has faced resistance
for three times.
Also, RSI has reached the upper range from where reversal is witnessed.
But, if it gives breakout above this trendline then the doors of huge upside will
be opened, as it's a symmetrical triangle pattern whose targets are huge.
Rising inflation is never favorable for stock market so it's a sign of caution.

US30 THE DOW 30 CRASH, ONE YEAR LATER UPDATE Last year May we saw a potential crash for the Dow Jones 30 due to inflation fears
and now what we predicted is finally happening.
In our analysis a year ago Dow 30 was trading at 34,644 after reaching highs of 35100
we saw a potential sell signal on the 1W chart which was the formation of a bearish harmonic.
this halted our longs and swings on the Dow.
So what is Fueling the Dows Crash at the moment?
Same thing which was fueling it about a year ago, inflation fears in the US.
US investors have lost their trust in the Fed's ability to control inflation even
with the current 75 basis points interest hike we saw this week during the FOMC on Wednesday
to try and curb inflation, investors believe that the Feds tools have failed. Recent data has shown
that inflation is now at its highest in the last 40 years in the US and analysts have predicted
a decline in US GDP in the next coming years
meaning the US could be facing a recession or is already in one.
WHAT TO EXPECT
Currently @ 29,900
Next support for Dow 30 is 29,500 so we expect it to reach this support level before short term
retracement back to +30,000
Looking at the Covid Crash we expect Dow 30 to fall at least 10,000 points from its highs which were at 36,400 meaning
We expect Dow 30 to reach 26,000 before any reversals,
Our initial target from a year ago was 23,500 and we still think this might be a possibility.
Our positions
Active sell positions @ 31,600 & 31,300 from our last analysis link is attached below
New positions
Sell Limit @ 31,000 TP @ 30,000
Sell Stop @ 29,000 TP @ 28,000
Sell Stop @ 28,000 TP @ 27,000
Buy Stop @ 30,100 TP @ 30,600
Buy limit @ 29,500 TP @ 30,000
Buy limit @ 26,800 TP @ 28,000
Buy limit @ 23,700 TP @ 33,000
Note these are low risk entries
link to previous analysis attached below
Note: this is just an analysis based on technical analysis & current events. All investments involve risk, our analysis and trading strategy does not guarantee future results or returns. Investors are fully responsible for any investment decisions they make.

GOLD ANALYSISEarly Friday, gold futures are trending lower as U.S. Treasury yields and the dollar remain steady amid increased expectations that the Federal Reserve would use aggressive rate hikes to combat inflation.
This thinking is being sparked ahead of today's U.S. inflation figures, which could reveal information about the Federal Reserve's monetary policies in the future. Traders are particularly interested in confirmation that the country's decades-long high inflation rate peaked in March. However, some doubters believe this is unlikely due to the recent spike in crude oil and gasoline costs.
Labor Department's Consumer Price Index (CPI), which tracks the cost of a basket of items to urban consumers, is expected to accelerate to 0.7 percent from 0.3 percent. When food and energy products are removed, the CPI is expected to cool a nominal 0.1 percentage point to 0.5 percent.
Year over year, the consensus expects headline CPI to remain at a blazing 8.3 percent, with a "core" CPI reading of 5.9 percent, a welcome 0.3 percentage point decrease.

Has US #Inflation Peaked in May 2022?ECONOMICS:USIRYY A 107 year old interesting US Inflation rate chart from 1914. Technically speaking, inflation has come to an interesting range.
#USINFLATION
#INFLATION
#STOCKS
#AHMEDMESBAH
