SPX RALLIES ON IN FEB 2021Short term composure has been regained by the long signals issued on 020221(4hr) and 040221(daily) charts targeting new highs. The long and medium charts are still in a strong uptrend.
PIVOT 3692
LONG POSITIONS ABOVE 3692 TO NEW HIGHS
SHORT POSITIONS BELOW 3692 TO TEST 3553 AND 3454
Usmarkets


SPX bullish close for 2020The SPX closed bullish for all time frames including the monthly charts that leads the way for more gains into 2021. New all time highs are expected in the first trading week of 2021.
Short term Pivot is at 3725.
A break of 3725 will test 3653 and 3508

Buy United parcel services ups at current priceIt is a very good opportunity for who invest in us market. This give 40% return in 2 to 3 weeks

SPX RANGE 3590-3731 The SPX is in a range between 3590-3731 since 091220.
A short signal has been issued on the 211220 at 3691 targeting 3590.
PIVOT 3731
Short positions below 3731 targeting 3590 and 3317
A break above 3731 will test ALL TIME HIGHS.

SPX PERSISTENT BULLISHNESS PIVOT 3686A Long signal on the 4hr was issued on the 161220 after a brief dip to 3629 setting another All time high at 3733. Will multiple time frame bullishness, we expect a strong close into the year end
PIVOT is 3686
A break below 3686 will see 3590 then 3487

SPX bullish Dec Opening. Pivot at 3655The SPX is bullish on ALL time frames and appears to have broken the Monthly Supertrend Line at 3655 into December 2020. Price must close above 3655 on the 1st of Jan 2021 to confirm the next long term Up Leg of the SPX over the next few months.
Pivot is at 3651
A break of 3651 will test 3557 and 3466 to the downside.
Price holding above 3651/4hr Supertrend line in the coming week will see new All time Highs.

How high can the market go? Gold XAUUSD AnalysisTrading Idea: Long
Buy Area below: $1,770
Stop Loss: $1,735
Take Profit: $1,880
Today Gold reached levels below $1,770, before bouncing back above $1,800. It lost a bit more than 14% since the last surge marking an all-time-high level above $2,070.
Investors turned to riskier assets since the popular vote chose Biden as the 44th President of the USA. On the Monday that the the results were confirmed the markets surged and Gold took the bears having the first hit which continued with a bloodpath as Pfizer announced positive news for their early results from the coronavirus vaccine trial with their 90% effectiveness.
Optimism continues with more Companies releasing covid-19 vaccine effective rates and countries laying out their plans on distribution dates to citizens.
At the same time those events could either be the prophecies that things are actually going good or smoke around the huge bubble before a highly anticipated crash of the markets.
Fiscal and monetary policies are testing the nerves of the markets.
The world economy is standing on stimulus plans.
How high can the market go?
On Tuesday, one day after Cyber Monday and Black Friday, the markets surged and visited uncharted territory. This makes it a good potential opportunity to go long and find support levels to enter. You can see our support and resistance levels indicating the area the market will be bouncing within the borders.

Dow Jones 30.000 this Year?I would provide here my view on the Dow Jones for the next few Weeks. I think the picture speeks for itself.

Nasdaq in the next Bullrun?I would provide here some Options for the Nasdaq in the next few Weeks. I think the picture speeks for itself.

S&P 500 - Loosing momentum RSI suggests that we have bearish days ahead of us; maybe weeks!
4-hr chart just declined breaking out the (white) resistance trend line.
Also, double TOP is observed.

SPX BREAKS 3333 TO TEST 3176A broad sell off across the globe started on the 281020.
This sell off spark the SPX to break its Supertrend line at 3333 opening the door to its weekly Kijun support at 3176.
The short signal was issued 2 weeks back on the 4hr chart at 3482 on 151020.
On a birds eye view, the MT and LT outlook of the SPX is still uptrend.
This move towards 3176 is ST in nature and corrective. 10% corrections are normal in the course of market lifespans.
A break above 3389 will resume ST uptrend.

Oil Bearish - MY BEST ANALYSIS SO FAR!!This is a retest of the Hell that broke loose. Ask youself a question...If there was that much selling here, what's the probability that price will fall big the next time price comes here again? If the answer is more than 50.1%, you should probably take the trade. Price might not be guaranteed to fall as far but you've got a clear signal that you could bank at least a little profit in this area.
This is what trading is. A game of probabilities. Your job is to trade at times where there is the most probability of price moving big, in a certain direction.
Naked trading is just that simple. Trading the bigger timeframes helps keep the markets in perspective.
The SECRET is to get out of a trade that looked good but isn't so good after a while. You've got to be disciplined when you know you just need to take the loss. Like in a relationship lol...ALWAYS WIN bigger than you lose!
YOU ALL CAN DO THIS! You can use trading to change your life & everyone around you!

SELL ZN1 in the next RED VOLUMEHello Friends
*****
the ZN1 market is in an uptrend
followed by a green volume increase at the bottom
and wick candle at the top of vwap it means that the market is going to bear
=> it's a sell signal
so you can sell and get out in the next red volume
THANK YOU
ATSELECTION

CCL Carnival Corporation with good bullish opportunity $CCL is trading on the lower boundary of the projected PEAD cone with good room towards the Median line making for a possible bullish move

ADVANCED MICRO DEVICES, INC. Bullish move (EPSMomentum)$AMD is looking good with positive EM Score, EM Bias and Earning momentum.
price is trading well within the projected range with a potential of a 12.63% to the upside if it closes on the mean by the next earning.
Check EPS Momentum for more details on our stock scoring and screening system.

SP500 Bouncing among support and resistance Market broke previous all time high and made new one. Election euphoria is coming next month with trade deal and corona virus vaccine.

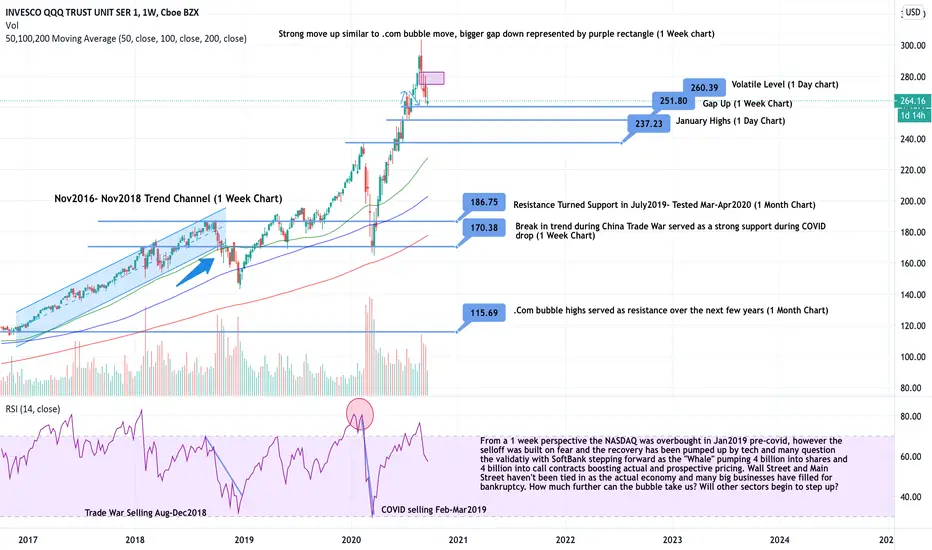
QQQ All-Time LevelsIn an uncertain market it is hard to find footing. NASDAQ:QQQ is currently testing a jumpy support level right now. The biggest factors that will play into the outlook of the NASDAQ and the market as a whole is government stimulus and the upcoming election. Many analysts are comparing this years election to Gore-Bush election and the uncertainty could be detrimental for our market. If support begins to break and there is no positive news on a COVID vaccine, QQQ could face some major downside before leveling out. Many analysts have also compared the boom in tech "post-COVID" to the .com bubble in 1999. Furthermore, the news of Europe begining to take preventative measures is creating more fear globally. If the market doesn't quickly move to fill the gap down or support is broken there is room for a lot more sell-off. It's a long way down.
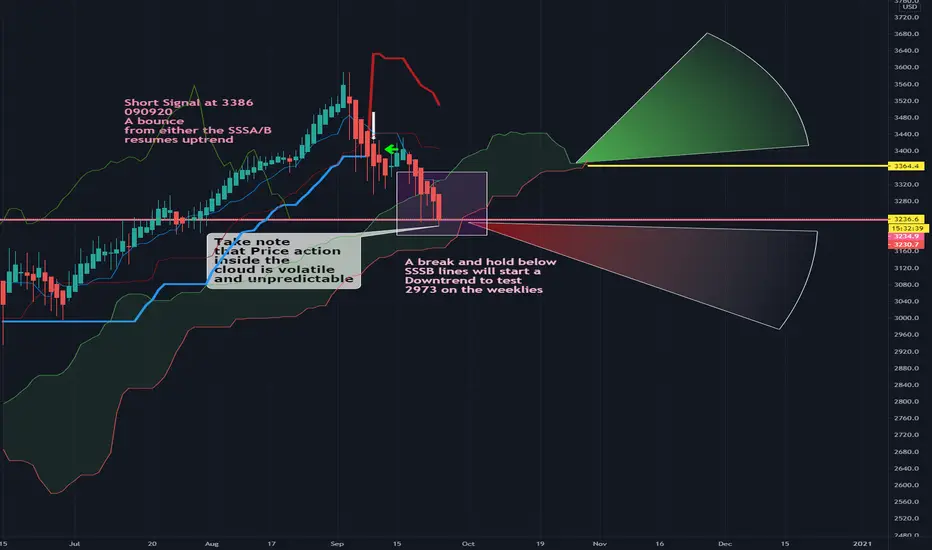
SPX weakness intensifies ST. Price into the Daily Cloud.The short term weakness on the SPX persists since the short signal was triggered in the short term on the 4th of Sep 2020. The uptrend starting on the 25th of May 2020 the daily charts has taken a pause. Price now will test the downside on the SSSB (RED LINE) on the cloud.
A break and HOLD below the SSSB cloud will start a new downtrend in the MT. The downside target remains at 2973..
SPY fork pattern analysisI published another fork pattern idea earlier today (see related idea) on the daily chart pointing out how the fork patterns predicted the lasts 2 major market falls and the starting of the recovery after the previous fall and likely the point where recovery starts for the current fall (which was yesterday). I went to 1H chart to get a feel for where the market is going. You can see (for the 1st fork on th chart) the market fell when it reached the top fork line and that yesterday SPY went below the bottom fork line (for the second fork). The 3rd fork, meant to predict the market direction, is a bit premature: it's only based on 2 days of price action and it's rather narrow. Price action over the next days will likely go beyond the fork and will expand it. However, the fork may still give a valuable idea about the upcoming trend. Thus I predict that the SPY will reach the last red circle on the graph (when the last fork will reach the top line of the 2nd fork). That is around 342-343 on Oct. 13. As I said, this is preliminary, as the price action over the next days will likely expand the fork and thus, that point of intersection may come sooner. Whenever it comes, I find it rather likely that SPY will have a little, temporary fall at that point. That may happen instead when the last fork reaches the green line of the 2nd fork (where the 1st red circle is, around 339 price level on Oct. 7) but I find that less likely.
Conclusion: go long.
"Like it" if you like it! Add your comments, questions or concerns if you have any.
DISCLAIMER: Security trading involves substantial risk of loss. My analysis is not trading advice. Do your own research first and/or consult a financial advisor. I'm not responsible for any losses you may incur following my analysis.

SPY fork pattern indicating the fall ended and recovery startedIf you draw the highest resistance trend line since the recovery started (the blue line in the graph) and from the high before the last one (where the red line starts, on April 29) draw a fork to the last high on that resistance trend line (on June 28) and to the latest low after that high (on the green line, on June 29) this fork clearly shows that SPY fell right after it opened and went over the the upper fork line (on 9/2) and, if the pattern holds, yesterday when it went below the upper line of the fork will be the point where recovery starts and the market will go up.
Conclusion: go long.
"Like it" if you like it! Add your comments, questions or concerns if you have any.
DISCLAIMER: Security trading involves substantial risk of loss. My analysis is not trading advice. Do your own research first and/or consult a financial advisor. I'm not responsible for any losses you may incur following my analysis.

SPX correction intensifies in the short termA close at 3329 in the SPX sits exactly on the SSSA line of the day ichimoku cloud.
A test of the base of the cloud is imminent. The baseline forms support for now. The Teken level on the weekly charts is at 3350, this has been violated giving way to more weakness.
Bottomline: A resumption in the uptrend must see a bounce from Friday's close at 3329 to 3375 for the MT/LT uptrend to resume. A break and hold below the SSSB line on the Day charts may signal a corrective move to 2973, The Supertrend line on the weekly.

SPX UPDATE 140920 : SHORT TERM WEAKNESSShort term weakness on the SPX since the short signal on the 030920 continues to the new trading week of 150920 spanning 14 days. Short term support is now between 3150 - 3280.
A break of 3150 will see a corrective retreat on the weekly charts to 2973.
Alternatively, a break and hold above 3443 will resume the uptrend of the SPX on all time frames.
