Natural Gas | Oil | Dollar | Silver | Gold Price Forecast.Natural Gas | Oil | Dollar | Silver | Gold Price Forecast.
NYMEX:NG1! AMEX:UNG NYMEX:CL1! COMEX:GC1!
USO

Natural Gas | Oil | Dollar | Silver | Gold Price Forecast.Natural Gas | Oil | Dollar | Silver | Gold Price Forecast.
NYMEX:NG1! AMEX:UNG NYMEX:CL1! COMEX:GC1!

Gold | Oil | Dollar | Silver | Natural Gas July 2025 Forecast.Gold | Oil | Dollar | Silver | Natural Gas July 2025 Forecast.
NYMEX:NG1! COMEX:GC1! COMEX:SI1! NYMEX:CL1!

Gold | Oil | Dollar | Silver | Natural Gas July 2025 Forecast.July 2025 Forecast.
Gold | Oil | Dollar | Silver | Natural Gas
NYMEX:NG1! COMEX:GC1! COMEX:SI1! AMEX:UNG

Sudden Oil Spike - what you need to know!Iran suspended cooperation with the U.N. nuclear watchdog, amid a surprise build in US crude inventories.
Iran’s move added a modest risk premium to prices, though analysts noted that no actual supply disruptions have occurred.
$66 is a key level for WTI crude to hold above.
If it can maintain this area, we will likely see higher price. $66 is a multi year trendline of support going back to 2021.
Energy stocks / XLE basket is showing some bullish divergence, perhaps indicating this oil move has legs.

Gold | Oil | Dollar | Silver | Natural Gas Price Forecast.Gold | Oil | Dollar | Silver | Natural Gas Price Forecast.
NYMEX:NG1! COMEX:GC1! AMEX:UNG COMEX:SI1!

Natural Gas | Oil | Dollar | Silver | Gold Price Forecast.Natural Gas | Oil | Dollar | Silver | Gold Price Forecast.
NYMEX:NG1! NYMEX:CL1! COMEX:GC1! COMEX:SI1!

Natural Gas | Oil | Dollar | Silver | Gold Price Forecast.Natural Gas | Oil | Dollar | Silver | Gold Price Forecast.
COMEX:SI1! COMEX:GC1! NYMEX:CL1! AMEX:UNG

RIG Mega Profits SecuredRIG is a high beta oil stock. We secured profits today and looking for another entry.
With the recent breakout and upside momentum in oil, this name caught a massive bid.
Crude oil has seen a sharp rise in just the last week and shaping up for a continuation move higher.
If this breakout holds energy stocks should continue to fly.
WTI has its first major resistance level coming up within 1% from current price.
Look for pullback buys in energy if oil continue to hold the inverse head & shoulder breakout.

$USO to $29-42 before a bottom is inAMEX:USO broke down from a long term that started in March 2020 and is now breaking down below support at $67.
The most likely outcome is a continuation down to the lower support levels at $29-33.
I won't rule out the possibility of one more retest of the trend line ($73-75) before continuing down further. An invalidation of the short would be a break over the $83 level.
Otherwise, downside is the most likely outcome from here.
Let's see how it plays out over the coming months.

Natural Gas | Oil | Dollar | Silver | Gold Price ForecastNatural Gas | Oil | Dollar | Silver | Gold Price Forecast
NYMEX:NG1! NYMEX:CL1! COMEX:GC1! COMEX:SI1!

Natural Gas | Oil | Dollar | Silver | Gold Price ForecastNatural Gas | Oil | Dollar | Silver | Gold Price Forecast
COMEX:GC1! COMEX:SI1! TVC:DXY NYMEX:CL1!

Natural Gas | Oil | Dollar | Silver | Gold Price ForecastNatural Gas | Oil | Dollar | Silver | Gold Price Forecast
NYMEX:NG1! CAPITALCOM:NATURALGAS COMEX:GC1! COMEX:SI1!

Natural Gas | Oil | Dollar | Silver | Gold Price ForecastNatural Gas NYMEX:NG1! | Oil | Dollar | Silver | Gold Price Forecast
OANDA:XAUUSD NYMEX:CL1!

Natural Gas | Oil | Dollar | Silver | Gold Price ForecastPrice action, multi time frame, trend analysis on
NYMEX:NG1! PEPPERSTONE:NATGAS AMEX:UNG | Oil | Dollar | Silver | Gold Price Forecast

Natural Gas | Oil | Dollar | Silver | Gold Price ForecastNatural Gas | Oil | Dollar | Silver | Gold Price Forecast
NYMEX:CL1! COMEX:SI1! COMEX:GC1! AMEX:UNG

Natural Gas | Oil | Dollar | Silver | Gold Price ForecastNatural Gas | Oil | Dollar | Silver | Gold Price Forecast
NYMEX:CL1! COMEX:SI1!

Bullish bounce?USO/USD has bounced off the support level which is a pullback support that lines up with the 50% Fibonacci retracement and could potentially rise from this level to our take profit.
Entry: 58.96
Why we like it:
There is a pullback support level that lines up with the 50% Fibonacci retracement.
Stop loss: 56.81
Why we like it:
There is a pullback support level that lines up with the 78.6% Fibonacci retracement.
Take profit: 63.23
Why we like it:
There is a pullback resistance level.
Enjoying your TradingView experience? Review us!
Please be advised that the information presented on TradingView is provided to Vantage (‘Vantage Global Limited’, ‘we’) by a third-party provider (‘Everest Fortune Group’). Please be reminded that you are solely responsible for the trading decisions on your account. There is a very high degree of risk involved in trading. Any information and/or content is intended entirely for research, educational and informational purposes only and does not constitute investment or consultation advice or investment strategy. The information is not tailored to the investment needs of any specific person and therefore does not involve a consideration of any of the investment objectives, financial situation or needs of any viewer that may receive it. Kindly also note that past performance is not a reliable indicator of future results. Actual results may differ materially from those anticipated in forward-looking or past performance statements. We assume no liability as to the accuracy or completeness of any of the information and/or content provided herein and the Company cannot be held responsible for any omission, mistake nor for any loss or damage including without limitation to any loss of profit which may arise from reliance on any information supplied by Everest Fortune Group.

Opening (IRA): USO May 16th -75C/October 17th 45C LCD*... for a 26.25 debit.
Comments: Buying the back month 90 delta and selling the front month strike that pays for all of the extrinsic in the long. (The long call is shown at a higher strike so that it fits on the chart).
Metrics:
Buying Power Effect: 26.25
Break Even: 71.25
Max Profit: 3.75
ROC at Max: 14.3%
50% Max: 1.88
ROC at 50%: 7.2%
Will generally look to take profit at 50% max and/or roll out short call at 50% max to reduce down side break even.
* -- Long call diagonal.

Oil in a multi-week declining triangle patternPYTH:USOILSPOT
Oil has been in a multi-week declining triangle pattern, lasting over 2 years so far, which will eventually break to the downside. When it does, the price target should be around $35 USD. Which is calculated subtracting the width of the triangle from the base of the triangle.
When? Probably when we have a stock market crash, which could be soon. Fundamentally speaking, a global recession should reduce global demand for crude oil. Also, a resolution of the Ukraine-Rusia conflict should increase global supply of crude oil.
Good luck to you

$KRE CRASH COMING ... Not yet tho..we'll find out..Regional Banks seem to be heading on a slippery path identical to the most previous crash pattern back when they needed all the loan Bailouts. Now that all the loans have stopped, I'm sure some banks may be heading towards loan restructuring perhaps, maybe defaults, I'm not sure honestly. I just know that the chart never lies and I've been watching and waiting for a long while. I predicted the first crash back then and I currently have no doubts with the current chart ahead of me. As always, I will do my best to provide the best insight possible into these speculations. Currently we have the Daily breaking trend and the bar count getting close to the previous 141 bars. The only difference is that we bounce off the 100% retracement. If we continue to lose the 1.27, we'll be headed for the 1.61..... updates soon.

Gold | Oil | Dollar | Silver | Natural Gas Price ForecastMultiple Time Frame Analysis
Support and Resistance Key Levels Analysis
Gold | Oil | Dollar | Silver | Natural Gas Price Forecast

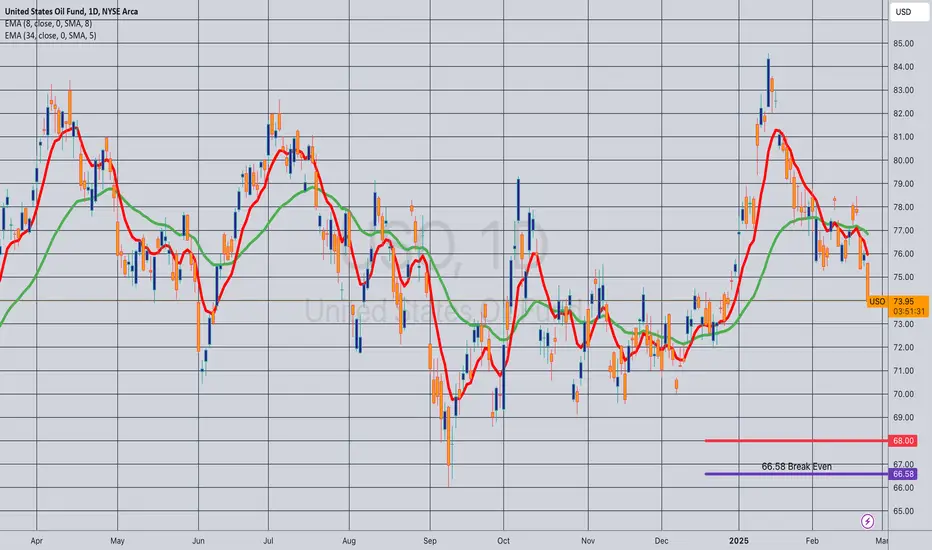
Opening (IRA): USO April 17th 68 Covered Call... for a 66.58 debit.
Comments: With /CL dropping sub-70/bbl., putting on a starter position in USO, selling the -75 delta call against shares to emulate the delta metrics of a 25 delta short put, but with the built-in defense of the short call.
Metrics:
Buying Power Effect/Break Even: 66.58/share
Max Profit: 1.42
ROC at Max: 2.13%
50% Max: .71
ROC at 50% Max: 1.07%
Will generally look to take profit at 50% max, add at intervals if I can get in at strikes/break evens better than what I currently have on, and/or roll out short call if my take profit is not hit.