USO - very bullish on oilAnyone with a brain knows where we are heading.. Take a lesson from Texas. Long here for USO and Oil and gas in general. Especially with a Biden admin. Opposites attract...
Good luck!
USO

NOW is now!!Commodity trade by another means!
Just work in a long position with fundamentals.
p.s. Check-out the closing price line chart for line placement -

India & Japan very bullish frm late 2020 -> Oil & Resources soarIndia (INDA) & Japan (EWJ) equities very bullish from late 2020 - helping Oil (USO) and Resources (DBC) to also soar.

𝗢&𝗚 𝗨𝗽𝗱𝗮𝘁𝗲: $XOP Weekly. Moving Averages and VolumeMoving averages and volume in and of themselves can tell an interesting story. Is a Wave 3 under way in a new bull?
$DRIP $GUSH $XLE $CL_F $USO $NG_F $UNG $BOIL #Trading #ElliottWave #CrudeOil #OOTT 🛢️

USO looking for $45With a break of the trend line and confirmation of that break today (Friday Feb 5) we will look for the next level at $45 a share. With pricing in oil going higher and more demand appearing in the market

Dead wrong on Oil, but what now?Obviously my previous predictions on Oil were wrong, however, it is hard to forecast a vicious virus from the far East. Now, the doomsdayers are back, touting their long bond positions with gold, saying "I told you so." Those positions have worked, and oil has tanked. To be clear, I don't dislike bonds or gold here, but Oil is ripe for a rebound. We are deeply oversold, indeed, I believe this sell-off is far overdone. From a pure technical perspective, the RSI is now turning, and MACD looks to be bottoming out. We should retest the ~60 level again, as this was the previous range bound channel crude was trading in. If 50 is broken, this thesis is invalidated and I am dead wrong. We will see.

USO Touching a trend line Breakthrough or PullbackWe are now touching a long term (march 2020) trend line that gives us an upside to this trade. As oil continues to climb above 55 we see this staying in support.
But be careful of a pullback to 33 to retest to the 50 MA

Nice setup to short Crude oil falling channel 🛢️📉NYMEX:CL1! is trading now in long-term supply area ( resistance). After estabilished triple top price pattern we could see trading NYMEX:CL1! in falling channel.On hourly timeframe its clear downtrend and price forming hanging man pattern.
After breakdown diagonal trendline price is testing it, its perfect setup to short entry.
here is data for my trade:
------------------------Trade setup ---------------------------
Entry: 52.62
Stop Loss: 52.92
Profit target: 51.54
Time stop: MOC ( Market on Close)
------------------------------------------------------------------
If you like the idea, do not forget to support with a 👍 like and follow.
Leave a comment that is helpful or encouraging. Let's master the markets together.

Upward channel on SCO: Short Crude Oil at TopHi mates, i posting another of my todays trades. Its based od triple top on in my another idea posted few days ago. Its in realated.
here is data for my swingtrade:
------------------------Trade setup ---------------------------
Entry: 9.98
Stop Loss: 9,82
Profit target: 10,62
Time stop: 3 days
------------------------------------------------------------------
If you like the idea, do not forget to support with a 👍 like and follow.
Leave a comment that is helpful or encouraging. Let's master the markets together.

Selling Triple top in supply zone: CL ShortHi guys i sharing one of my today swing trades. Crude is trading now in longterm supply zone in extended uptrend and formed triple top pattern.
Because US Dollar lifting up i will make more pressure to oil. I trading this by ETF: AMEX:SCO

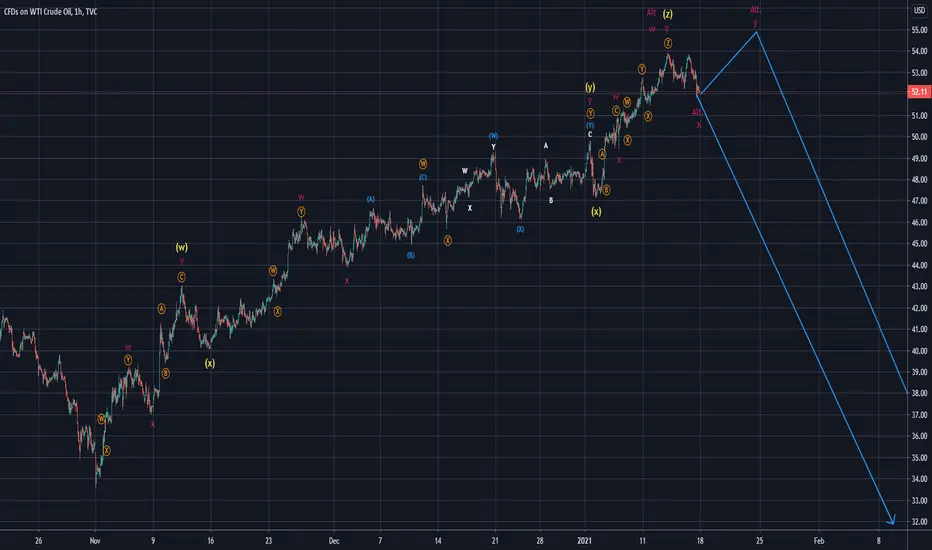
USOil (WTI)Due to the fall of the May contract into negative territory, oil can hardly be counted superordinate, as this is not provided in the EWT. Therefore, I have here only the last movement counters. Here it is not yet quite clear whether the final yellow (z) only the red w (here Alt. w) was completed or whether it was already completed. The 0.618 minimum target was reached in any case, so that a further rise would not be mandatory.
WTI - Short IdeaIdea is laid out here:
-broke trendline
-retested
-unconfirmed double top
-divergence showing in heatmap
2:1RR
1% risk

Oil Playbook ( 2021 )Prices for Crude Oil are down -20% from last year which means the bearish outlook is priced in. The bearish outlook is that the -16% drop in consumption outweighs the -7% drop in production plus the 4% increase in inventory stockpiles. Bulls want to know if demand has bottomed or not and since consumption tends to be highest in Jan-Feb, it might have further to fall since travel is still lagging. However, exports have recovered and circling back, the -20% discount in crude prices indicate the market is fundamentally balanced given the uncertainty.
Production
2019 Average: 12,197
2020 Average: 11,318
%Change: -7.76%
Stockpiles
2019 Nov: 1,918
2020 Nov: 2,003
%Change: +4.24%
Consumption
2019 Average: 1,070
2020 Average: 916
%Change: -16.81%
Exports
2019 Average: 8,471
2020 Average: 8,407
%Change: -0.76%
Trading Strategy
Swings in the dollar index are primarily moving prices so this will create the trading opportunities in the near term. Get ready.
There is a momentum divergence on the DXY daily chart and the RSI has some room to run.
Crude prices have reached a resistance level.
If the Dollar index does start to rally then crude prices are going to waterfall. Best to wait for a decisive candle closing below the 10 day EMA before making a short trade.
Trading is risky. Don't do it.
Long oil/gas producer equities
KMI, LUKOY, EQT

Crude oil under pressure - 📉 Trading bearish flag on CL1!🛢️If you like the idea, do not forget to support with a 👍 like and follow.
Leave a comment that is helpful or encouraging. Let's master the markets together.
Hi fellows, just one of my today daytrades:
Nice entry point on bearish flag
------------------------Trade setup ---------------------------
Entry: 48.07
Stop Loss: 48.22
Profit target: 47.60
Time stop: Exit at market close
------------------------------------------------------------------

Crude oil drop by 4% soon! If you like the idea, do not forget to support with a 👍 like and follow.
Leave a comment that is helpful or encouraging. Let's master the markets together.
Hi fellows, just one of my today swingrades:
Crude oil forming head and shoulders pattern inside supply zone. Drop is very likely very near.
------------------------Trade setup ---------------------------
Entry: 48.18
Stop Loss: 48.67
Profit target: 46.41
Time stop: 5 days
------------------------------------------------------------------

CL: USO: Crude Oil Awaiting OPEC Decision to Boost ProductionCrude Oil chart is consolidating awaiting OPEC's decision to boost production by 500,000 B/d in February, with a total of 2 Billion B/d increase by April of 2021.
Prices may dip to $45 level. Economic recovery from COVID-19 is in the cards with expectations of higher demand coming in the spring and into H2 of 2021.
Currently, Crude Oil prices are holding grounds, pressured by the OPEC production increases news, but supported by expectations of growing demand.
Based on the OPEC agenda and Russia's position seeking price stability, 2021 oil prices are expected to trade within the range of $45-$55.
Lower prices, down to $45 -42 level may be seen in the near term, while demand has not recovered yet, but production increases are already agreed upon.
Technical analysis: 4 Hr RSI chart shows mid-range consolidation, which may get resolved by testing the bottom before going back up.
Multi-frame MACD chart analyses show consolidation at the top of the range on a Daily chart, with mid-range consolidation on a 4 Hr chart.
The most significant Fibonacci level from the most recent run up appears to be 50% at $45.50, which is also 200 EMA. This area is expected to
get tested first, should OPEC approve its production increases on January 4th. Lower levels of $42 and $39 are also possible targets, depending on the
EIA inventory reports in the coming weeks. We still do not have full demand recovery, while production may start increasing ahead of time.

Looking for a decent, if minor correction on USO > 44-ishLooking to purchase Oil/energy equities, looks like USO has a slight negative bias and might break down from ascending wedge. Looking to purchase more oil/energy on a dip. I can see 43-44 on a correction. 100 EMA near 44 should cap losses, unless we have a news catalyst.
Exxon and other energy names have moved up hard over the last few weeks, might be time for a correction. This would be to add to existing positions or to add new names. Also noticing some bearish divergence on the RSI in the 4-hr chart. Looking to pick up a few shares of FENY to diversify. Main vehicle is XOM, FENY is not ideal for diversification, but it provides some. Charts and indicators look okay, XOM appears to be at distribution and therefore a dip is underway as I write. Ideal price for FENY would be 9.90ish, for XOM, I would say anything below 40. Market will do what it wants, so I might just put in a trailing buy order with a half-decent delta and see if I can get a better price, but not going to try to get too "cute" about getting a sale price.

EXXON MOBIL LONG|ECONOMIC RECOVERY BET|
XOM is an oil major, and the stock fell from 70$ to 30$ as a result of the corona-crisis
That brought economic recession and a decrease in both demand and price of oil
Later, XOM established a double bottom after retesting the lows of the pandemic
And now it is surging.
I think that buying XOM is a bet on the economic recovery
Which will happen eventually
The target of 65-67$ is very realistic
As this is the minimum of what the company should be worth without outperforming
I would say, that 65$ is the price which will be achieved by just getting the demand for oil back to normal
Without any further increase in oil prices. (As there is plenty of ready to go supply, so the new demand will be covered easily and so the oil price will remain stable as the oil companies revenue will grow!
Therefore, Long XOM.
Like and subscribe to never miss a new idea!

Dollars, Gold, and Something Else...Something inTERe$tiNg is unfolding and you heard it here first. It involves the dollar, gold, and... drum roll...
...the W r e c k i n g B a l l
I'll save that one for last. Like any good thesis, it will evolve as new data comes in.
For now let's look at some data.
We can see from the Commitment of Traders report that both Asset Managers and Leveraged Speculators are reducing longs and increasing shorts on the D X Y. Asset Managers, being the more conservative investors, are decidedly betting on further weakness while Leveraged Speculators are pretty much split even.
"U.S. DOLLAR INDEX - ICE FUTURES U.S."
-------------------------
Date: 2020-11-17
Open Interest: 29413
-------------------------
Asset Managers / Institutions
Long: 5255 -887 change
Short: 9148 332 change
Spreading: 931 -3 change
-------------------------
Leveraged Funds
Long: 9509 -763 change
Short: 8709 407 change
Spreading: 1401 -731 change
Looking at the charts we see this bearish momentum playing out, however, the technicals are a bit overextended and I am keeping an eye out for something like a dead cat bounce in the next few weeks, followed by a plummet into the abyss.
This same pattern would inversely reflect in nearly every market but let's just look at Gold for now.
If this plays out we can expect a sucker rally from the weekly 50 EMA, followed by an ugly move to test the next fibonacci level down. This is where I would start aggressively adding to my core positions.
As of Nov 19 2020, US Investor Sentiment, % Bull-Bear Spread is at 17.99%, compared to 30.96% last week and 15.90% last year. This is higher than the long term average of 7.29%.
This data signals that investors were much too bullish on the overall market are beginning to become more bearish.
THE WRECKING BALL REVEALED
Many are calling for the market bubble to pop but it just keeps trucking along. As we enjoy that sweet bubble bliss, that truck is driving off road into the Wild West and if you know anything about history, you know that the rest of the world is not so bubbly.
This theory is a purely speculative shot in the dark but...
1. If the dollar does plummet, you better believe that oil is going to ROCKET like Kim Jong-un's 36th birthday present
2. Saudis are trouble, or the U.S. is. It's hard to tell. Probably both.
The global economy is vulnerable to high oil prices which is part of the reason the U.S. wants to control Saudi Arabia. It could very well be part of the reason why U.S. oil producers "shoot themselves in the foot" *wink wink*, intentionally driving down prices by over producing. Fact is that inflation is basically a national security threat with the current debt levels and it's very unlikely the powers that be are not heavily involved in the oil sector.
Fun fact: 80% of Saudi Arabia's exports are oil. When economy's get squeezed, you can be sure a reaction will follow. Aggressive retaliatory action would certainly drive oil prices to the moon and with a plummeting dollar, this would be a perfect storm. The global economy would implode, the bubbles all pop, and we won't be able to finish watching Peaky Blinders on Netflix.
Keeping at least 1 eye on this.
Trading is risky. Don't do it and don't listen to me.
Long:
Crypto: BTC, ETH
Bullion: Gold, Silver
Equities: Commodities, International Dividend and Growth stocks
"All religion is a foolish answer to a foolish question." - Thomas Shelby

Oil Bears in for a Crude AwakeningDon't get excited just yet. The only certainty in the oil game is it's not for the faint of heart and right now, the bears are getting crushed.
Now that prices are gearing up it looks like it's time to make a new plan. Before I do let's recap the last one.
Previously I had noticed a particular trendline that prices broke out of in early August. As that breakout failed, it seemed a retest of that trendline was inevitable.
Prices bounced right back up to a macro fib retracement level (@ $40) as they often do, like a magnet.
Then after it failed at that fib level and retested that trendline again, I noticed a potential tricky oil move playing out: the head and shoulders fake out.
Now here we are breaking $40.50 and the 50 Week EMA. Although I have been buying oil stocks on these dips I am not trading futures just yet until prices can stabilize above $40. Eventually, I'd like to see a weekly close above that 50 week EMA and then start buying dips on the 1 hour chart all the way up to the 200 week EMA at $51.50
The MACD on the monthly chart is showing a nice divergence and as always, I'm keeping an eye on that macro Fib retracement level at $40 as the pivot point.
Trading is risky. Don't listen to my advice.
Long LUKOY, KMI and buying dips

WTI OIL(USOIL) will fall from Resistance. Sell!
Hello, Traders!
OIL is approaching a confluence of strong resistance levels
Even thought the Dollar is pretty weak
The demand for oil is dubious
Due to the recovery rate uncertainty
And the possibility of new lockdowns
Vaccine efficiency and deployment etc..
All of the above leads me to believe
That bulls wont't be pushing above the confluence
Therefore, I expect oil to pullback
To retest the falling support
Sell!
Like, comment and subscribe to boost your trading!
See other ideas below too!

OIL will rise a bit more, then fall. Sell!
Hello, Traders!
OIL is going UP on the fundamentals.
Improved outlook on the economic Recovery rate
Based on the vaccine successes
Consequently improves outlook on oil demand
Therefore we see a price increase.
However, On the technical side
We see a strong rising resistance ahead.
That is my target short spot
From which I expect oil to retest falling support
Sell!
Like, comment and subscribe to boost your trading!
See other ideas below too!

USO Bearish Trade Setup The 4 hour chart on USO is showing a quality bearish trade with heavy resistance into 30-31. Is this (X) wave complete for a move back into 22-224 level? On the Minor time frame, look to execute bearish positions for USO expiring Jan 2021. Trade execution details in video update.
