Update: View of Crude Oil remains, buying opportunity at $48.60Demand remains consistent at 1.5% YoY, the decline was caused entirely by supply-side shocks and record production. From the lows, late last year OPEC has talked up production cuts which would ultimately be the catalyst to rally higher.
This is a bullish market, shorting counter-trend is risky so make sure you are managing the risk of the position BEFORE you place your trade.
I won't be shorting Oil, but I will be a buyer at $48.60 provided all the planets continue to align.
USO


Go Long DNRRSI back to oversold and ready for u turn, lowest it can go further is around 14 area. But this is a good start position.....

WEEKEND REVIEW: WTI near-term down before trend resumes higherMarkets are a DISCOUNTING MECHANISM they will discount today what they expect at some point in the future and if that expectation does not materialize the price will correct lower. Over the past few months, OPEC has been quite open about production cuts which would be the perfect recipe to push markets higher.
Huge overproduction while demand remained consistent at 1.5% caused the price to crash, OPEN is now addressing this issue.

UPDATE: $48 on WTI Crude Oil is a good r/r LONGDemand is trending at a steady 1.5% YoY, the decline was entirely driven by supply-side shocks. The OPEC rhetoric to cut production is favorable for price big picture but the chart is suggesting lower first into an ideal target of $48.


OIL THOUGHTSFOMC in yellow
EIAs in light red
Still bearish AF this year but looking for perfect short


CL - Watch the price action before to sell CL Watch the price action if the price closes below $53.06 before to sell.


DXY weekly, possible head and shoulders. FOMC TomorrowDXY weekly, possible head and shoulders. FOMC Tomorrow will send it lower? Powell said 2 raises this year from previous 4. I think they keep dovish tone, until economic data is better. Consumer sentiment was 120, compared to 124. Oil looks really good, gold has quite a run already. I am in 1/3 pos $UWT and $Nugt. Sanctions against Venezuela could be bullish for oil too. Good luck!

Subdued Volatility Boosts Crude, But Will It Last? #oil #oott Oil has also seen a dramatic decline in volatility with the OVX down 35 percent over the last month versus an eight percent decline in the VIX. But, prices are beginning to stagnate across cyclical drivers as the macro data out of China and Europe continue to decelerate.
In October:
"There is currently a 19.8% premium versus the 20-year seasonality , and
there's over a 24 percent gap from where crude currently stands and the
5- and 10-year seasonality , respectively. Looking at the futures market,
large speculators positioning (on a 5-year percentile) has been sloping
lower as price diverges.
However, now growth is expected to slow along with inflation which is a bad mix. I have been pointing out since early summer, my DRIP-model (disinflation/reflation/inflation proxy in pink) has been pointing to lower-lows in U.S. inflation . In turn, consumer prices fell from a five-year high of 2.9% to 2.3%
Given how market conditions are building, and the recent action in crude, the U.S. could be facing inflation under 2% and that has serious implications when concerning Fed policy."
The 20-year seasonality for WTI is negative from September to January with October and November being to steepest at -1 and -1.2 percent, respectively. January's seasonality performance is -.7 percent with current prices trading at a 13.1 percent premium to the 5-year average.
Furthermore, today's EIA inventories report saw a massive build of 7.97 m/bl build v. 42,000 drawdown expectation and 2.68 m/bl draw in the following week. This was the largest build since November 15.


$USO long after weeks of #bearish movementUSO is finishing weeks of #bearish movement and we're ready for some neutral to bullish price action off the long term trendline support. Accumulating in this area is key.

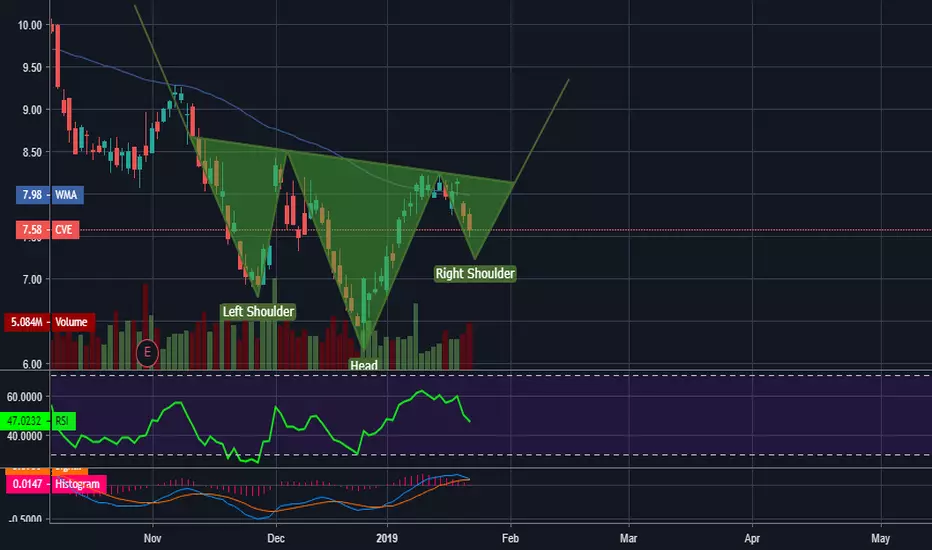
$USO Inverse Head and ShouldersSuper bullish on USO with this inverse head and shoulders in the works.

THE WEEK AHEAD: IBM, SBUX, USO, OIH, XOP(Pulling hair out). Ugh. A tough market temporarily for premium sellers. With VIX caving in dramatically off of its late December greater-than-35 highs, premium selling is the old gray mare that (temporarily) just ain't what it used to be.
That being said, there are a couple of potential earnings plays to be had next week: IBM (68/31; Tuesday after market close) and SBUX (67/27; Thursday after market close).
As you can see by the background implied volatility metrics, well, they ain't great, with IBM coming in at 31 and SBUX at 27. That being said, the February to March implied volatility contraction in IBM at the moment appears to be potentially from 32.7% to 26.6% (23% or so), and the SBUX from 25.7% to 23.5% (9.4%). From that standpoint, IBM appears to be the better volatility contraction play, since the market's pricing in a bigger contraction in the "Watson AI" company than in the omnipresent coffee purveyor. However, if you're going to play Watson, you're going to have to deal with goofy five-wides in the monthlies which, in itself, makes the play unappealing. Using the weeklies for a more surgical approach gets you fairly wide markets. Again, unappealing. (Scratches IBM off his list).
SBUX suffers from the same problem, but with two-and-a-half wides. I remember playing SBUX before, but don't recall having this two-and-half wide nonsense in the monthlies. (Scratches SBUX off his list, too).
On the exchange-traded fund front, some implied volatility juice appears to be concentrated in the petros -- USO, OIH, and XOP, where it pretty much is to a lesser or greater degree all the time. This is why I pretty much have some kind of trade on and running in XOP almost all the time. (See Post Below for my current XOP trade). This isn't necessarily the greatest place to start a relationship with this underlying (the implied volatility's at the low end of its 52-week range), but it's not paying horribly. Due to its relatively small size (31.60 at Friday close), I like to short straddle it -- the March 15th 32 short straddle is paying 2.92 at the mid with a 25% max take profit .73, which beats a poke in the eye with a sharp stick.
In light of the broad market volatility crush, this is just one of those weeks where I don't anticipate putting much on unless something dramatically changes or I stumble across something directional to play. Until then, I'll just sit on a bunch of dry powder, and it deploy it when the time comes.

UNITED STATES OIL FUND ETF (USO): Pivots, Supports & ResistencesFind Winning Trades In Seconds >> efcindicator.com (Special Discount)
UNITED STATES OIL FUND ETF (USO): All The Pivots, Supports & Resistences

OIL USO CL - Head & Shoulders PatternA head and shoulders pattern has formed on the hourly charts for light crude futures. This marks the potential for a bullish reversal and a sustained break below the neckline could see price drop as low as $49-$49.50.
To learn more about my trading strategies check out www.tradingwithkrugman.com

Oil running directly into resistance - a quick short idea!This is an update of my oil call from a few weeks ago where I suggested an inverse head and shoulders pattern might turn oil around.
I believe that the current fundamental environment for oil is favorable so I would not like to fight the trend on any long term basis, but I do believe we can make a quick trade as oil runs into overhead trendline resistance on the chart above. The breakdown line from the bearish wedge will likely serve as resistance and I would not be surprised to see a pull back before oil continues higher.
For a quick trade:
Short oil between $51.60 and $52
Target: $49.75
Stop: $52.30 (or grossly above the trendline above)

