WTI Oil H4 | Pullback resistance at 50% Fibonacci retracementWTI oil (USOIL) is rising towards a pullback resistance and could potentially reverse off this level to drop lower.
Sell entry is at 60.49 which is a pullback resistance that aligns with the 50.0% Fibonacci retracement.
Stop loss is at 62.30 which is a level that sits above the 61.8% Fibonacci retracement and an overlap resistance.
Take profit is at 56.68 which is a multi-swing-low support.
High Risk Investment Warning
Trading Forex/CFDs on margin carries a high level of risk and may not be suitable for all investors. Leverage can work against you.
Stratos Markets Limited (tradu.com):
CFDs are complex instruments and come with a high risk of losing money rapidly due to leverage. 63% of retail investor accounts lose money when trading CFDs with this provider. You should consider whether you understand how CFDs work and whether you can afford to take the high risk of losing your money.
Stratos Europe Ltd (tradu.com):
CFDs are complex instruments and come with a high risk of losing money rapidly due to leverage. 63% of retail investor accounts lose money when trading CFDs with this provider. You should consider whether you understand how CFDs work and whether you can afford to take the high risk of losing your money.
Stratos Global LLC (tradu.com):
Losses can exceed deposits.
Please be advised that the information presented on TradingView is provided to Tradu (‘Company’, ‘we’) by a third-party provider (‘TFA Global Pte Ltd’). Please be reminded that you are solely responsible for the trading decisions on your account. There is a very high degree of risk involved in trading. Any information and/or content is intended entirely for research, educational and informational purposes only and does not constitute investment or consultation advice or investment strategy. The information is not tailored to the investment needs of any specific person and therefore does not involve a consideration of any of the investment objectives, financial situation or needs of any viewer that may receive it. Kindly also note that past performance is not a reliable indicator of future results. Actual results may differ materially from those anticipated in forward-looking or past performance statements. We assume no liability as to the accuracy or completeness of any of the information and/or content provided herein and the Company cannot be held responsible for any omission, mistake nor for any loss or damage including without limitation to any loss of profit which may arise from reliance on any information supplied by TFA Global Pte Ltd.
The speaker(s) is neither an employee, agent nor representative of Tradu and is therefore acting independently. The opinions given are their own, constitute general market commentary, and do not constitute the opinion or advice of Tradu or any form of personal or investment advice. Tradu neither endorses nor guarantees offerings of third-party speakers, nor is Tradu responsible for the content, veracity or opinions of third-party speakers, presenters or participants.
Crude Oil WTI

USOIL CAUTION! BREAK - TEST - GO!This is my new updated chart of Oil.
Trump's "Drill baby Drill" interfering with the free market is the absolute worst thing he could do. His ridiculous tariffs will put us in an economic depression!
Oil prices are driven by demand! As I have mentioned here on TV so many times before! Increasing supply while heading into a recession is the dumbest thing possible! You never want to consume your own oil when you can consume others first! Simultaneously, F your own nation's oil company's profit margins and gov tax revenue!
This is why we shouldn't put toddlers as POTUS!
Anyway!!! This is a break test go! setup!
If you haven't seen it before, here is an example I recently posted with AAPL.
Click Boost, follow, subscribe! Let's get to 5,000 followers so I can help them navigate these crazy markets too. ))

USOIL trading alerts. Pressure and support.Oil also fell according to instructions. I just forgot to remind you. Sorry, but the profit is quite good. Sell short from 58.7. Then the lowest reached 56.34
But today in the New York market, USOIL rose again above 58. From a fundamental perspective. The market will continue to fall under pressure. But from the trend, we need to pay attention to the support of 58. If it does not fall today, it is likely to continue to fall based on Friday's trend. The pressure level near 59 needs to be paid attention to. In terms of operation, it is still mainly selling at high levels.
Always remind trading risks. So don't ignore this. If you don't know how to trade. Remember to wait and see. Don't trade blindly or gamble.
Many investor friends know that I have led some investors to create good profits for several consecutive days. If you don't know how to trade, remember to leave me a message and try it. Maybe your profit will double.

Can oil prices continue to be shorted? Of courseSaudi Arabia made a major strategic shift, willing to accept low oil prices and unwilling to cut supply.
Oil prices fell sharply as a result.
It is expected that oil prices will hit 55-56 in the short term, so the operation is still mainly shorting oil prices. Overcapacity.

USOIL BEARISH BIAS RIGHT NOW| SHORT
USOIL SIGNAL
Trade Direction: short
Entry Level: 63.13
Target Level: 61.78
Stop Loss: 64.03
RISK PROFILE
Risk level: medium
Suggested risk: 1%
Timeframe: 1h
Disclosure: I am part of Trade Nation's Influencer program and receive a monthly fee for using their TradingView charts in my analysis.
✅LIKE AND COMMENT MY IDEAS✅

Crude Oil | Support Level 62.700-61.700Crude Oil reached support level.
Take Profit : 71.750
Stop Loss : 60.680

Short on Oil/Back to 57$ SOONI believe we can continue the retest of previous major support level at 65-66$ and fibonacci 0.618. This major support will be flipped to resistance in my opinion. We can see a significant sell-off back towards the 57$ area and below from this location.
I will be looking to enter a short trade from the 0.618 region/66$ if there is a rejection.
My mid-term/end-of-year prediction for US OIL is between 45-50$ and possibly lower.
If you believe in the fundamentals and idea of this setup, feel free to follow and use it.
Not financial advice.

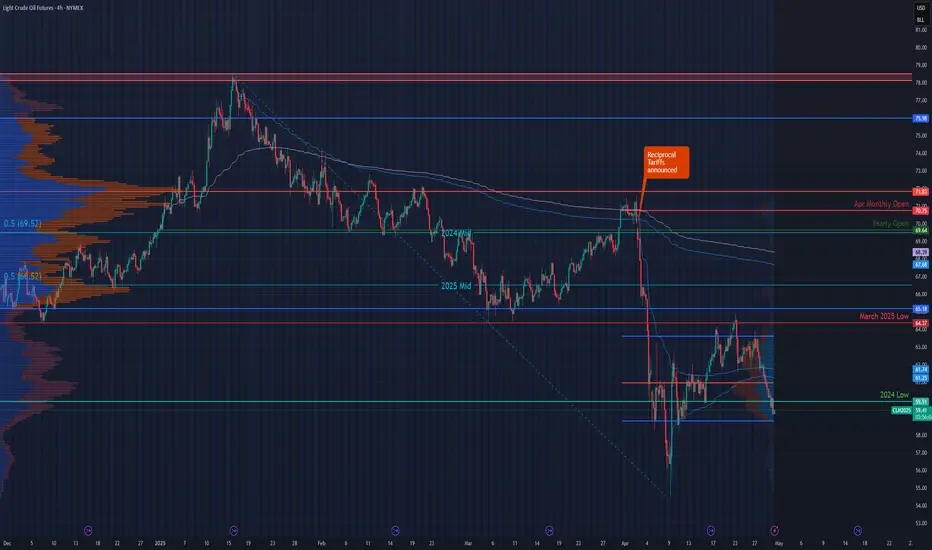
Planning for the Next Trade in Crude OilNYMEX:CL1!
Key Levels – Higher Timeframe:
• 2025 High: 78.56
• Yearly Open (2025): 69.64
• 2025 mCVPOC: 71.83
• Yearly VWAP: 68.41
• AVWAP from Yearly Highs: 67.71
• 2025 mCVAL: 65.28
• March 2025 Low: 64.37
• 2024 Low: 59.91
April 2025 Key Levels:
• April mCVAL: 58.79
• April mCVPOC: 60.94
• April AVWAP from Lows: 61.29
• April AVWAP from Highs: 61.76
• April mCVAH: 63.73
Our previous trade idea played out as expected. With updated levels now in place, we aim to reassess the market context without falling into recency or confirmation bias. These biases often lead to an overly bearish outlook at market lows, especially amid ongoing headlines around trade war tensions and supply concerns. While such fundamentals are important, maintaining objectivity is key.
This leads us to the central question: Is all this bearish sentiment already priced in? If so, why are sellers still dominant?
From a broader perspective, the overall context for crude remains bearish. However, this does not imply an immediate continuation to lower prices.
Currently, price is trading below both the midpoint of 2025 and that of 2024. Additionally, the recent price swing failed at the March 2025 low—an important technical rejection. The 2024 low at 59.91 now serves as key structural support. We anticipate further consolidation within the April 2025 value range, specifically between mCVAH (63.73) and mCVAL (58.79).
We define the area between April’s mCVPOC (60.94) and AVWAPs (61.29 / 61.76) as a "noise zone"—a region where price action is likely to be choppy and directionless. This zone is not favorable for directional trades.
Potential Trade Setup – Range-Bound Play
Example Trade 1: Long Crude Oil
• Entry: 59.91
• Stop: 59.20
• Target: 61.76
• Risk: 71 ticks
• Reward: 185 ticks
• Risk/Reward Ratio: 2.6R
Example Trade 2: Long Crude Oil
• Entry: 58.80
• Stop: 58.20
• Target: 61.76
• Risk: 60 ticks
• Reward: 296 ticks
• Risk/Reward Ratio: 4.93 R
Important Notes:
• These are example trade ideas and not financial advice or recommendations.
• Traders should conduct independent analysis and ensure proper risk management.
• Stop-loss orders are not guaranteed; slippage may occur, resulting in losses beyond predefined levels.
• AVWAP levels are accurate at the time of posting, they may vary as indicator further calculates prices with new volume and price information.
Glossary Index for all technical terms used:
ATH: All time high
VPOC: Volume Point of Control
VAL: Value Area Low
VAH: Value Area High
VP: Volume Profile
AVP: Anchored Volume Profile
C: Composite (prefix before VAL, VAH, VPOC, VP, AVP)
mC: micro-Composite (prefix before VAL, VAH, VPOC, VP, AVP)
AVWAP: Anchored Volume Weighted Average Price
Green Zones: Bull/ Buyers support zones
Red Zones: Bear/Seller resistance zones
USOIL BULLS WILL DOMINATE THE MARKET|LONG
USOIL SIGNAL
Trade Direction: long
Entry Level: 59.70
Target Level: 63.67
Stop Loss: 57.06
RISK PROFILE
Risk level: medium
Suggested risk: 1%
Timeframe: 12h
Disclosure: I am part of Trade Nation's Influencer program and receive a monthly fee for using their TradingView charts in my analysis.
✅LIKE AND COMMENT MY IDEAS✅

USOIL - Bearish Double TOPHello Traders !
The USOIL price formed a double top pattern.
Currently, The neckline is broken !
So, I expect a bearish move📉
________________
TARGET: 59.410🎯

OIL TRADE IDAHello
Hi everyone. Regarding oil movements, I see a long opportunity at the level of 59.61. If the price closes below 58.56, there is a possibility of a temporary rise before continuing to drop to 55.
good luck all
**My trading strategy is not intended to be a signal. It's a process of learning about market structure and sharpening my trading my skills also for my trade journal**
Thanks a lot for your support

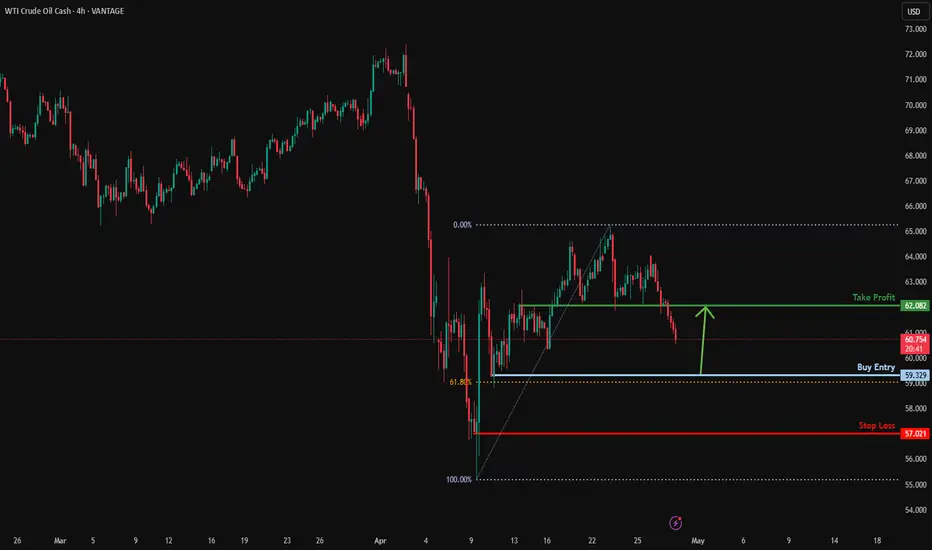
Could the price bounce from here?USO/USD is falling towards the support level which is a pullback support that lines up with the 61.8% Fibonacci retracement and could bounce from this level to our take profit.
Entry: 59.32
Why we like it:
There is a pullback support level that lines up with the 61.8% Fibonacci retracement.
Stop loss: 57.02
Why we like it:
There is a pullback support level.
Take profit: 62.08
Why we like it:
There is an overlap resistance level.
Enjoying your TradingView experience? Review us!
Please be advised that the information presented on TradingView is provided to Vantage (‘Vantage Global Limited’, ‘we’) by a third-party provider (‘Everest Fortune Group’). Please be reminded that you are solely responsible for the trading decisions on your account. There is a very high degree of risk involved in trading. Any information and/or content is intended entirely for research, educational and informational purposes only and does not constitute investment or consultation advice or investment strategy. The information is not tailored to the investment needs of any specific person and therefore does not involve a consideration of any of the investment objectives, financial situation or needs of any viewer that may receive it. Kindly also note that past performance is not a reliable indicator of future results. Actual results may differ materially from those anticipated in forward-looking or past performance statements. We assume no liability as to the accuracy or completeness of any of the information and/or content provided herein and the Company cannot be held responsible for any omission, mistake nor for any loss or damage including without limitation to any loss of profit which may arise from reliance on any information supplied by Everest Fortune Group.
WTI OIL Bearish Cross confirming more selling ahead.WTI Oil (USOIL) has been trading within a Channel Down pattern since the December 06 2024 Low. The last Bearish Leg started on a 1D MA200 (orange trend-line) rejection and was confirmed with a 1D MACD Bearish Cross 3 days after.
At the moment we have had a 1D MA50 (blue trend-line) rejection and today we will complete a new 1D MACD Bearish Cross. As a result, we almost have a new sell confirmation. Once completed, sell and target $53.50 (-19% from the point of the rejection).
-------------------------------------------------------------------------------
** Please LIKE 👍, FOLLOW ✅, SHARE 🙌 and COMMENT ✍ if you enjoy this idea! Also share your ideas and charts in the comments section below! This is best way to keep it relevant, support us, keep the content here free and allow the idea to reach as many people as possible. **
-------------------------------------------------------------------------------
Disclosure: I am part of Trade Nation's Influencer program and receive a monthly fee for using their TradingView charts in my analysis.
💸💸💸💸💸💸
👇 👇 👇 👇 👇 👇

Oil - Short Term Sell Trade Update!!!Hi Traders, on April 17th I shared this idea "Oil - Looking To Sell Pullbacks In The Short Term"
I expected to see bearish continuation until the two Fibonacci resistance zones hold. You can read the full post using the link above.
The price is currently holding in the first Fibonacci resistance zone.
Until both the Fibonacci resistance zones hold my bearish view still remains.
If you enjoy this idea, don’t forget to LIKE 👍, FOLLOW ✅, SHARE 🙌, and COMMENT ✍! Drop your thoughts and charts below to keep the discussion going. Your support helps keep this content free and reach more people! 🚀
-------------------------------------------------------------------------------------------------------------------
Disclosure: I am part of Trade Nation's Influencer program and receive a monthly fee for using their TradingView charts in my analysis.

USOIL Will Go Down! Sell!
Here is our detailed technical review for USOIL.
Time Frame: 8h
Current Trend: Bearish
Sentiment: Overbought (based on 7-period RSI)
Forecast: Bearish
The market is approaching a significant resistance area 61.191.
Due to the fact that we see a positive bearish reaction from the underlined area, I strongly believe that sellers will manage to push the price all the way down to 56.009 level.
P.S
Overbought describes a period of time where there has been a significant and consistent upward move in price over a period of time without much pullback.
Disclosure: I am part of Trade Nation's Influencer program and receive a monthly fee for using their TradingView charts in my analysis.
Like and subscribe and comment my ideas if you enjoy them!

WTI Oil H4 | Bearish reversal off an overlap resistance?WTI oil (USOIL) is rising towards an overlap resistance and could potentially reverse off this level to drop lower.
Sell entry is at 62.04 which is an overlap resistance.
Stop loss is at 64.95 which is a level that sits above a multi-swing-high resistance.
Take profit is at 59.18 which is a swing-low support that aligns close to a 61.8% Fibonacci retracement.
High Risk Investment Warning
Trading Forex/CFDs on margin carries a high level of risk and may not be suitable for all investors. Leverage can work against you.
Stratos Markets Limited (tradu.com):
CFDs are complex instruments and come with a high risk of losing money rapidly due to leverage. 63% of retail investor accounts lose money when trading CFDs with this provider. You should consider whether you understand how CFDs work and whether you can afford to take the high risk of losing your money.
Stratos Europe Ltd (tradu.com):
CFDs are complex instruments and come with a high risk of losing money rapidly due to leverage. 63% of retail investor accounts lose money when trading CFDs with this provider. You should consider whether you understand how CFDs work and whether you can afford to take the high risk of losing your money.
Stratos Global LLC (tradu.com):
Losses can exceed deposits.
Please be advised that the information presented on TradingView is provided to Tradu (‘Company’, ‘we’) by a third-party provider (‘TFA Global Pte Ltd’). Please be reminded that you are solely responsible for the trading decisions on your account. There is a very high degree of risk involved in trading. Any information and/or content is intended entirely for research, educational and informational purposes only and does not constitute investment or consultation advice or investment strategy. The information is not tailored to the investment needs of any specific person and therefore does not involve a consideration of any of the investment objectives, financial situation or needs of any viewer that may receive it. Kindly also note that past performance is not a reliable indicator of future results. Actual results may differ materially from those anticipated in forward-looking or past performance statements. We assume no liability as to the accuracy or completeness of any of the information and/or content provided herein and the Company cannot be held responsible for any omission, mistake nor for any loss or damage including without limitation to any loss of profit which may arise from reliance on any information supplied by TFA Global Pte Ltd.
The speaker(s) is neither an employee, agent nor representative of Tradu and is therefore acting independently. The opinions given are their own, constitute general market commentary, and do not constitute the opinion or advice of Tradu or any form of personal or investment advice. Tradu neither endorses nor guarantees offerings of third-party speakers, nor is Tradu responsible for the content, veracity or opinions of third-party speakers, presenters or participants.

USOIL 2025/04/29Scenario USOIL TF H4
- Stick to your stop loss to protect your trades
- Manage your positions patiently until you hit the target
- Profit always in risk, take the risk or lose the chance

WTI CRUDE OIL: Buy signal at the bottom of the Channel Up.WTI Crude Oil turned bearish on its 1D technical outlook (RSI = 42.387, MACD = -1.000, ADX = 27.186) as it crossed under the 4H MA50. Still, it hit and is so far contained at the bottom of the Channel Up, which makes it a strong short term buy opportunity. Aim for the 4H MA200 (TP = 65.00).
## If you like our free content follow our profile to get more daily ideas. ##
## Comments and likes are greatly appreciated. ##


USOIL Long Idea#USOIL
Under current market conditions, the area near 62.28 has been identified as a critical support zone, where the AI model detects a high-probability trade setup.
From a technical perspective, a clear directional bias based on recent price action patterns. If the market demonstrates increased volume and price stability above key moving averages in the 62.28 area, traders are advised to monitor for trend-continuation entry opportunities in alignment with the prevailing momentum.
Profit targets are defined at 63.67 and 64.86, corresponding to logical technical resistance zones. These levels are designed for staged profit-taking across different trade management styles. Stop-loss should be strictly enforced at the designated level; once breached, the strategy is considered invalidated in order to limit potential downside.

#USOIL 4HUSOIL (4H Timeframe) Analysis
Market Structure:
The chart is forming a classic Head and Shoulders pattern, which often signals a potential reversal from an uptrend to a downtrend. The left shoulder, head, and right shoulder are clearly visible, and the neckline is an important support zone to monitor.
Forecast:
A sell opportunity may be considered if the price breaks and closes below the neckline with confirmation. This breakdown could indicate the start of a bearish trend continuation.
Key Levels to Watch:
- Entry Zone: Look for a sell setup once the neckline is broken and retested as resistance.
- Risk Management:
- Stop Loss: Positioned above the right shoulder to minimize risk.
- Take Profit: Target nearby support zones or use a measured move technique based on the pattern's height.
Market Sentiment:
As long as the neckline holds and the breakdown is confirmed, bearish momentum is likely. A failure to break below the neckline would delay or invalidate the selling setup.

Potential Decline of Brent Oil Price to $50 in the Near Future.Brief Overview of Events and News Explaining the Potential Decline of Brent Oil Price to $50 in the Near Future.
➖ Increased OPEC+ Production:
On April 3, 2025, eight OPEC+ countries unexpectedly decided to accelerate production increases, adding 411,000 barrels per day starting in May. This decision triggered a price drop, with Brent falling 6.42% to $70.14 per barrel at the time.
Analysts like Amrita Sen from Energy Aspects noted that this move pressures “lagging” countries to meet quotas, but the market interpreted it as an oversupply signal.
Source: OilPrice.com, "OPEC+ to Raise Oil Production by More Than Expected in May," April 3, 2025 (oilprice.com)
➖ Decreased Demand Due to Economic Challenges:
On April 14, 2025, OPEC revised its 2025 oil demand growth forecast downward by 150,000 barrels per day to 1.3 million barrels per day, citing trade tensions and weak economic indicators. JPMorgan also raised the likelihood of a global recession to 60%.
Source: OilPrice.com, "OPEC Lowers 2025 Oil Demand Forecast on Trade Tensions," April 14, 2025 (oilprice.com)
➖ Trade Tariffs and Global Instability:
On April 3, 2025, U.S. President Donald Trump announced new tariffs on trading partners, heightening recession fears. Fitch Ratings described this as the highest level of U.S. import tariffs since 1910. Brent dropped 4% immediately following the announcement.
Source: OilPrice.com, "OPEC+ to Raise Oil Production by More Than Expected in May," April 3, 2025 (oilprice.com)
➖ Geopolitical De-escalation:
On April 25, 2025, reports emerged of progress in U.S.-Russia talks on Ukraine, as well as Iran’s openness to nuclear negotiations. This reduces geopolitical risks and increases the likelihood of higher oil supply on the market.
Source: OilPrice.com, "Oil Set For Weekly Loss on OPEC+ Supply Rumors," April 25, 2025 (oilprice.com)
Technical Analysis Section:
The monthly chart shows similarities between the 1999–2002 and 2020–2025 periods: an initial impulse, followed by a correction, and then a 6-year upward trend.
Nearest entry point targets at the 161.8% Fibonacci level:
• $52,46
• $49,06
• $46,50
Growth Potential
Medium-term:
• $138,00
Long-term:
• $500,00
Once the price of oil UKOIL reaches $52.46, a review for the entry point will be prepared.
Charts:
•
•

Is this still the ‘Top Trade’ of 2025? (WTI crude oil)It’s not a big secret actually- I’m talking about crude oil!
In the final week of 2024, the team and I highlighted two versions of the WTI crude oil weekly chart and asked ‘is this the top trade of 2024?’
Version 1 has already happened, WTI crude hit $55 per barrel, the downside objective of the smaller triangle pattern on the chart.
Version 2 showed a much larger triangle pattern (which we show again this week) and had a downside target of nearly $30! It would take a lot of conviction to ride the price that far down, but could crude oil still move a lot lower this year?
What’s interesting is that this is still one of the ‘less talked about’ situations in the market today because of the huge volatility seen in both stocks, forex and fixed income.
And I like that nobody’st talking about it - because you don’t want everyone in on it - that means the move could already be over.
Crude oil hit a five-year low. That’s meaningful.
Strong markets don’t hit 5-year lows, weak markets do. And we like to sell weak markets.
Of course, ‘oversold markets’ hit 5-year lows too - and that largely explains the ‘bottom feeders’ who bought WTI crude oil at $55.
Downside volatility got extreme owing to Trump’s tariffs and mean-reversion helped it rebound on news of the 90-day pause, much like stock markets.
I am completely open to the idea that $55 is a multi-year low and essentially marked the bottom. The huge Hammer reversal candlestick pattern adds weight to that idea.
But with the price having hit $65 last week, buying the lows is yesterday’s trade. What do we do today?
We will be looking to do what we said in Week 53 of 2024 in case crude oil turns out to be the ‘top trade of 2025’ as we imagined.
By the way, Brent crude oil has a very similar setup so this is not a ‘US oil’ thing.
There are two parts to trading ‘planning the trade, and trading the plan’.
There isn’t much use in making a plan, and not taking the trade.
There are always reasons not to take a trade- but if it’s a ‘good trade’ that fits the rules of your trading strategy, then those reasons are usually just ‘noise’.
WTI Crude (USO/USD)
Long term chart (weekly)
Trend: Down
Phase: Re-test of breakdown
Resistance = $70
Support = $55
Price action: Price has broken down, rebounded and is now testing the breakdown level, while under the 30-week moving average. Should the price break back over the broken long term rising trendline then we know the idea, or at least the timing on the idea is not right.
View: Bearish while under broken up-sloping long term support
