Hellena | Oil (4H): SHORT to the area of 65.268.Colleagues, I believe that the downward movement is not over yet, and now the price is in a complex combined correction. The second correction also consists of “ABC” waves.
In an ideal scenario, the price completes wave “C” in the 70.000 area and starts the downward movement to the support area of 65.268.
In general, the plan has not changed since the last forecast, but the bulls still have strength, so we should take the upward movement as an opportunity to profitably go short.
Manage your capital correctly and competently! Only enter trades based on reliable patterns!
Crude Oil WTI

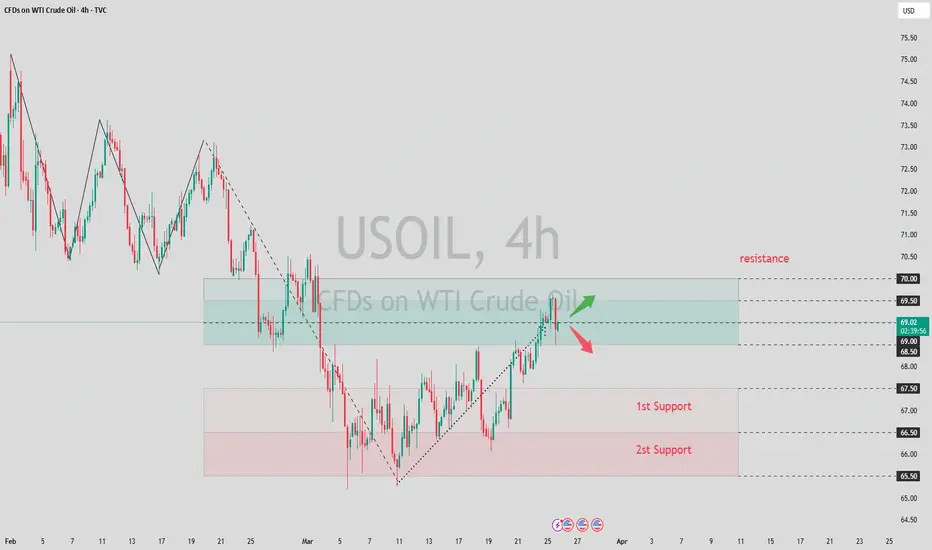
USOil:When to short at high levels?During the evening session yesterday, the price of crude oil surged again, reaching the resistance level of 69.5 per barrel in the session. However, after encountering resistance, part of the bullish momentum took profits and fled the market, causing the price to decline slightly to the support level of 69 per barrel without further drops.
After today's opening, the bullish momentum is obviously insufficient, and the price has not risen further, showing a downward extension trend.
Today's trading strategy: Focus on taking short positions at relatively high levels. Currently, the support at 69 per barrel is relatively solid. Observe whether the price can reach the resistance range of 69.5 per barrel again. If it breaks through upwards, look at the important psychological resistance level of 70 per barrel. Choose to take short positions again within the range of 69.5 - 70 per barrel, with the target price at $68 per barrel. Participate with a small position.
USOIL Trading Strategy:
Sell@68.5-69
TP:68-67
Get daily trading signals that ensure continuous profits! With an astonishing 90% accuracy rate, I'm the record - holder of an 800% monthly return. Click the link below the article to obtain accurate signals now!

USOIL - at resistance ? What's next ??#USOIL.. market just reached at his resistance area.
Keep close it and if market thold it in that case we can see again drop from here.
Don't be lazy here..
Good luck
Trade wisely

USOIL:Bide one's timeThis week, we've analyzed the reasons behind the short - term strong performance of crude oil. We specifically remind you to pay attention to the price movements within the range of $68.5 - $69.5.
Once again, we advise you to observe more and trade less.
We share various trading signals every day with over 90% accuracy
Fans who follow us can get high rewards every day
If you want stable income,You can follow the link below this article
CRUDE OIL LONG SIGNAL|
✅USOIL made a retest
Of the horizontal support
Of 68.60$ so we are bullish
Biased so we can enter a
Long trade with the TP of 69.46$
And the SL of 68.17$
LONG🚀
✅Like and subscribe to never miss a new idea!✅
Disclosure: I am part of Trade Nation's Influencer program and receive a monthly fee for using their TradingView charts in my analysis.

USOIL: Rally, Resistance, and Technical ReversalThe recent trend of USOIL has been continuously rising in a volatile manner, and the current intraday price has reached a three - week high.
Currently, the bullish sentiment in the market is greatly influenced by fundamental news, mainly due to the combined effects of the United States increasing sanctions on Iran's energy and the ineffective and substantive implementation of the 30 - day cease - fire agreement between Russia and Ukraine.
Analyzing the short - term trend from the one - hour chart of USOIL, during the US trading session last night, the crude oil price surged again, hitting the resistance of $69.5 in the market. However, after encountering resistance, part of the bullish momentum took profits and fled, and the price slightly retreated to the support of $69 without further decline.
After today's opening, the bullish momentum was obviously insufficient, and the price did not rise further. The upper track of the Bollinger Bands extended downward, exerting pressure. The moving average of the Macd indicator formed a cross at a high level and has a downward extension trend, and the momentum column began to release downward.
USOIL Trading strategy
Sell@69.5-69
tp:68-67.5
I will share trading signals every day. All the signals have been accurate for a whole month in a row. If you also need them, please click on the link below the article to obtain them.

WTI rises to test major resistance WTI has risen in the last couple of weeks after staging an oversold bounce from around the key $65.00 long-term support level at the start of the month. However, it is now testing a key resistance area between $69.15 - $70.00 range, which is where WTI last sold off from. It is a pivotal zone. Given the underlying long-term bearish trend, I am more inclined to look for bearish setups to form here, than to chase this move higher. However, that being said, I would have to drop my short-term bearish bias in the event WTI were to break decisively above $70.00 level in the days ahead.
By Fawad Razaqzada, market analyst with FOREX.com

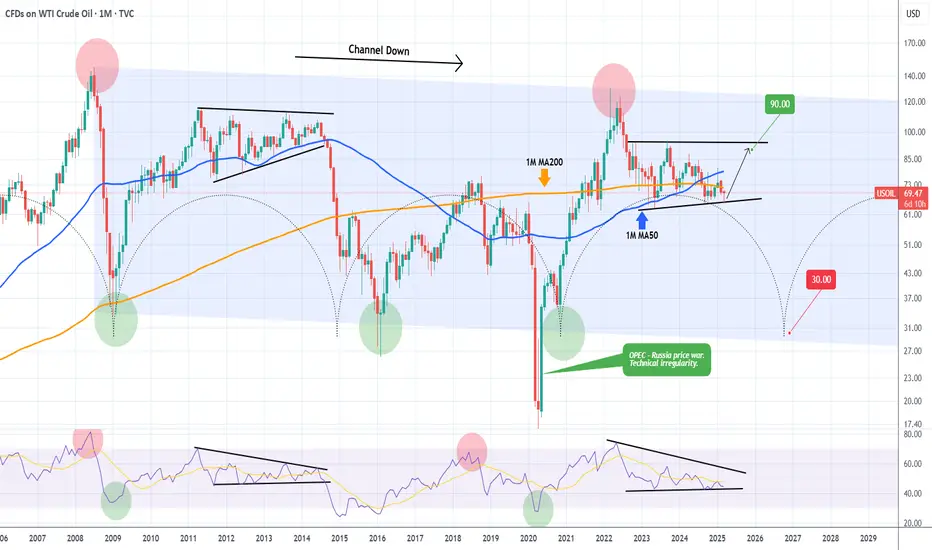
WTI OIL Ultimate long-term guide.WTI Oil (USOIL) has a tendency, like a number of key traditional assets, to follow long-term Cycles. Market psychology more times than not makes investors and the market behave in similar ways (euphoria buying, panic selling) given the same market conditions. Fundamentals and catalysts can often be used as reasons and excuses to confirm the technical trends and long-term Cycles.
Oil is no different and on this 1M time-frame analysis we see why. The dominant multi-year pattern is a Channel Down and it has started on the July 2008 All Time High (ATH). Right now it appears that we are inside a Wedge pattern similar to 2011 - 2014 and more specifically on the final Bullish Leg towards the top.
The 1M RSI sequence among those two fractals is identical so based on all these parameters we believe WTI will test $90.00 by late 2025 - early 2026 and if rejected, start a brutal long-term sell-off towards the bottom of the Channel Down and the 35.00 - 30.00 range by late 2026 as the Time Cycles suggest.
-------------------------------------------------------------------------------
** Please LIKE 👍, FOLLOW ✅, SHARE 🙌 and COMMENT ✍ if you enjoy this idea! Also share your ideas and charts in the comments section below! This is best way to keep it relevant, support us, keep the content here free and allow the idea to reach as many people as possible. **
-------------------------------------------------------------------------------
💸💸💸💸💸💸
👇 👇 👇 👇 👇 👇
Oil - Expecting Retraces and Further Continuation HigherH1 - Bullish trend pattern in the form of higher highs, higher lows structure
Strong bullish momentum
Bearish divergence on the moving averages of the MACD indicator.
Expecting retraces and further continuation higher until the two strong support zones hold.
If you enjoy this idea, don’t forget to LIKE 👍, FOLLOW ✅, SHARE 🙌, and COMMENT ✍! Drop your thoughts and charts below to keep the discussion going. Your support helps keep this content free and reach more people! 🚀
--------------------------------------------------------------------------------------------------------------------
Disclosure: I am part of Trade Nation's Influencer program and receive a monthly fee for using their TradingView charts in my analysis.

CRUDE OIL(WTI): Bullish Continuation Confirmed
One of the setups that we discussed on a today's live stream
was a bullish flag pattern on WTI Crude Oil on an hourly chart.
Its resistance breakout provides a strong bullish confirmation.
We can expect growth at least to 70 level.
❤️Please, support my work with like, thank you!❤️

OIL Today's strategyYesterday, prices were affected by tightening expectations on the supply side, geopolitics and other factors, and the trend was strong, breaking through $69.
Today, it is fluctuating above $69, and another wave of gains is expected. At the same time, we need to pay close attention to the situation in the $68.5-69.5 area and adjust it at any time
usoil buy@68.3-68.7
tp:69.5-70
We share various trading signals every day with over 90% accuracy
Fans who follow us can get high rewards every day
If you want stable income, you can contact me

USOIL Is Very Bearish! Short!
Take a look at our analysis for USOIL.
Time Frame: 9h
Current Trend: Bearish
Sentiment: Overbought (based on 7-period RSI)
Forecast: Bearish
The market is on a crucial zone of supply 69.379.
The above-mentioned technicals clearly indicate the dominance of sellers on the market. I recommend shorting the instrument, aiming at 67.044 level.
P.S
Please, note that an oversold/overbought condition can last for a long time, and therefore being oversold/overbought doesn't mean a price rally will come soon, or at all.
Disclosure: I am part of Trade Nation's Influencer program and receive a monthly fee for using their TradingView charts in my analysis.
Like and subscribe and comment my ideas if you enjoy them!

Technical Analysis for WTI Crude Oil (Daily Chart)Current Price Action
WTI crude oil is trading at $70.51, showing a recovery from the Liquidity Pool zone near the $66.00–$67.00 range. The price has approached a key resistance level around $71.00, which aligns with a previous area of rejection in February 2025. The chart suggests a potential pullback from this resistance level, as indicated by the projected downward arrow.
Support Levels:
$66.00–$67.00: This zone represents a significant liquidity pool where buyers have consistently stepped in, leading to a reversal in price.
$65.00: A psychological support level and the lower boundary of the liquidity pool.
Resistance Levels:
$71.00: A critical resistance level that has acted as a ceiling for price action in recent months.
$73.00: The next major resistance level if the price breaks above $71.00.
Volume Profile Analysis
The Volume Profile on the right side of the chart shows significant trading activity between $70.00 and $71.00, indicating strong resistance in this area. Above $71.00, the volume thins out, suggesting that a breakout could lead to a rapid move toward $73.00.
Indicators and Momentum
Trend: The price is recovering from a bearish trend but remains below the highs of $80.00 seen earlier in the chart. The current move appears to be a retracement within a broader downtrend.
Potential Pullback: The projected arrow on the chart suggests a possible rejection at $71.00, with a pullback toward the $68.00–$69.00 range.
Market Sentiment
The chart reflects cautious optimism, with buyers stepping in at lower levels but facing strong resistance at $71.00. A breakout above this level could signal a shift in sentiment, while a rejection would confirm the continuation of the bearish trend.
Conclusion
WTI crude oil is at a critical juncture, testing the $71.00 resistance level. Traders should watch for a breakout above $71.00, which could target $73.00 and higher. Conversely, a rejection at this level may lead to a pullback toward the $68.00–$67.00 support zone. The liquidity pool near $66.00 remains a key area for buyers to defend in the event of further downside.

CRUDE OIL Will Go Up After Pullback! Buy!
Hello,Traders!
CRUDE OIL is trading in a
Local uptrend and the price
Made a strong bullish breakout
Of the key horizontal level
Of 68.40$ so after a pullback
And a retest of the new support
We will be expecting a further
Bullish move up
Buy!
Comment and subscribe to help us grow!
Check out other forecasts below too!
Disclosure: I am part of Trade Nation's Influencer program and receive a monthly fee for using their TradingView charts in my analysis.

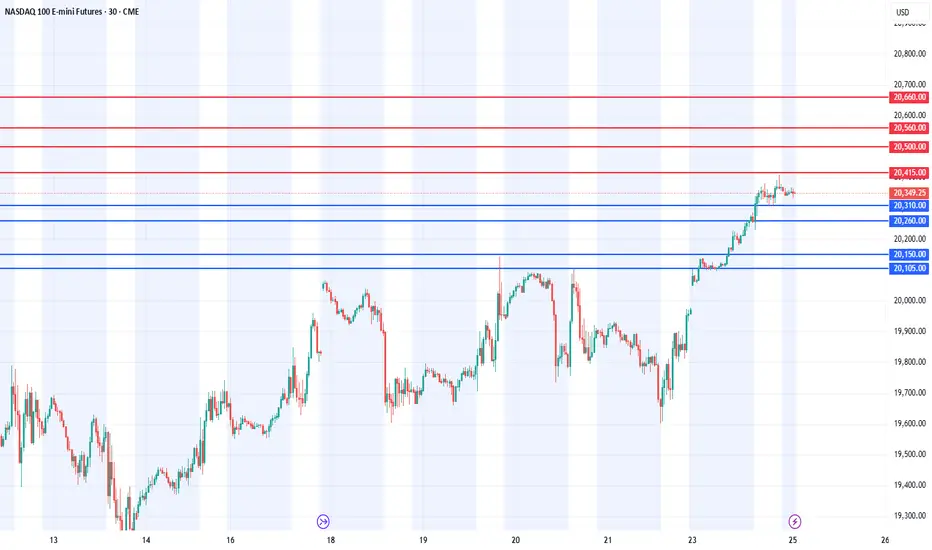
Today analysis for Nasdaq, Oil, and GoldNasdaq
The Nasdaq closed higher, forming a gap up on the daily chart. It showed a strong, one-directional rebound up to the 5-week moving average on the weekly chart.
Since the 5-week MA overlaps with the 60-week MA, it's unlikely to break through easily without a short-term correction.
On the daily chart, the MACD has formed a golden cross, meaning that even if a pullback occurs, the strategy should remain buy-on-dip oriented.
There is still an open gap down to 19,960, which could be filled at any time—so it's important to consider the possibility of a retest of that level. If the gap is filled, that area could be a good support zone to buy from.
On the 240-minute chart, strong buying momentum entered around the zero line, confirming a breakout after basing in a range. Therefore, buying on pullbacks remains the preferred approach in this structure.
Crude Oil
Crude oil continued its upward move, closing higher on the daily chart.
With strong support around the $68 level, the market could potentially rise toward the $70 zone, and possibly test resistance between $70–$71, which is a key area to watch closely.
Overall, traders should continue to buy on dips, but be cautious with chasing long positions above $70. If taking short positions, they should be managed with tight stop-losses.
On the 240-minute chart, oil appears to be in the midst of a third wave rally, so any short positions should be considered above $70, while buying pullbacks remains valid.
Current Middle East tensions and U.S. sanctions on Venezuelan oil are contributing to a supply risk premium in oil prices.
Since the market is recovering from the lows and showing a positive technical setup, short trades should be managed carefully with proper risk control.
Gold
Gold closed lower, remaining within its range-bound structure. On the daily chart, gold is currently trading between the 3-day and 5-day MAs above, and the 10-day MA below, forming a narrow consolidation zone. This makes sell-at-highs and buy-at-lows strategies effective.
Since there's room for a pullback to the 5-week MA on the weekly chart, chasing longs is not advised. If the MACD crosses below the signal line, this could create a bearish divergence, leading to potential sharp downside, so caution is warranted.
On the 240-minute chart, the MACD is failing to break above the signal line and continues to decline. However, since the signal line remains above the zero line, a rebound attempt is likely, even if the MACD dips below zero.
Given the current slope and distance, it's unlikely that a golden cross will form soon. Also, traders should keep in mind that major economic data such as GDP and PCE reports are scheduled later this week, which could influence market direction.
If you can understand the daily chart structure, you can better anticipate intraday high/low ranges and potential wave patterns. Make it a habit to perform thorough daily chart analysis each day, and prepare a trading scenario that suits the market’s behavior. As always, questions are welcome.
Wishing you a successful trading day!
If you like my analysis, please follow me and give it a boost!
For additional strategies for today, check out my profile. Thank you!
USOIL To Retest $70.5I'm watching TVC:USOIL for a strong push towards at least the $70.5 level, though this area presents significant resistance.
A confirmed break of the bearish trend could fuel strong buying momentum, but patience is key.
Ideally, I’d like to see a solid rejection off the $68.5 level as confirmation before a move higher.
If we get a decisive breakout above $70.5 with sustained bullish momentum, my next target would be the major resistance around $75.

Buy idea on Crude Oil (CL1!)Based on
- Cyclical analysis and quantitative data
- Undervalued Conditions
- Commercials hedging higher

USOil:Wait for rebound to shortThe market movement on Friday was not significant. The intraday high was reached at the opening in the morning, hitting a peak of $68.65, while the low was at $67.65. The maximum intraday fluctuation was just $1, and the price trend showed a shallow V - shape. Considering that Trump is bound to end the Russia - Ukraine conflict over the weekend, crude oil will likely remain bearish in the short term. Therefore, today's market is generally expected to rise first and then decline under pressure again.
USOIL Trading Strategy:
Sell@68.5-69
TP:67-66
Get daily trading signals that ensure continuous profits! With an astonishing 90% accuracy rate, I'm the record - holder of an 800% monthly return. Click the link below the article to obtain accurate signals now!

USOIL Trading Strategy: Secrets to Consistent ProfitsThe situation in the crude oil market has been complex recently.
On the supply side, it is affected by the uncertainty of the OPEC+ production increase plan, the recovery of U.S. shale oil production, and the potential supply risks in Iran.
On the demand side, due to the weak momentum of global economic recovery and trade disputes, demand has been suppressed. However, the rising market expectations of the Federal Reserve's interest rate cut may boost crude oil demand if the loose monetary policy is implemented.
In terms of inventory, although U.S. crude oil inventories have decreased slightly recently, there is still pressure for inventory accumulation, and the decline in the geopolitical risk premium has weakened the support for oil prices.
In the short - term, the crude oil price was blocked and retraced at the upper edge of the trading range. Eventually, it rebounded and recovered, yet failed to break through to a new high. The bullish and bearish forces are locked in a stalemate. Objectively, the short - term trend direction remains unclear, while subjectively, it is biased upward. It is expected that crude oil will break through the resistance at the upper edge of the range and continue to rise today, though with limited upside potential.
USOIL Trading Strategy
sell@68.5-69
tp:67-66.5
I will share trading signals every day. All the signals have been accurate for a whole month in a row. If you also need them, please click on the link below the article to obtain them.

Crude Oil Week AheadFrom a weekly time frame perspective, oil prices have continued to respect the boundaries of a declining channel since the 2022 highs, reaching three-year lows in 2025, in alignment with the long-standing support zone between $64 and $66 that has held since 2021.
After recently rebounding from the $65 level, a decisive close below $63.80 would confirm further downside potential, opening the way toward key support levels at $60, $55, and, in more extreme scenarios, $49.
If the support zone holds, resistance levels within the declining channel may come into play at $70.80, $72.60, $74.30, and $76. A breakout above the channel’s upper boundary and a sustained hold above $78 could shift the outlook to bullish, with potential resistance at $80, $84, $89, and the $93–$95 range.
Despite a complex mix of OPEC quotas, U.S. policy shifts, Chinese economic dynamics, global growth uncertainty, renewable energy demand, and escalating geopolitical tensions, oil remains bearish and range-bound—awaiting a decisive breakout.
Written by Razan Hilal, CMT

USOIL Today's analysisUSOIL is at 68.335. Technically, I'm bearish short - term.
The strong resistance at 69.000 has repeatedly blocked upward moves. Heavy selling occurs near this level, making it a firm price cap.
There are two key supports. 67.000 has halted drops before. If breached, 66.30, a crucial level from past down - trends, comes into play.
With the price below 69.000, facing downward pressure and bearish sentiment, USOIL may decline soon. There's no strong bullish factor to push it higher. The downward - sloping momentum and proximity to supports suggest a downward path. Traders should be cautious and might consider short - term short positions, with risk control, as the price may test 67.000 first, then 66.300 if the bearish trend persists.
💎💎💎 USOIL 💎💎💎
🎁 Sell@68.500 - 69.000
🎁 TP 67.000 - 66.300
The market has been extremely volatile lately. If you can't figure out the market's direction, you'll only be a cash dispenser for others. If you also want to succeed,Follow the link below to get my daily strategy updates

WTI Oil H4 | Rising into 50% Fibonacci retracementWTI oil (USOIL) is rising towards a pullback resistance and could potentially reverse off this level to drop lower.
Sell entry is at 69.23 which is a pullback resistance that aligns with the 50.0% Fibonacci retracement.
Stop loss is at 70.70 which is a level that sits above the 61.8% Fibonacci retracement and a multi-swing-high resistance.
Take profit is at 66.44 which is a multi-swing-low support.
High Risk Investment Warning
Trading Forex/CFDs on margin carries a high level of risk and may not be suitable for all investors. Leverage can work against you.
Stratos Markets Limited (www.fxcm.com):
CFDs are complex instruments and come with a high risk of losing money rapidly due to leverage. 63% of retail investor accounts lose money when trading CFDs with this provider. You should consider whether you understand how CFDs work and whether you can afford to take the high risk of losing your money.
Stratos Europe Ltd (www.fxcm.com):
CFDs are complex instruments and come with a high risk of losing money rapidly due to leverage. 63% of retail investor accounts lose money when trading CFDs with this provider. You should consider whether you understand how CFDs work and whether you can afford to take the high risk of losing your money.
Stratos Trading Pty. Limited (www.fxcm.com):
Trading FX/CFDs carries significant risks. FXCM AU (AFSL 309763), please read the Financial Services Guide, Product Disclosure Statement, Target Market Determination and Terms of Business at www.fxcm.com
Stratos Global LLC (www.fxcm.com):
Losses can exceed deposits.
Please be advised that the information presented on TradingView is provided to FXCM (‘Company’, ‘we’) by a third-party provider (‘TFA Global Pte Ltd’). Please be reminded that you are solely responsible for the trading decisions on your account. There is a very high degree of risk involved in trading. Any information and/or content is intended entirely for research, educational and informational purposes only and does not constitute investment or consultation advice or investment strategy. The information is not tailored to the investment needs of any specific person and therefore does not involve a consideration of any of the investment objectives, financial situation or needs of any viewer that may receive it. Kindly also note that past performance is not a reliable indicator of future results. Actual results may differ materially from those anticipated in forward-looking or past performance statements. We assume no liability as to the accuracy or completeness of any of the information and/or content provided herein and the Company cannot be held responsible for any omission, mistake nor for any loss or damage including without limitation to any loss of profit which may arise from reliance on any information supplied by TFA Global Pte Ltd.
The speaker(s) is neither an employee, agent nor representative of FXCM and is therefore acting independently. The opinions given are their own, constitute general market commentary, and do not constitute the opinion or advice of FXCM or any form of personal or investment advice. FXCM neither endorses nor guarantees offerings of third-party speakers, nor is FXCM responsible for the content, veracity or opinions of third-party speakers, presenters or participants.

Market Analysis: WTI Crude Oil Face HurdlesMarket Analysis: WTI Crude Oil Face Hurdles
Crude oil is attempting a recovery wave but upsides could be limited.
Important Takeaways for WTI Crude Oil Price Analysis Today
- WTI Crude oil prices started a recovery wave from the $66.00 support zone.
- There is a key bullish trend line forming with support at $67.50 on the hourly chart of XTI/USD at FXOpen.
WTI Crude Oil Price Technical Analysis
On the hourly chart of WTI Crude Oil at FXOpen, the price remained in a bearish zone below the $70.00 level against the US Dollar. The price started a fresh decline below the $68.00 support.
The price even dipped below the $67.50 level and the 50-hour simple moving average. Finally, the bulls appeared near $66.00 and the price started a recovery wave. The price recovered above $67.50 and tested the $68.50 zone.
The price is now consolidating gains below the 23.6% Fib retracement level of the upward move from the $66.54 swing low to the $68.48 high. There is also a key bullish trend line forming with support at $67.50.
If there is a fresh increase, it could face resistance near the $68.30 level. The first major resistance is near the $68.50 level. Any more gains might send the price toward the $69.20 level.
The main resistance could be near the $70.00 level. Conversely, the price might continue to move down and revisit the $67.50 support and the 50% Fib retracement level of the upward move from the $66.54 swing low to the $68.48 high. The next major support on the WTI crude oil chart is $67.00.
If there is a downside break, the price might decline toward $66.55. Any more losses may perhaps open the doors for a move toward the $66.10 support zone.
This article represents the opinion of the Companies operating under the FXOpen brand only. It is not to be construed as an offer, solicitation, or recommendation with respect to products and services provided by the Companies operating under the FXOpen brand, nor is it to be considered financial advice.
