One Last Dip Before the Pop?On the daily timeframe, we anticipate two possible scenarios for USOIL’s movement. In the red-labeled scenario, USOIL is expected to undergo a correction to test the 63.71–64.03 area. However, in the best-case scenario, if USOIL manages to hold above 64.03, it has the potential to strengthen toward the 68.27–72.53 range.
Usoilanalysis

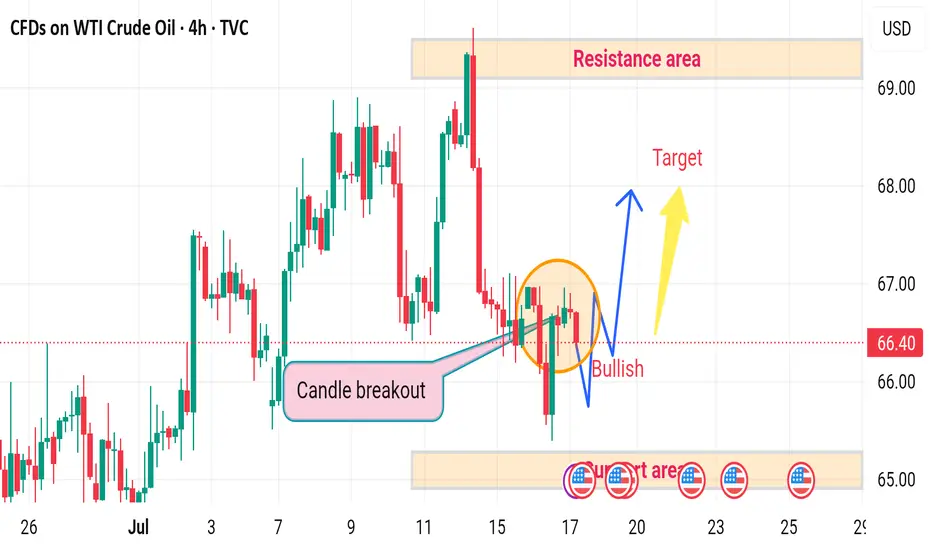
USOIL H4 bullish upward ⚠️ Disrupted Analysis – WTI Crude Oil (4H Chart)
🔻 Bearish Pressure Re-Entering
Despite a temporary candle breakout, the price failed to sustain above the breakout trendline.
The recent price action inside the orange circle shows lower highs and rejection wicks, indicating bullish weakness.
📉 Potential Breakdown Risk
If the price fails to hold above 66.00, there's a high probability of it breaking below the support area around 64.80–65.00, leading to:
Increased bearish momentum
Retesting lower demand zones, possibly around 63.50–64.00
❌ Resistance Area Still Valid
The Resistance area at 68.00–69.00 remains unchallenged.
The "Target" shown is optimistic under current momentum.
Without strong volume and bullish candles, that target remains unlikely in the near term.
🔁 Disruption Summary
The bullish breakout is likely a false breakout.
Market may be forming a bull trap.
Watch for a clean break below 65.00 for confirmation of a bearish reversal.
Crude Oil -DAILY- 21.07.2025Oil prices were steady after their first weekly decline this month, as attention shifted to U.S. trade negotiations and the European Union’s push to tighten restrictions on Russian energy exports. The EU is preparing new sanctions, including a lower price cap on Russian crude, limits on fuel refined from Russian oil, banking restrictions, and bans targeting an Indian refinery and Chinese firms. Despite western sanctions, Russian oil continues flowing to China and India. Meanwhile, diesel margins in Europe remain strong, signaling tight supply.
On the technical side, the price of crude oil has failed to break below the major technical support area, which consists of the 50-day simple moving average and the 50% of the weekly Fibonacci retracement level. The Stochastic oscillator has been in the neutral level since last week hinting that there is potential for the price to move to either direction in the near short term. On the other hand, the Bollinger bands have contracted rather massively showing that volatility has dried up therefore, the recent sideways movement might extend in the upcoming sessions.
Disclaimer: The opinions in this article are personal to the writer and do not reflect those of Exness

Crude oil rebounds after a correction!International oil prices continued to climb on Monday, though the gains were limited. Brent crude futures rose 8 cents to $70.44 per barrel, extending Friday's 2.51% rally. U.S. WTI crude edged up 5 cents to $68.50 per barrel, after surging 2.82% in the previous trading session.
The primary driver behind the current upward move stems from market expectations of further escalation in U.S. sanctions against Russia. U.S. President Trump stated on Sunday that he would provide Ukraine with the "Patriot" air defense missile system and deliver a "major announcement" on Russia-related issues on Monday. "Trump is dissatisfied with the Russian President's failure to advance the peace process, a stance exacerbated by Russia's continued bombing of Ukrainian cities in recent days.
In the short term (1-hour timeframe), crude oil has shown high volatility, with prices finding support at the lower edge of the wide trading range and moving higher again. The objective short-term trend direction is upward within the range, with sufficient bullish momentum. However, given the high probability of recent erratic price swings, there is a greater likelihood that intraday crude oil prices will encounter resistance at the upper edge of the range and pull back.
you are currently struggling with losses,or are unsure which of the numerous trading strategies to follow,You have the option to join our VIP program. I will assist you and provide you with accurate trading signals, enabling you to navigate the financial markets with greater confidence and potentially achieve optimal trading results.
(2-hour timeframe for WTI Crude Oil (USOIL).(2-hour timeframe for WTI Crude Oil (USOIL)), here’s the technical analysis and target zones:
🟦 Key Observations:
Price is trading in an ascending channel.
I'm using the Ichimoku Cloud for trend confirmation.
There are two clear target zones marked with arrows.
---
🎯 Target Levels (as shown on chart):
1. First Target Zone: ~$74.50
This is the intermediate resistance level.
Price is expected to break above ~$69, then head toward this zone.
2. Final Target Zone: ~$76.50–77.00
This is the major resistance area, possibly the upper end of a swing move.
Could be reached if momentum remains strong and no major reversal occurs.
---
📌 Current Price:
$68.66 (Sell) / $68.76 (Buy) — as of the screenshot.
📈 Suggested Strategy (based on the chart setup):
Entry: On breakout above ~$69.00 with volume confirmation.
First TP: ~$74.50
Second TP: ~$76.50–77.00
Stop-Loss: Below the lower channel support (~$66 or tighter, depending on your risk tolerance).

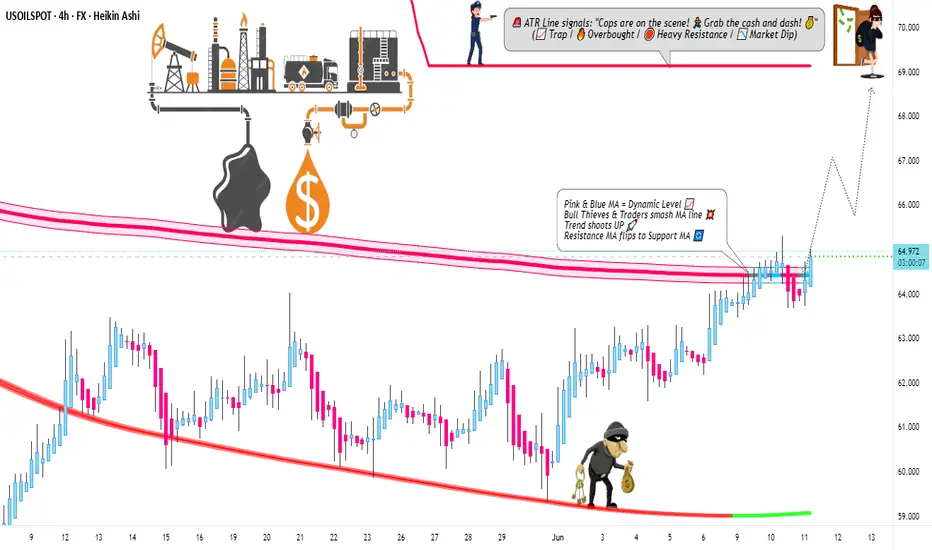
WTI Oil Heist: Bullish Breakout Plan for Big Gains!🚨 Ultimate WTI Oil Heist Plan: Bullish Breakout Strategy for Big Profits! 🚀💰
🌟 Hello, Wealth Chasers & Market Mavericks! 🌟
Hola, Bonjour, Hallo, Marhaba! 🗺️
Get ready to execute the Ultimate WTI / US Oil Spot Heist using our 🔥 Thief Trading Style 🔥, blending sharp technicals with powerful fundamentals! 📈💡 This swing trade plan targets the energy market’s bullish potential, but stay sharp—volatility lurks! 🚨 Follow the chart setup for a long entry, and let’s aim for those juicy profits while dodging the high-risk ATR zone where the market “police” might trap overzealous traders. 🏦⚠️
📊 The Heist Plan: WTI / US Oil Spot (Swing Trade)
Entry 📈:
The breakout is your signal! 🎯 Wait for the Moving Average crossover and a confirmed pullback at $68.00 on the 2H timeframe. Once it triggers, go long and ride the bullish wave! 🐂 Set an alert to catch the breakout in real-time. 🚨
Stop Loss 🛑:
Protect your capital like a pro! 💪 Place your stop loss below the recent swing low at $65.00 (2H timeframe, candle body wick). Adjust based on your risk tolerance, lot size, and number of positions. Rebels, beware—straying too far from this level could burn you! 🔥
Target 🎯:
Aim for $73.80 or exit early if momentum fades. Scalpers, stick to long-side trades and use a trailing stop to lock in gains. 💰 Swing traders, follow the plan and secure profits before the market consolidates or reverses. 🏴☠️
📊 Market Context & Key Drivers
The WTI / US Oil Spot market is currently consolidating with a bullish bias 🐂, driven by:
Fundamentals: Check macroeconomic data, seasonal trends, and intermarket correlations. 📉
COT Report: shows net-long positions increasing, signaling bullish sentiment. 📅
Sentiment & Quantitative Analysis: Market mood leans positive, but overbought risks loom near the ATR zone. ⚠️
Stay informed! 📰 Monitor news releases, as they can spike volatility. Avoid new trades during major announcements and use trailing stops to protect open positions. 🔒
📊 Pro Tips for the Heist
Scalpers: Go long with tight trailing stops to safeguard profits. 💸
Swing Traders: Stick to the plan, adjust stops based on risk, and exit before the high-risk ATR zone ($73.80+). 🚪
Risk Management: Never risk more than you can afford. Tailor your lot size and stop loss to your account size. 🛡️
Stay Updated: Market conditions shift fast—keep an eye on fundamentals and sentiment to stay ahead. 👀
📊 Why Join the Heist?
This Thief Trading Style plan is your ticket to navigating the WTI market with confidence! 💪 Boost this idea to strengthen our trading crew and share the wealth-making vibe. 🚀💥 Like, follow, and stay tuned for more high-octane strategies! 🤑🐱👤
Disclaimer: This is a general market analysis, not personalized investment advice. Always conduct your own research and consider your risk tolerance before trading. Markets are dynamic—stay vigilant and adapt to new developments. 📡
Let’s make this heist legendary! 🌟💰 See you at the next breakout! 🤝🎉

USOIL:Today's Trading Strategy
Oil prices have signs of upward breakthrough at present, yesterday's trend broke the short - term narrow range of shock range, on the idea of retracting to do more. The more appropriate long point is 66-66.3, if short, the more appropriate point is 67-67.4, but the short position is recommended not to be too heavy, not to do less than the point.
Trading Strategy:
SELL@67-67.4
TP: 66-66.3
BUY@66-66.3
TP: 67.5-68
More detailed strategies and trading will be notified here ↗↗↗
Keep updated, come to "get" ↗↗↗

USOIL : What will happen to the price of oil?Hello friends
As you can see, we had support in the past, which has now become a strong resistance for the price after it was broken.
Now we need to see if the price will manage to break it at this moment when it is close to its key and sensitive resistance.
*Trade safely with us*

USOIL:Narrow trading strategy
USOIL: There is no update in the past two days, because the oil price still continues to fluctuate in a narrow range, and the space for volatility is gradually reduced, which is not very different from our overall trading idea. The original long target of 65.9-66.4 can be adjusted to 65.8-66.2 with the reduction of the space for volatility. It is expected that the trend will come out this week, and we will adjust our thinking then.
Friends who do not trade at present can refer to the interval trading strategy within a day:
BUY@64.7-65
TP: 65.8 to 66.2
SELL@65.8-66.2
TP: 64.7-65
More detailed strategies and trading will be notified here ↗↗↗
Keep updated, come to "get" ↗↗↗

USOIL:Today's trading strategy
Oil prices have been sideways for the fourth trading day, volatility began to narrow, the market is brewing a new round of trend, short-term range 64-66.4. Today you can sell high and buy low around a narrow range.
Trading Strategy:
BUY@64.7-65.1
TP: 65.9-66.4
SELL: 66-66.4
TP: 65.1-64.5
More detailed strategies and trading will be notified here ↗↗↗
Keep updated, come to "get" ↗↗↗

#USOIIL #WTI 1H📈 #USOIL 1H Buy Setup – Liquidity Sweep in Play
Crude Oil is consolidating after a sharp decline, forming a potential setup for a liquidity sweep below the current range, followed by a bullish reversal. We're anticipating a fakeout move to grab sell-side liquidity before price targets the Fair Value Gap (FVG) and premium supply zone above.
🟩 Buy Limit: 64.50 / 64.00
🎯 Targets: 70.00 → 72.00+
❌ Stop Loss: 63.00
This setup offers high risk-to-reward potential if the liquidity sweep plays out as expected. Monitor price action closely at the buy zone.
#CrudeOil #WTI #SmartMoney #TradingStrategy

Latest Long - Short Trading Recommendations for Crude OilDuring Monday's Asian trading session, international oil prices fell, primarily due to the combined impact of eased geopolitical tensions in the Middle East and expectations of OPEC+ production increases, which raised market supply outlooks. Although the two major benchmark oil prices recorded their largest weekly decline since March 2023 last week, they are still set to post consecutive monthly gains for June, with increases exceeding 5% each. The market had previously surged due to Middle East tensions. Since Israel struck Iranian nuclear facilities on June 13, the situation rapidly deteriorated, and the U.S. subsequently air-raided Iranian nuclear targets, pushing Brent prices to briefly surge above $80 per barrel. Current oil price movements are clearly constrained by a dual influence of geopolitics and supply expectations. While geopolitical conflicts have temporarily eased, the long-term stability of the Middle East situation remains uncertain. On the other hand, the game between OPEC+'s orderly production increase and insufficient U.S. shale oil production momentum will determine the direction of oil price fluctuations in the coming months. Against the backdrop of a moderate global economic recovery, oil prices maintaining a range of $60-70 per barrel may become a short-term norm.
you are currently struggling with losses,or are unsure which of the numerous trading strategies to follow,You have the option to join our VIP program. I will assist you and provide you with accurate trading signals, enabling you to navigate the financial markets with greater confidence and potentially achieve optimal trading results.
Trading Strategy:
sell@66.3-66.9
TP:63.1-63.3

USOIL:Sharing of the Latest Trading StrategyAll the trading signals last week have resulted in profits!!! Check it!!!👉👉👉
Fundamental Analysis:
The ceasefire agreement between Israel and Iran has eased tensions in the Middle East, the primary factor behind the recent decline in oil prices. Meanwhile, market rumors suggest the U.S. may ease sanctions on Iran, which—if realized—would raise expectations of increased crude supply and further pressure oil prices.
Additionally, OPEC+ plans to continue increasing production by 411,000 barrels per day in July, with supply growth expectations exerting long-term downward pressure on oil.
Technical Analysis (4-Hour Chart):
USOIL prices have pulled back from highs and currently hover near $65.20, approaching the S2 pivot point at around $64.69 and the 4-hour 200-period moving average. The prior appearance of a long candlestick may signal short-term support.
Notwithstanding, the current market remains in a bearish trend, so the strategy prioritizes buying on rebounds.
Trading Strategy:
Sell@67-66
TP:65-64

OIL |Bearish Pressure Builds as OPEC+ Prepares Fresh Output Hike OIL | Market Overview
Oil prices edged lower on Monday despite strong seasonal demand, as the market prepares for an increase in supply. OPEC+ is set to raise production by 411,000 barrels per day starting Tuesday, marking the fourth monthly increase in output. Another similar hike is reportedly under consideration for August, which may further pressure prices.
Technical Outlook
The price remains within the bearish zone and is expected to continue its decline as long as it trades below the pivot level at 65.83.
A daily candle close above 65.83 is required to confirm a potential bullish reversal.
Until then, the bearish trend remains intact, targeting 63.47, 61.83, and potentially 60.16.
Key Levels
Pivot: 65.83
Support: 63.47 / 61.83 / 60.16
Resistance: 68.33 / 69.55

Bulls on the Loose: US Oil Spot/WTI Heist Strategy! 🚨💰 THE OIL VAULT HEIST: US OIL SPOT/WTI TRADING STRATEGY 💸🔫
🌟Hi! Hola! Ola! Bonjour! Hallo! Marhaba!🌟
Dear Money Makers & Robbers 🤑💰💸✈️
Based on our 🔥Thief Trading style analysis🔥 (both technical and fundamental), here’s the master plan to heist the US Oil Spot/WTI Energy Market. Follow the blueprint carefully—this strategy focuses on long entries, with a daring escape planned near the high-risk Red ATR line Zone where bearish robbers and consolidation traps await. 🏆💸 Take your profit and treat yourself, fellow traders—you earned it! 💪🏆🎉
🕵️♂️ Entry 📈
💥 The vault is wide open! Time to swipe that bullish loot—heist is on!
Place buy limit orders within the 15 or 30-minute timeframe, near swing lows/highs for pullback entries.
🛑 Stop Loss 🛑
📍 Thief’s SL—recent swing low and below the moving average (4H timeframe) for day/swing trades.
📍 Adjust SL based on risk, lot size, and number of orders.
🎯 Target
🏴☠️💥 69.000 (Aim for the big loot!) OR escape before the target
🔥 Market Heist Overview
The UK Oil Spot/Brent market is currently showing bullishness 🐂, driven by key factors—perfect for a day/scalping trade robbery! ☝☝☝
📰 Additional Tools & Analysis
📊 Get the Fundamental, Macro, COT Report, Quantitative Analysis, Sentiment Outlook, Intermarket Analysis, Future Targets—check our bi0 liinks 👉👉👉🔗🔗
⚠️ Trading Alert: News Releases & Position Management
📰 News can rattle the vault! 💥
✅ Avoid new trades during news releases.
✅ Use trailing stop-loss orders to protect profits.
💖 Supporting our heist plan?
💥 Smash the Boost Button 💥 to empower the robbery team.
Let’s make money every day in this market with the Thief Trading Style! 🏆💪🤝❤️🎉🚀
👀 Stay tuned for the next robbery plan, thieves! 🤑🐱👤🤗🤩
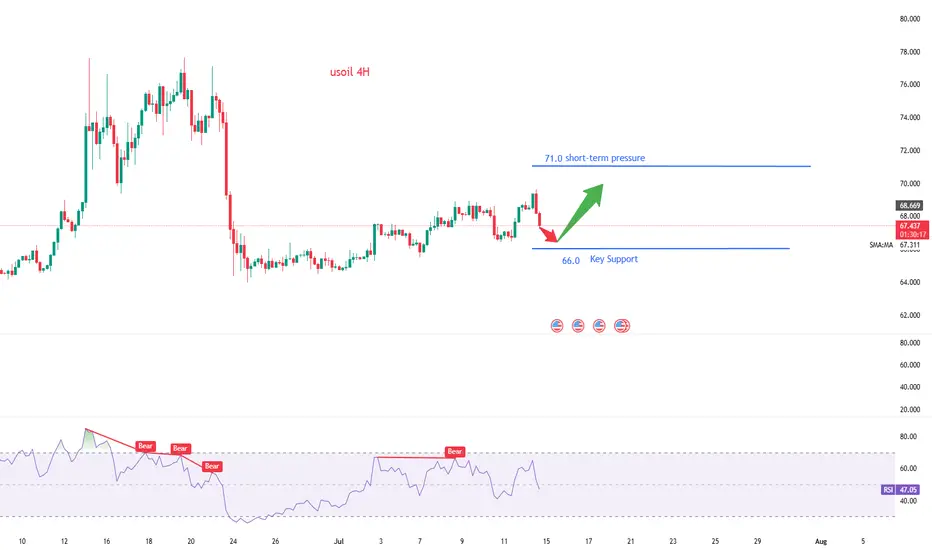
Analysis of Crude Oil's Opening Market Strategy on MondayWTI crude oil futures stabilized for the second consecutive day, maintaining fluctuations within the broad range of Tuesday and oscillating around the key level of $65.12. A sustained break below this level would confirm the resurgence of selling pressure, and a breach of $64.00 could trigger a decline toward $61.90. On the upside, if the price holds above $65.12, it may drive a short-term rebound to $67.44, and if momentum strengthens, it could further test $71.20.
Crude oil prices remain range-bound, but downward pressure is building. Robust U.S. demand provides support, yet macroeconomic caution and uncertainties over OPEC+ intentions are suppressing market sentiment. A decisive break below $65.12 would confirm the bearish trend, with bears targeting $61.90. Conversely, if this level holds, neutral-to-bullish logic remains valid, though upside potential remains constrained unless supply-demand signals converge overall.
you are currently struggling with losses,or are unsure which of the numerous trading strategies to follow,You have the option to join our VIP program. I will assist you and provide you with accurate trading signals, enabling you to navigate the financial markets with greater confidence and potentially achieve optimal trading results.
Trading Strategy:
buy@63.1-63.3
TP:66.3-69.9

USOIL:Go long
usoil: Let's start with a short-term rebound.
Trading idea:
BUY@64.8-65.2
TP: 66-66.4
More detailed strategies and trading will be notified here ↗↗↗
Keep updated, come to "get" ↗↗↗

Here is the latest analysis of the crude oil market trendOn Wednesday, international oil prices stabilized and rebounded after two consecutive days of correction, as the market reassessed the short-term easing of the Middle East situation and changes in crude oil supply. Brent crude oil futures rose by $0.75, or 1.1%, to $67.89 per barrel; WTI crude oil rose by $0.71 to $65.08. Previously, U.S. air strikes damaged key Iranian facilities. Although they did not completely destroy its capabilities, they triggered short-term market concerns about supply chain disruptions.
When geopolitical tensions temporarily eased, the market also turned its attention to inventory data. The latest data from the American Petroleum Institute (API) showed that for the week ending June 20, U.S. crude oil inventories fell by 4.23 million barrels, far exceeding the market expectation of a 2.5 million barrel decline, indicating that refinery demand remained strong. Under the dual effect of the mitigation of geopolitical risks and the bullish API inventory data, oil prices showed signs of stabilization, but the foundation for the rise was still fragile.
In the next few trading days, the safety of the Strait of Hormuz and the EIA official inventory report will become the key to whether the bulls can continue. In the current volatile pattern, it is necessary to remain cautious and pay close attention to changes in the technical support area and U.S. policy dynamics.
However, in terms of momentum, the MACD indicator has formed a bearish crossover below the zero axis, signaling a weakening of bullish momentum. This suggests that the medium-term trend of crude oil is likely to fall into a high-level consolidation pattern.
you are currently struggling with losses,or are unsure which of the numerous trading strategies to follow,You have the option to join our VIP program. I will assist you and provide you with accurate trading signals, enabling you to navigate the financial markets with greater confidence and potentially achieve optimal trading results.
Trading Strategy:
sell@67.0-68.0
TP:63.0-64.0

USoilLatest news. If the Strait of Hormuz is closed, the restrictions on the import and export of oil and natural gas will increase greatly. Because 20% of the world's oil and natural gas exports come from the Strait of Hormuz. So the trend of geopolitics will affect the closing and opening of this important checkpoint. If the increase in geopolitics really reaches this point, the price of oil may rise to 90$-100$. This is an excellent trading opportunity for investors who like to trade oil. But at present, this is an option for Iran to negotiate. Rather than a real closure, after all, the incident has not developed to this situation. If you like to trade oil. You can also follow me. Get brand new trading opportunities and make profits. Do not trade independently to avoid losses.

Will crude oil prices continue to decline?On Tuesday, oil prices fell by 6%, hitting a two-week low, as market expectations that a ceasefire between Israel and Iran would reduce the risk of supply disruptions in Middle Eastern oil. WTI crude oil fell below $64 per barrel intraday, eventually closing down 3.35% at $64.96 per barrel; Brent crude oil closed down 3.7% at $67.73 per barrel. With the easing of the Israel-Iran conflict, the trading logic of the crude oil market will return to fundamentals. For now, the consumption peak season has hedged the pressure from OPEC+ production increases. Although U.S. crude oil demand has not shown eye-catching performance, OPEC+ production increases have also fallen short of expectations. In the later stage, attention needs to be paid to the geopolitical situation and the landing of OPEC+ production increases. Looking ahead to the second half of the year, factors such as continued OPEC+ production increases, weak demand, and supply surplus will still dominate oil price movements. The daily chart of crude oil closed with a bearish hammer line, in a two-day bearish pattern. After breaking the high, crude oil fell rapidly, indicating signs of the end of the oil price rally. Today, the focus is on whether the oil price continues to break down.
you are currently struggling with losses,or are unsure which of the numerous trading strategies to follow,You have the option to join our VIP program. I will assist you and provide you with accurate trading signals, enabling you to navigate the financial markets with greater confidence and potentially achieve optimal trading results.
Trading Strategy:
sell@67.0-68.0
TP:63.0-64.0

USOIL Expected to Rebound to the 68–70 ZoneUSOIL has shown signs of short-term overselling, and a technical rebound is likely during today’s session. Traders participating in crude oil can consider buying on dips, focusing on short-term opportunities with proper position management. Quick entries and exits are recommended.

The latest layout for crude oil today.With geopolitical risks gradually easing, oil prices have deviated significantly from macroeconomic and fundamental guidance. While Iran's situation has shown signs of mitigation, the single-day decline in oil prices was excessive. We believe current oil prices have reached a reasonable range: short positions can still be held, but chasing further shorting is no longer advisable.
On the daily chart, crude oil formed a large bearish candlestick with both no upper and lower shadows, directly breaking below support and continuing to decline. After breaking above the previous high, the breakdown of support indicates that oil prices are falling back again to seek a new trading range. Today, the focus remains on the sustainability of the bearish momentum.
you are currently struggling with losses,or are unsure which of the numerous trading strategies to follow,You have the option to join our VIP program. I will assist you and provide you with accurate trading signals, enabling you to navigate the financial markets with greater confidence and potentially achieve optimal trading results.
Trading Strategy:
sell@68.5-69.0
TP:64.5-64.0

Crude Oil Strategy LayoutThe rise in oil prices on Monday will not only push up household daily expenses such as fuel and heating costs, but also increase corporate operating costs, which may in turn suppress consumption and investment activities. Ellen Zentner, Chief Economic Strategist at Morgan Stanley, pointed out in a Sunday analysis that against the backdrop of the Trump administration's high tariff policies, the U.S. economy was already facing pressure from a slowdown in growth, and the further increase in oil prices would exert "powerful pressure" on household consumption capacity. This may not only weaken consumers' willingness to purchase, but also drag down the pace of overall economic growth.
Crude oil showed a gap-up and then decline trend today, falling sharply from around $77.7. Oil prices gradually corrected today, with the lowest point touching around $72.5 and hovering there. Currently, oil prices are hovering above the support level of 72.0, which is expected to be the bottom support of the box movement. Taken together, crude oil is in a high-range consolidation. In terms of operation, it is considered to lay out long positions on pullbacks.
you are currently struggling with losses,or are unsure which of the numerous trading strategies to follow,You have the option to join our VIP program. I will assist you and provide you with accurate trading signals, enabling you to navigate the financial markets with greater confidence and potentially achieve optimal trading results.
Trading Strategy:
buy@72.0-72.5
TP:75.0-75.5
