US-Oil will further push upside After Testing TrendlineHello Traders
In This Chart XTIUSD HOURLY Forex Forecast By FOREX PLANET
today XTIUSD analysis 👆
🟢This Chart includes_ (XTIUSD market update)
🟢What is The Next Opportunity on XTIUSD Market
🟢how to Enter to the Valid Entry With Assurance Profit
This CHART is For Trader's that Want to Improve Their Technical Analysis Skills and Their Trading By Understanding How To Analyze The Market Using Multiple Timeframes and Understanding The Bigger Picture on the Charts
Usoilanalysis

Crude Oil Market Trend Forecast for Next WeekThe oil price continued its upward trend this week, despite a brief correction on Friday. As of Friday's Asian session, Brent crude oil futures dropped by $1.57, or 2%, to $77.28 per barrel. However, the cumulative weekly gain reached 3.9%, marking three consecutive weekly increases. Geopolitical risks continued to fuel market sentiment. Oil prices surged nearly 3% on Thursday after Israel bombed Iranian nuclear targets, following Iran's missile strikes on Israel after its earlier missile attack on an Israeli hospital. The focus of the current crude oil market has shifted entirely from supply-demand fundamentals to geopolitical risks. Although Iran's crude oil exports have not been substantially disrupted, investors have started to price in the worst-case scenario. If the situation further deteriorates and affects shipping routes through the Strait of Hormuz, global energy prices may face a new round of sharp volatility.
In the short term, oil prices still exhibit upward potential, with the current trend maintaining an overall upward trajectory. The MACD indicator's fast and slow lines overlap with bullish bars above the zero axis, signaling robust bullish momentum. This suggests that the medium-term trend is expected to usher in an upward rally.
you are currently struggling with losses,or are unsure which of the numerous trading strategies to follow,You have the option to join our VIP program. I will assist you and provide you with accurate trading signals, enabling you to navigate the financial markets with greater confidence and potentially achieve optimal trading results.
Trading Strategy:
buy@72.0-72.5
TP:75.0-75.5

USOILUSOIL will be bullish this week due to geopolitics and especially Iran/Israel War and Hormuz Strait closure.
Disclosure: We are part of Trade Nation's Influencer program and receive a monthly fee for using their TradingView charts in our analysis.

USOIL:Waiting to go long
The impact of the news is still continuing, the situation did not ease in a short period of time, there is still a rise, the above large space to see 76-77, trading ideas on the long space and advantages are greater. Intraday short - term trading to consider low long.
Trading Strategy:
BUY@72.8-73.2
TP: 74.5-75
More detailed strategies and trading will be notified here ↗↗↗
Keep updated, come to "get" ↗↗↗

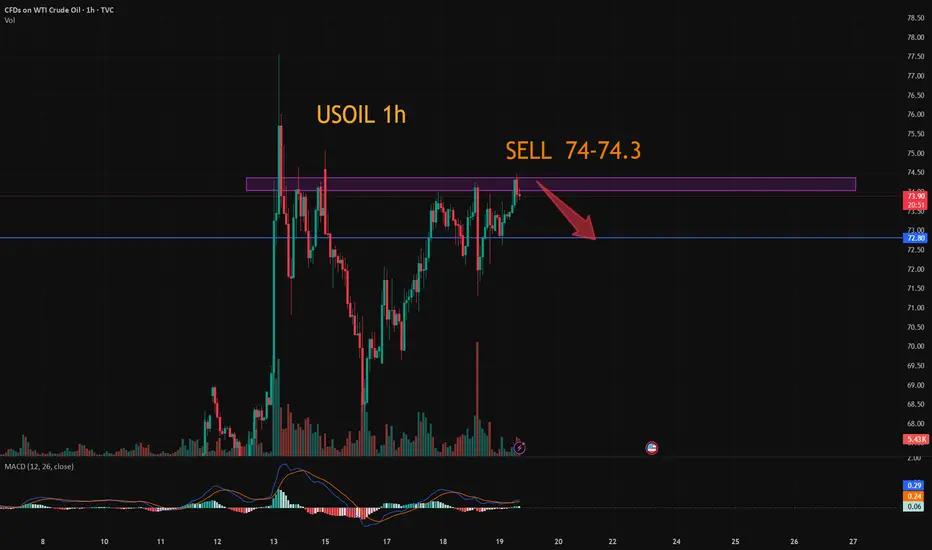
USOIL:The trading strategy of going short
USOIL: Consider shorting for now, as there are signs of a top above 74.5, but I think this is only a short-term high and will continue to surge higher. The trading idea is to sell short today and wait for the right position to be long.
Trading Strategy:
SELL@74-74.3
TP: 73.2-72.7
↓↓↓ More detailed strategies and trading will be notified here ↗↗↗
↓↓↓ Keep updated, come to "get" ↗↗↗
Will oil prices fall after the sharp surge in crude oil?Oil prices corrected under the dual pressure of news-driven factors and inventory data. Brent crude oil futures traded in a narrow range, reaching $76.38 per barrel, while WTI July contracts edged down to $73.35 per barrel. With intensified geopolitical uncertainties, market sentiment remains dominated by wait-and-see attitudes. The unexpected increase in EIA crude oil inventories dampened market optimism. According to the latest data from the U.S. Energy Information Administration (EIA), crude oil inventories in the U.S. increased by 2.6 million barrels for the week ending June 14, far exceeding the market expectation of a 1.1 million barrel decline, indicating weak demand. The rebound in inventories has exerted downward pressure on oil prices.
Oil prices have repeatedly crossed the moving average system, with the short-term objective trend showing a range-bound rhythm. In terms of momentum, the MACD indicator is intertwined near the upper side of the zero axis, reflecting weak bullish momentum. It is expected that crude oil prices will mainly maintain a consolidative pattern, with the trading range between 79.00 and 73.00.
you are currently struggling with losses,or are unsure which of the numerous trading strategies to follow,You have the option to join our VIP program. I will assist you and provide you with accurate trading signals, enabling you to navigate the financial markets with greater confidence and potentially achieve optimal trading results.
Trading Strategy:
buy@75.0-76.0
TP:78.0-79.0

Analysis of the latest crude oil market trendCrude oil prices stabilized after a sharp rise on Tuesday, with the market keeping a close eye on the potential escalation of conflicts in the Middle East. According to market surveys, Iran's crude oil export infrastructure has not been directly hit so far, and most of the impacts are still concentrated on shipping. However, analysts point out that if the conflict spreads to the entire region, oil prices are likely to rise further significantly. The current rise in crude oil prices is not only dominated by actual supply and demand but is highly influenced by geopolitics. Market sentiment is extremely vulnerable to disturbances from external events. As the global energy artery, the stability of the Strait of Hormuz provides strong support for oil prices. When the uncertainty of the geopolitical situation intensifies, attention should be paid to the release of U.S. official inventory data and the development of diplomatic processes.
Technical analysis of crude oil: The moving average system is in a bullish arrangement, and the medium-term objective trend direction is upward. The current trend is in the rhythm of the main upward trend. The fast and slow lines of the MACD indicator coincide with the bullish columns above the zero axis, indicating that the bullish momentum is currently full. It is expected that the medium-term trend is expected to usher in a rising rhythm.
you are currently struggling with losses,or are unsure which of the numerous trading strategies to follow,You have the option to join our VIP program. I will assist you and provide you with accurate trading signals, enabling you to navigate the financial markets with greater confidence and potentially achieve optimal trading results.
Trading Strategy:
buy@72.0-72.5
TP:74.0-74.5

USOIL:Go short before you go long
The idea of crude oil is still to go long. Today, the more appropriate entry point is 72-72.3, there is still a little space at present, if you consider selling short first, then the more appropriate short point is 73-73.3 range. Give to the point to do, to wait to do more.
Trading Strategy:
SELL@73-73.3
TP: 72-72.3
BUY@72-72.3
TP: 73.7-74
↓↓↓ More detailed strategies and trading will be notified here ↗↗↗
↓↓↓ Keep updated, come to "get" ↗↗↗

USOIL - Near CUT n REVERSE Area? holds or not??#USOIL.. straight bounce after #IranvsIsrael war situation, and now market just reached near to his current Resistance Area / region
keep close that region and if market holds then drop expected otherwise not at all.
NOTE: we will go for cut n reverse above region on confirmation.
good luck
trade wisely

USOIL:A long trading strategy
Oil prices also fell sharply under the stimulus of the news, and then completed the correction rebound in the sub-session, and now back to around 71 again. The current trend is in the upward rhythm of the main trend, and it is expected that the trend of crude oil will be mainly in the form of shock consolidation.
Trading ideas than yesterday did not change too much, adjust the appropriate profit point.
Trading Strategy:
BUY@70.5-70.8
TP: 71.8-72.3
↓↓↓ More detailed strategies and trading will be notified here ↗↗↗
↓↓↓ Keep updated, come to "get" ↗↗↗

USOIL 1 - Hour Chart AnalysisUSOIL 1 - Hour Chart Analysis
Key Levels
Support: ~69.50 (short - term), 67.70 (critical backup).
Resistance: 73.50 (major hurdle, tested before).
Trend, Pattern & Middle East Conflict
Price oscillates between support/resistance, with a potential “V - shaped reversal”. Middle East conflicts add high uncertainty:
Escalation: Fears of supply cuts could push price above 73.50 rapidly.
De - escalation: May pressure price down, but 67.70/69.50 still get support from lingering supply - risk worries.
Trading Strategies
Bullish: If 69.50 holds (e.g., long lower shadows/bullish candles), small - size long. Target 73.50; stop - loss ~69.20. Watch for sudden conflict news.
Bearish: If 69.50 breaks (consecutive closes below), short. Target 67.70; stop - loss ~69.80. Stay alert to conflict updates.
Note: Oil prices hinge on supply - demand, Middle East tensions, and the USD. Combine tech/fundamental analysis; manage risk strictly.
⚡️⚡️⚡️ USOil ⚡️⚡️⚡️
🚀 Buy@ 70.50 - 71.00
🚀 TP 73.00 - 74.00
Accurate signals are updated every day 📈 If you encounter any problems during trading, these signals can serve as your reliable guide 🧭 Feel free to refer to them! I sincerely hope they'll be of great help to you 🌟 👇

The latest long - short trading recommendations for crude oil.On Monday, the two benchmark oil prices fell by more than 1% due to media reports that Iran might seek to ease the situation. However, the market's short-term optimism proved unsustainable. Currently, oil price movements are driven primarily by geopolitics rather than fundamentals. Market sensitivity to the Middle East situation has surged to an extremely high level, with even the slightest development triggering violent volatility. The possibility of supply disruptions remains high in the short term, and close attention should be paid to Iran's oil export trends and the actual execution of OPEC+ after its meeting. Meanwhile, be wary of the risk of sharp consolidation amid mixed geopolitical and negotiation news.
In terms of momentum, the fast and slow lines of the MACD indicator have crossed below the zero axis, forming a golden cross with an upward divergence, indicating a stalemate between bullish and bearish momentum. In terms of patterns, a flag continuation pattern has emerged, with penetration of the upper edge of the flag, and the overall trend is in a secondary rhythm. It is expected that crude oil prices will mainly fluctuate and consolidate within the pattern.
you are currently struggling with losses,or are unsure which of the numerous trading strategies to follow,You have the option to join our VIP program. I will assist you and provide you with accurate trading signals, enabling you to navigate the financial markets with greater confidence and potentially achieve optimal trading results.
Trading Strategy:
buy@70.0-71.0
TP:74.0-75.0
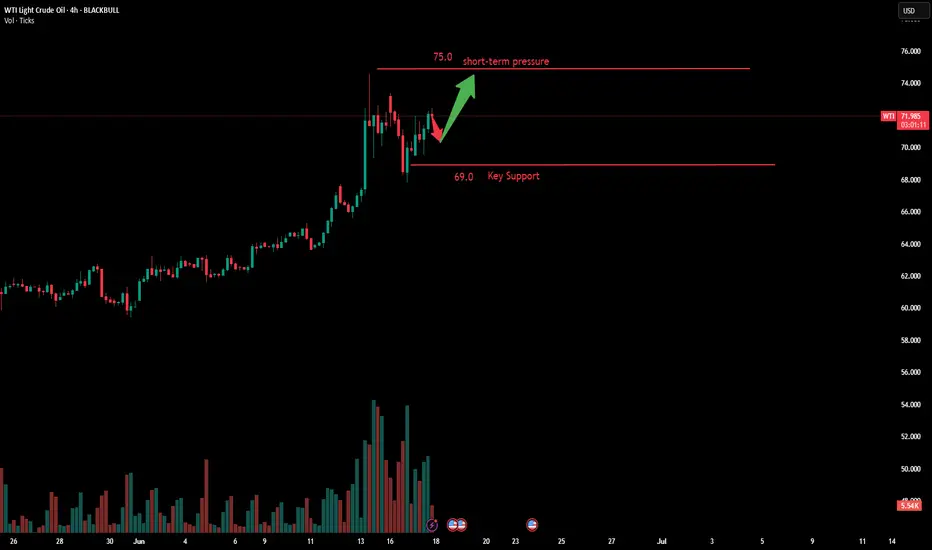
Crude oil continues to decline - latest market trend analysisThe international oil market is currently experiencing a classic upward cycle of "geopolitical risk premium". In the short term, oil prices will be highly sensitive to any news regarding the security of the Strait of Hormuz. Crude oil has continued its volatile upward trend in the short term, surging to test the price near $74. The moving average system is bullishly aligned with oil prices, and the objective short-term trend direction remains upward.
In early trading, oil prices hit a new high near $75.30, but then surged and fell, closing with a bearish real body K-line. The short-term momentum still favors the bulls, and it is expected that the intraday trend of crude oil will continue to maintain a high-level volatile upward rhythm.
you are currently struggling with losses,or are unsure which of the numerous trading strategies to follow,You have the option to join our VIP program. I will assist you and provide you with accurate trading signals, enabling you to navigate the financial markets with greater confidence and potentially achieve optimal trading results.
Trading Strategy:
buy@68.5.0-69.5
TP:73.0-74.0
USOIL:Go long
USOIL: Short-term momentum is still dominant, the trend of crude oil is expected to maintain a high shock upward rhythm.
Trading Strategy:
BUY@70.5-71
TP: 73-73.6
↓↓↓ More detailed strategies and trading will be notified here ↗↗↗
↓↓↓ Keep updated, come to "get" ↗↗↗

Crude Oil to Continue Breaking Higher HighsMiddle East Tensions Escalate Sharply: Israel Launches Preemptive Strike on Iran, Targeting Nuclear-related Facilities
Iran's state media confirmed that senior Revolutionary Guard leaders were killed in the attack, with nuclear scientists and facilities also suffering heavy damage. In the short term, geopolitical risks will continue to dominate market sentiment. Oil prices are likely to oscillate at high levels or even edge higher. From a daily chart perspective, crude oil's moving average system forms a bullish arrangement, confirming the unchanged short-term objective uptrend. The morning session K-line closes as a large bullish candlestick, aligning with the primary upward trend. The MACD indicator is bullishly diverging above the zero axis, with bullish momentum prevailing. Intraday crude oil is expected to continue breaking higher.
Humans need to breathe, and perfect trading is like breathing—maintaining flexibility without needing to trade every market swing. The secret to profitable trading lies in implementing simple rules: repeating simple tasks consistently and enforcing them strictly over the long term.
Trading Strategy:
buy@70.0-71.0
TP:74.0-75.0
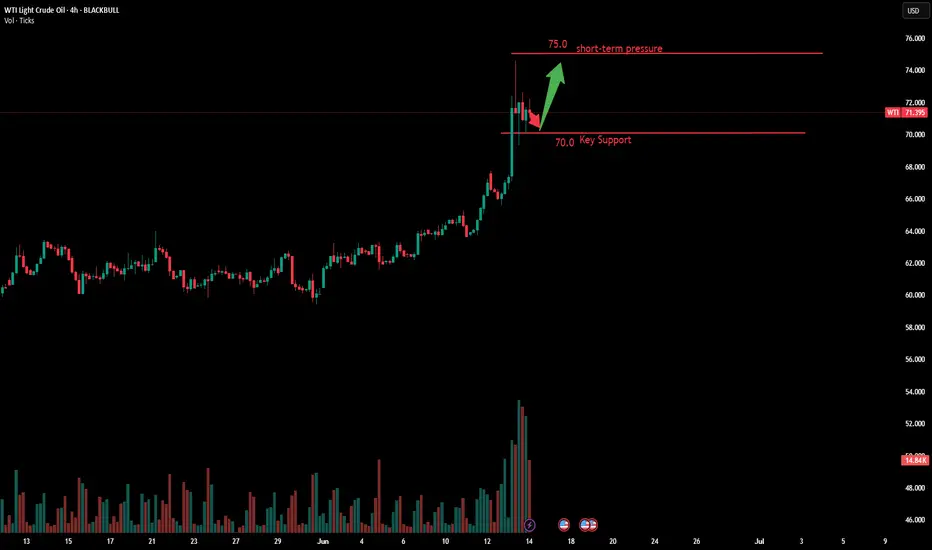
USOIL:Go long
Stay on the long side.
Trading Strategy:
BUY@71.8-72.3
TP: 74-74.3
↓↓↓ More detailed strategies and trading will be notified here ↗↗↗
↓↓↓ Keep updated, come to "get" ↗↗↗

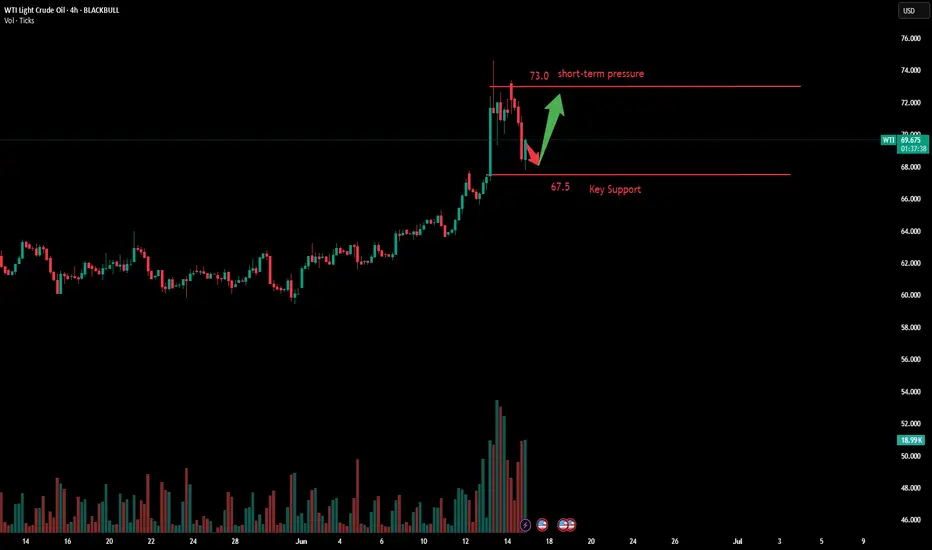
USOIL:Go long
USOIL:Crude oil rose sharply under the tension in the Middle East, the early repeatedly suggested that the continuous low shock after the upward breakthrough, the time of storage force is long enough, especially the watershed 64.8 break after the rising space has been opened, the trading idea is still to step back and do long.
Trading Strategy:
BUY@66.9-67.2
TP: 68.6-69
↓↓↓ More detailed strategies and trading will be notified here ↗↗↗
↓↓↓ Keep updated, come to "get" ↗↗↗

Bullish momentum remains robust.International oil prices surged then pulled back. Brent crude oil futures fell 47 cents to $69.40 per barrel, while U.S. West Texas Intermediate (WTI) dropped 33 cents to $67.84. In the previous session, both Brent and WTI recorded over 4% gains, hitting their highest levels since early April.
On Wednesday, U.S. President Trump stated that the U.S. is withdrawing some personnel from the Middle East due to the region's potential danger, reiterating that Iran will not be allowed to develop nuclear weapons. Meanwhile, market surveys showed the U.S. is preparing partial evacuations of personnel from its embassy in Iraq and allowing family members in Bahrain and other areas to leave. U.S. and Iraqi sources revealed the move primarily stems from heightened security risks in the region.
Current upward momentum in the oil market is driven by dual factors: geopolitical tensions in the Middle East and unexpected declines in U.S. inventories. In the short term, as long as tensions between Iran and the U.S. show no signs of easing, the market will continue to monitor potential supply disruption risks. Additionally, the alleviation of trade concerns and global economic recovery expectations will provide strong long-term support for oil prices. However, risks of sharp volatility from sudden deterioration in geopolitical situations should be vigilantly monitored.
With moving averages diverging upward, the short-term objective trend is clearly established as bullish. It is expected that crude oil prices will continue to rise and hit new highs.
Humans need to breathe, and perfect trading is like breathing—maintaining flexibility without needing to trade every market swing. The secret to profitable trading lies in implementing simple rules: repeating simple tasks consistently and enforcing them strictly over the long term.
Trading Strategy:
buy@65.5.0-66.0
TP:67.5-68.0
WTI Crude Oil 4H Chart – Bullish Setup from Demand Zone📈 Current Price: $61.74
🔵 Key Zones & Levels
🔹 Demand Zone (Buy Area):
🟦 $59.48 – $61.39
→ Price expected to bounce here
→ 🔄 Potential reversal zone
🔹 Entry Point:
🎯 $61.39
→ Ideal level to enter LONG
→ Just above demand zone
🔹 Stop Loss:
🛑 Below $59.48
→ Exit if price drops here
→ Protects capital
🔹 Target Point:
🚀 $67.00
→ Profit-taking zone
→ Strong resistance zone nearby:
* 66.63
* 66.75
* 67.60
📊 Indicators
📍 EMA (70): 🔴 61.40
→ Price trading above = bullish signal
→ EMA acting as support
📏 Trendline Channel:
🔼 Higher highs & higher lows
→ Supports uptrend continuation
📌 Trade Plan Summary
* Bias: 📈 Bullish
* Buy: At 61.39
* Stop: Below 59.48 🛑
* Target: 67.00 🎯
* Risk-Reward: ✔️ Favorable (~1:3)
🔍 What to Watch
* ✅ Bullish candles in demand zone
* 🔁 Retest of EMA or lower channel
* ❌ Avoid if it breaks below $59.48

USOUL:Go long near 65.5
USOIL:Crude oil broke through the watershed 64.85 after the emergence of strong unilateral bulls, daily cycle relying on short-term average to go even Yang form, rising space has opened, pay attention to the strong will continue at least a few trading days, short-term relying on 65 defense needs to be more, pay attention to 65.5 near the long, see 66.7-67
Trading Strategy:
BUY@65.5
TP: 66.7-67
↓↓↓ More detailed strategies and trading will be notified here ↗↗↗
↓↓↓ Keep updated, come to "get" ↗↗↗

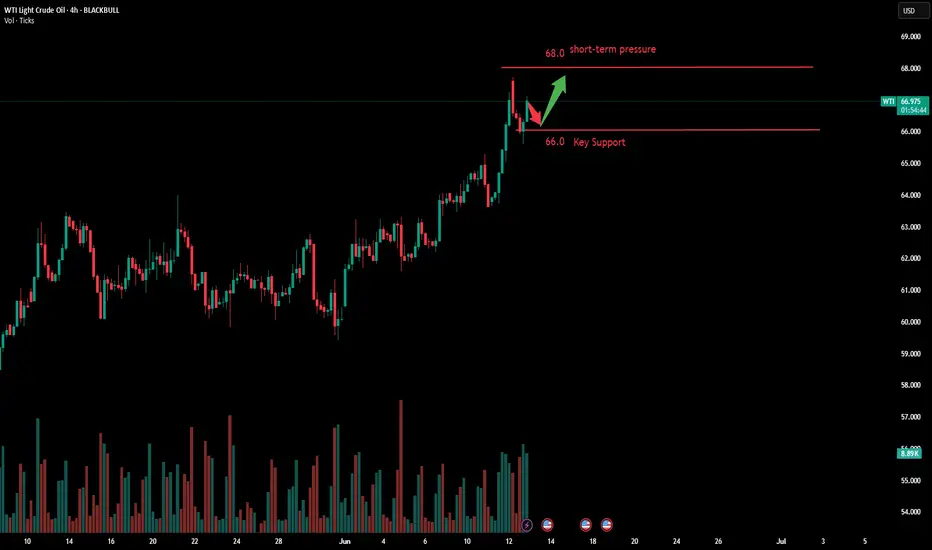
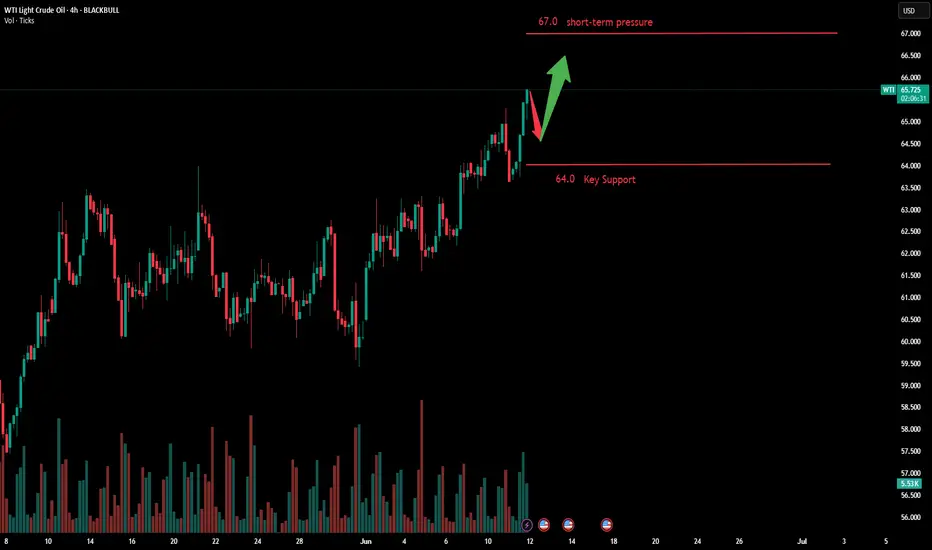
"Go long on crude oil with strong unilateral pullback"The market is weighing the impact of global trade tensions on the global crude oil demand outlook. After two days of intense consultations in London, the Asian giant and the U.S. have reached a framework agreement on restarting trade talks. U.S. Commerce Secretary Howard Lutnick said after the negotiations that the framework still needs review and approval from President Trump. Crude oil continued to rise after a pullback correction, showing a single bearish candlestick retracement pattern on the daily chart. With price supported at the MA5 level, it continues to make new highs, and this rally could target the 67.0 level.
Humans need to breathe, and perfect trading is like breathing—maintaining flexibility without needing to trade every market swing. The secret to profitable trading lies in implementing simple rules: repeating simple tasks consistently and enforcing them strictly over the long term.
Trading Strategy:
buy@64.0-64.5
TP:66.5-67.0
USOIL:Go short before you go long
USOIL:Crude oil trend in line with expectations to break 65, hourly level to see adjustment, trading can be done first short and then long. Here are my range trading ideas.
Trading Strategy:
SELL@65.4-65.5
TP:64.5-64.
BUY@64.5-64
TP: 65.3-65.5
↓↓↓ More detailed strategies and trading will be notified here ↗↗↗
↓↓↓ Keep updated, come to "get" ↗↗↗

Crude Oil Surges StronglyAs market participants await positive outcomes from negotiations between a major Asian economy and the U.S., crude oil prices edge higher modestly. During Tuesday's Asian session, Brent crude oil futures rose by $0.12 to $67.16 per barrel, while U.S. WTI crude oil gained $0.13 to $65.42, briefly hitting a new high since April 4th intraday. In the previous trading day, Brent surged to $67.19, the highest level since April 28th, primarily driven by market expectations of a potential deal between the U.S. and China.
Current oil prices stand at a crossroads of multiple factors. In the short term, the global trade landscape dictates the main thread of market sentiment. If a mitigation plan is reached, it will boost demand expectations. However, the resumption of Iranian exports and OPEC's production increase strategy may lead to a potential supply glut in the second half of the year, emerging as the primary risk suppressing oil prices.
Technically, the K-line has pierced below the moving average system, indicating a shift in the short-term objective upward trend. The formation of a large-bodied bearish candle in the subsequent session establishes the main rhythm, suggesting that oil prices may further decline to around $63.50 today before seeking new support.
Overall, today's trading strategy for crude oil is recommended to focus on rebound shorting as the primary approach and pullback long positions as a supplement. In the short term, monitor resistance at the $67.5-68.0 range, while support lies at the $65.0-64.5 level.
Humans need to breathe, and perfect trading is like breathing—maintaining flexibility without needing to trade every market swing. The secret to profitable trading lies in implementing simple rules: repeating simple tasks consistently and enforcing them strictly over the long term.
