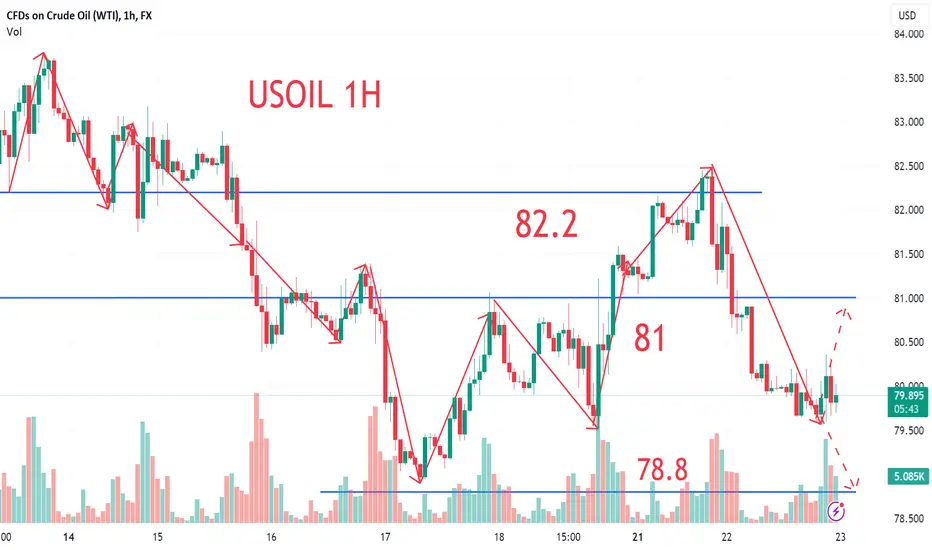
USOIL:Trading strategy
Oil fluctuated a lot last Friday, rising to 80.4, then fell under resistance, but finally rose again.
All when the oil falls to support, we can try to buy.
Usoil Today's trade building:
Usoil:buy79.2-79.6 TP:80.4-81
If you don't know how to trade yet, join me and learn how to trade, or let me guide you in trading.
Usoilanalysis

Potential Impact of EU Importing Russian Oil via Refined IndiaRecent developments suggest that the European Union (EU) might start importing Russian oil through refined products from India. As prudent traders, it is crucial that we pause and carefully evaluate the potential consequences of this situation.
Over the past few years, the EU has been actively diversifying its oil supply sources to reduce its dependency on a single region. However, reports indicate that the EU might explore alternative routes for importing Russian oil. Specifically, there are indications that Russia could export its oil to India, where it would be refined before being shipped to Europe.
While this development may seem like a mere shift in supply routes, it can disrupt the oil market dynamics. The EU's reliance on Russian oil has always been a concern due to geopolitical tensions and uncertainties surrounding the region. This new approach of importing Russian oil via refined products from India introduces a new layer of complexity and raises several questions:
How will this impact the oil market's overall supply and demand dynamics?
Will the EU's diversification efforts be compromised, potentially leading to heightened geopolitical risks?
Can we anticipate any price fluctuations or market volatility resulting from this potential shift?
Given the potential implications, I strongly encourage you to pause oil trading momentarily and take a cautious approach until further clarity emerges regarding the EU's decision and its impact on the market. It is crucial to carefully assess this development's potential risks and opportunities before making any significant trading decisions.
As the situation unfolds, I urge you to stay informed and closely monitor any updates from reliable sources. Engage in discussions with industry experts and fellow traders to gain insights and perspectives that can help inform your trading strategies moving forward.
In conclusion, the EU's potential decision to import Russian oil through refined products from India has the potential to impact the oil market significantly. We must exercise caution and evaluate the possible consequences before resuming trading activities. We can navigate this uncertain period and make informed trading decisions by staying informed and engaging in thoughtful discussions.
Thank you for your attention to this matter, and let us remain vigilant as we navigate these evolving market dynamics.

Crude oil prices reverse, or will launch a month-end sprint
Although the U.S. economic S&P global PMI and durable goods orders were weak last week, these did not dampen growth prospects. The Atlanta Fed’s GDPNow model predicts that the U.S. GDP growth rate in the third quarter will reach 5.9%. Federal Reserve Chairman Powell also said at the central bank's annual meeting that "the U.S. economy is stronger than expected." Both the markets of China and the United States have seen positive changes, which is undoubtedly an important driving force for the stabilization and upward movement of WTI crude oil prices. In the short term, there are other supply concerns that boost oil prices. For example, some predictions that Saudi Arabia will further extend voluntary production cuts until October are circulating in the market, and the possibility of tropical storms affecting the short-term crude oil production capacity of the United States also supports oil prices.
The four-hour chart shows that WTI crude oil prices stabilized and rebounded around 78 last week, and have now completed a bullish wedge-shaped reversal, which means that the downward trend from the August high has ended, and oil prices may turn upward. If it meets expectations, the initial upward target of WTI crude oil price will look at the 81.50-82 area, and the further upward target is also the more important resistance in the 83-84 area. If this resistance area is broken, the trend will gain a wider upward space.
And if it falls back in the short term, focus on the support of the 79-80 area. Holding this support area will maintain a bullish outlook. If it falls back to the inside of the wedge, the bullish outlook will be invalidated.

USOIL 1hr AnalysisHere is my short analysis on USOIL, if price breaks above the 80.35 price level, will look for a buy entry and my first target would be 81.64, if the price continues to be bullish, I have marked other Price targets above
What is your bias?

Factors Behind Rising Oil Prices: A Call-to-Action for ConsciousThe oil market is heating up, and it's time to seize this golden opportunity. The recent surge in diesel prices, a decline in oil rigs, and a refinery fire in Louisiana have caused oil prices to skyrocket. This is your chance to make a bold move and long oil!
First off, let's talk about the surge in diesel prices. Diesel prices have been climbing steadily, which has significantly impacted oil prices. Diesel is a crucial fuel for the transportation and industrial sectors, and its increased demand has put pressure on the oil market. As diesel prices continue to rise, so do the prospects for oil prices.
Adding fuel to the fire, we have witnessed a decline in oil rigs. With fewer rigs in operation, oil production has been affected, leading to a decrease in supply. As the saying goes, when supply dwindles, prices soar. This decline in oil rigs has created a perfect storm for oil prices to rise even further.
But that's not all! A recent refinery fire in Louisiana has exacerbated the situation. Refineries are vital in transforming crude oil into various petroleum products, including gasoline and diesel. The disruption caused by the fire has reduced refining capacity, leading to a tighter supply of oil products. As a result, oil prices have shot up, presenting an incredible opportunity for traders like you.
Now, here comes the call to action! It's time to take advantage of this exciting market scenario and long oil. By going long, you'll be betting on the continued rise in oil prices. This is your chance to make a profitable move and ride the wave of this upward trend.
But remember, trading involves risks, and it's crucial to do your due diligence and consult financial experts before making investment decisions. Stay updated on market trends, monitor news related to the oil industry, and keep a close eye on economic indicators that can impact oil prices.
So, traders prepare to dive into the oil market and capitalize on this incredible opportunity. Long oil and ride the wave of this price surge. The time is now, and the potential for profits is immense. Don't miss out on this exciting chance to make your mark in the oil trading world!

US OIL Analysis 27Aug2023US Oil analysis looks positive last week. price drops towards SnD area. if you look at the closing of the week the price was corrected but unable to form a new HH, chances are that next week the price will continue its bearish trend.

Crude oil: operation strategy, high and low
Oil prices continued to rebound at the opening and performed first. Overall, Fed officials believe that there may be no need to raise interest rates. The decline in European diesel inventories boosts oil prices, but demand concerns still limit oil price gains. During the day, we will pay attention to the speech of the chairman of the Federal Reserve at the annual meeting of global central banks. If the speech is dovish, the oil price is expected to return to above US$80/barrel. If it is hawkish, the oil price may drop sharply, pointing to US$75/barrel; market uncertainty risks increase, and trading needs to be cautious.
the
The trend of crude oil bottomed out twice in a row and closed up. There is a certain signal of bottoming out in the short term. There may be a continuation of the rebound in the market outlook, but the upper side needs to pay attention to the resistance of the middle rail line. Under pressure, there is a risk of going lower again. At the top, focus on the resistance around $80.40/barrel, and the operation is mainly short-selling

2408 USOIL plan has changed to the ABC wave downHello traders,
In my last idea, I was looking for a higher high C before USOIL making a new leg down. But it did not happen.
Now following the main trend still on daily chart, I would like to look for a new B as end of corrective wave before wave BC happen.
C is targeting FIbo ext 1.27 and S1.
B is targeting Fibo 382-618. Back to R1 is also possible. We need to keep eyes on the candles in the US session.
GOOD LUCK!!
LESS IS MORE!

USOIL IdeaUSOIL is in a bearish continuation pattern and will retest the resistance level to make a new LH and continue its movement towards the support level.

Short crude oil and keep making moneyThe crude oil trading strategy shared with you today, USOIL: @79.2-79.4 Sell, TP: 78.5. We made a good profit again, and the lowest crude oil fell to around 77.6 today.
Similarly, our crude oil trading strategy has successfully reached my expected profit target. Congratulations here to all friends who keep up with trading strategies.
Looking at the current structural trend of crude oil, although the local trend of crude oil has rebounded structurally, overall, the global manufacturing data is weak, increasing demand concerns. In addition, the short-term trend of crude oil fell below the lower support of the range. Although oil prices rebounded vigorously after hitting a new low, it only eased the continuity of the decline and failed to change the direction of the downward trend. Therefore, crude oil still has downside risks in the short term. Therefore, short-term trading of crude oil is still dominated by shorting at high levels.
There is no fluke in the market, we need more time to look for opportunities and be good at seizing them. And I spend a lot of time every day researching the market and profiting from it. Similarly, I also make more detailed trading plans and trading signals based on the market every day. The article has a certain lag. In order to grasp the market dynamics and trading plan in time, you can follow the bottom of the article to master the wealth code and create your own wealth!

USOIL UPDATEhi again
im waiting a breakout on daily support before continue short to wave C
Let me know what you think In the comments!
**My trading strategy is not intended to be a signal. It's a process of learning about market structure and sharpening my trading skills**
Thanks a lot for your support

USOIL TRADE IDEAhi all
Fibonacci expansion reached 1.618 and I'm now looking for a correction to level $82.40 before going short again and aiming for $74.
Let me know what you think In the comments!
**My trading strategy is not intended to be a signal. It's a process of learning about market structure and sharpening my trading skills**
Thanks a lot for your support

USOIL:Trading strategy
Oil has been fluctuating narrowly today, so today's trading is sold short when it reaches resistance, and bought when it reaches support. As long as you are not greedy, then you can make a profit today.
But the general direction of oil is still short selling, because it is still suppressed by the daily line and has not reached the support point.
Usoil Short-term trading:
Usoil:buy79.55-78.8 TP:80.3-80.6 SL: 78.3
In the long run, it is more risky not to fall to the support level, so you must strictly set the stop loss.
If you don't know how to trade yet, join me and learn how to trade, or let me guide you in trading.
2308 USOIL looking for a big Z move before new leg downHello traders,
USOIL turned down from fibo 382 just like we expected in this idea.
But it does not make a new low, at least no in this Asia morning. Seems like this way would be more possible. Making a new high up to C to finish a ABC corrective wave.
And then should wait for more signal to see if price would like to turn down again to FIBO ext 1.27 POSITION on this chart.
GOOD LUCK ON THIS PLAN.
LESS IS MORE!

Russia's Oil Exports Plummet to Lowest Volume Level Since JanIntroduction:
In a surprising turn of events, Russia's oil exports have hit their lowest volume since January, raising concerns within the trading community. This unexpected decline has far-reaching implications for the global oil market, warranting a moment of reflection and reconsideration for traders worldwide. In this article, we delve into the reasons behind this decline and propose a call to action, urging traders to pause oil trading temporarily.
The Unforeseen Decline:
Russia, one of the world's largest oil producers, has experienced a significant drop in its exports, catching many traders off guard. The recorded volume level was the lowest since January, sending shockwaves through the trading community. This decline raises several red flags and highlights the need for a cautious approach in the current market.
Factors Contributing to the Decline:
Several factors have contributed to Russia's plummeting oil exports. First and foremost, the ongoing China economic slowdown has severely impacted oil demand, reducing production and exports. Furthermore, geopolitical tensions, economic uncertainties, and changing market dynamics have all affected this downward trend.
The Call-to-Action: Pause Oil Trading:
Given the current circumstances, traders must take a moment to pause and reassess their trading strategies. The declining oil exports from Russia should serve as a wake-up call for the trading community. It is crucial to adopt a more cautious and responsible approach to trading oil, considering the volatility and unpredictability of the market.
Traders can mitigate potential risks by temporarily pausing oil trading and avoiding unnecessary losses. This pause allows for thoroughly evaluating market conditions, including supply and demand dynamics, geopolitical developments, and economic indicators. This step will enable traders to make informed decisions and adjust their strategies accordingly.
Additionally, this pause serves as an opportunity to explore alternative investment avenues. Diversifying portfolios and considering other commodities or sectors can help traders reduce their dependence on oil and navigate the market with greater resilience. Exploring renewable energy sources like solar or wind power could also be a long-term investment consideration.
Conclusion:
The recent decline in Russia's oil exports indicates that the global oil market faces unprecedented challenges. As responsible traders, we must pause and reevaluate our strategies in light of these developments. We can protect our investments, mitigate risks, and explore alternative opportunities by temporarily taking a step back from oil trading.
Let us collectively embrace this call to action and make informed decisions contributing to a more stable and sustainable trading environment. We can only navigate these uncertain times and emerge more robust in adversity through careful consideration and responsible action.

Crude oil: bottoming trend again
The main reason for crude oil to look down is: the rebound for several consecutive days touched the pressure and fell back. Or a more bullish view is the sub-wave 2 adjustment in the midst of 3 waves and 5 rises. Crude oil pressure 80.65~81.10, support 79.70~79~78.60.
Crude oil operation is recommended to enter at 81.1, take profit at 79.6, target at 79.2~79.5, and take profit at 80.3 (the point may be revised as the market changes during the session, and the real-time strategy shall prevail)

Crude oil: peaking again
Crude oil should have mentioned that it will rebound, and the rebound trend is not small. It has already come out this time. From the indicators, the high point of this rebound is around 82. If the peak trend remains unchanged, this Nearby is more difficult to break.
Moreover, crude oil is negatively correlated with the U.S. dollar in a certain trend. The sharp rise of the U.S. dollar will also affect the price of crude oil. Gold is in a weak position, but crude oil is due to factors such as production cuts and expectations of interest rate hikes. The price of crude oil continues to soar, but still the same sentence, the reduction in interest rate hike expectations has been large enough. As long as there is something that is not conducive to the suspension of interest rate hikes, the interest rate hike expectations will still rise, and crude oil will be under pressure.
Strategy: 81.7 buy up 83.4 buy down
The demand for crude oil is expected to increase, but crude oil is not the same as gold after all. Crude oil has no currency attribute after all. Although it also has a hedging attribute, it is still not as strong as gold, and the aspects that can be affected are not as extensive as gold, so the demand for crude oil The expected increase in volume is also a matter of this year, but the price will not be too inclined.

USOIL LONG SWING TRADE SETUPHey folks!! welcome to another week filled with opportunities. First on the menu is USOIL LONG swing set up. The pair has been trending up and recently had multiple break of structures on the daily and 4HR time frames. After making higher highs, price has now delivered lower into the demand level that caused this break of structures.
Price has now started to deliver back up after tapping into this Point of interest (POI) with multiple confluences indicating a move back up. Intra-day structure is now bullish on the 4 hour time. Our first target will be 84.83 and will be looking to partial out here possibly to hold a fraction of the trade to continue delivering higher.
Make sure to practice good money and proper risk management on all your trades.

USOIL:summary
Oil is the same as I expected. It has fallen below the five-day line since Monday and fell below the rising channel on Wednesday. I judge that oil will be adjusted this week, so this week's strategy is to sell short if it rebounds.
But before the close of trading on Friday, it rose again by 81.35 to reach the lower edge of the rising channel, so next week we must look again and wait for the market to make a new choice.
We will trade oil cautiously next Monday and wait for the trend to be obvious before trading, so that we will be safer.
If you don't know how to trade yet, join me and learn how to trade, or let me guide you in trading.

USOIL Bearish Trend ContinuationUSOIL is making LL and LH in the parallel channel, most likely it will retest the marked zone and continue the bearish movement toward the support level.

1808 USOIL looking for a correction before new lowHello traders,
USOIL seems has finished its 1st leg down and now is making a corrective wave.
Fibo 382-618 is the possible ending position for corrective wave.
Suggest to check with 382 first because it is also a position where price hit daily EMAS.
The new selling plan is looking for a new low to down to the target zone marked on this chart.
GOOD LUCK ON THIS PLAN.
LESS IS MORE!

Navigating the Unpredictable Oil Market: A Call to Closely Monit
Introduction:
In recent months, the global economy has been grappling with the unprecedented challenges brought about by the COVID-19 pandemic. As the world slowly recovers, the Federal Reserve's recent statements regarding inflationary pressures have sparked concerns about the demand for energy, particularly oil. This article aims to shed light on the potential impact of these developments on the oil market and urges traders to adopt a cautious approach while closely monitoring oil prices.
Understanding the Federal Reserve's Inflation Concerns:
The Federal Reserve, in its efforts to stabilize the economy, has expressed concerns over the possibility of inflation not receding as quickly as anticipated. Rising inflation can have far-reaching consequences, dampening consumer spending power and reducing energy demand. As traders, it is crucial to recognize that the oil market is not immune to these potential repercussions.
The Interplay Between Inflation and Oil Demand:
Historically, inflationary pressures have often led to decreased demand for energy as businesses and consumers adjust their spending habits. Higher prices for goods and services can strain budgets, leading to reduced discretionary spending on energy-intensive activities. Consequently, this can impact the demand for oil and its derivatives, causing fluctuations in the market.
The Importance of Monitoring Oil Prices:
Given the uncertain economic landscape, traders must monitor the price of oil closely. By watching market trends and developments, traders can gain valuable insights into the potential impact of inflation on energy demand. This information can help inform trading strategies and enable traders to adapt to changing market dynamics effectively.
Call to Action: Exercise Caution and Stay Informed
As traders, it is essential to approach the current oil market with caution and prudence. The Federal Reserve's concerns regarding inflationary pressures should serve as a reminder that the energy sector may experience volatility in the coming months. Therefore, we strongly encourage you to closely monitor oil prices, market indicators, and economic news to make informed trading decisions.
By staying informed and maintaining a vigilant watch on oil prices, traders can better navigate the potential challenges of inflationary pressures. Consider utilizing reliable sources of market information, engaging with industry experts, and leveraging data-driven analysis to stay ahead of the curve.
Conclusion:
In an era of economic uncertainty, monitoring oil prices becomes paramount for traders seeking to optimize their strategies. The Federal Reserve's concerns about inflation not receding as quickly as expected underscore the need for caution and vigilance. By closely following oil prices and staying informed about market developments, traders can position themselves advantageously and make informed decisions in the face of potential fluctuations in demand for energy.

USOIL - Long from bullish order block ✅Hello traders!
‼️ This is my perspective on USOIL.
Technical analysis: Here we are in a bullish market structure from 4H timeframe perspective, so I am looking for long. I want price to continue the retracement to fill the imbalance lower and then to reject from 1H bullish order block.
Like, comment and subscribe to be in touch with my content!
